MARKETING SITUATIONS AND SOLUTIONS FOR PRODUCTS OF HAIHA CONFECTIONARY JOINT - STOCK COMPANY
Bạn đang xem bản rút gọn của tài liệu. Xem và tải ngay bản đầy đủ của tài liệu tại đây (598.22 KB, 42 trang )
FOREIGN TRADE UNIVERSITY
FACULTY OF BUSINESS ADMINISTRATION
---------***--------
REPORT OF MID-TERM INTERNSHIP
MARKETING SITUATIONS AND SOLUTIONS FOR
PRODUCTS OF HAIHA CONFECTIONARY JOINT STOCK COMPANY
Full name: Nguyen Thi Quyen
Student ID: 1111250031
Class: A14 CLC QTKD K50
Guidance teacher: Ms. Le Thu Hang, MBA
Hanoi, July 2014
TABLE OF CONTENT
Table 2.5: A number of Haiha bakery stores (year 2012)......................................................30
LIST OF TABLE
Table 2.5: A number of Haiha bakery stores (year 2012)......................................................30
1
EXECUTIVE SUMMARY
In recent years, along with the development of the economy and the population
growth rapidly, the demand for food which improved people’s living standard is
markedly necessary. One of the most important manifestations is demand for
confectionery.
In fact, confectionery field of Vietnam has a quite stable development stages. It
is estimated about 7,473 billion the overall worth of Vietnam market. Confectionery
field in Vietnam has ability to maintain high growth level and become one of the
biggest markets in Asia – Pacific area. In order to have this position, enterprises must
have right marketing strategies because marketing makes living quality much better.
Marketing helped business flexible, understand customers’ demand, win competitors
and then get profit.
There are now more than 30 confectionery manufacturing enterprises which
have reputation. Hai Ha Confectionery Joint Stock Company (HAHACO) is one of the
leading confectionery manufacturers of Vietnam which consumers believe to utilize.
The company specializes in producing all kinds of confectionery items with a
diversified variety of designs and models such as biscuits, cakes, sponge candy, soft
candy, hard candy. These items have made customers satisfied as company’s
expectations because the company has focused on advertising effectively.
In order to have better overview of company’s marketing activities, I have
chosen the topic: “Marketing situations and solutions for products of HaiHa
Confectionery Joint - Stock Company”
The report is divided into four chapters:
In chapter 1, the author gives a brief presentation on the establishment and
development of Hai Ha Confectionery Joint Stock Company (HAHACO) and
introduction about their functions, missions and the company’s structure. In additions,
there are overviews of results of business activities at HAHACO in recent years.
In chapter 2, the author presents theoretical framework which is supported to
2
the report. This chapter covers key terms and definitions of marketing, targeted
customers, market segmentation, etc. Moreover, the author will mention about role of
marketing and factors affecting marketing activities such as marketing environment
(economy, society), budget, customers or competitors.
Then, in chapter 3, by doing research of targeted market, product strategies,
price strategies, distribution strategies and promotion mix strategies, the author gives
evaluations both advantages and disadvantages about marketing situations at
HAHACO as well as HAHACO’s achievement and failures.
Finally, in chapter 4, the author makes some recommendations and solutions to
strengthen marketing activities at HAHACO.
Due to my limitation of knowledge, skills and experience, mistakes and faults
are inevitable. I welcome all comments, advices and suggestions that help me improve
the quality of the report.
Finally, I would like to express my gratitude to my instructors and HAIHACO
staff for helping me complete my mid-course internship.
3
CHAPTER1: OVERVIEW ABOUT HAIHA CONFECTIONARY
JOINT- STOCK COMPANY
1.1.General introduction
Name of company: HaiHa Confectionery Joint - Stock Company
Transaction name: HaiHa Confectionery Joint - Stock Company
The company is established as decision No. 191/QD - BCN on 23/11/2003 of the
Ministry of Industry directly under Vietnam Tobacco Corporations
Head quarter : No. 25 Truong Dinh street, Hai Ba Trung District, Hanoi
Abbreviation name: HAIHACO
Web:
Telephone number: (+84.4) 8632956 / 8632041
Fax: (84 4) 8631 683 8 638730
Tax code: 0101444379
Bank account: 1020.10000054566 in the branch of Industrial and Commercial
Bank, 275 Nguyen Trai Street, Thanh Xuan District, Hanoi.
Email:
Charter capital: 36.500.000.000 VND
1.2 History and development progress
HaiHa Confectionery Joint - Stock Company, which is under the Ministry of Light
Industry, was established on 25th December, 1960 for the confectionery production to
meet domestic demand and export partly. In 2003 the company implemented
equitization under No. 191/2003/QD-BCN decision dated 14/11/2003 of the Ministry
of Industry (now the Ministry of Industry and Trade). The company was granted the
certificate of business registration No. 010300614 dated 20 th January, 2004 and the
second change on 13th August, 2007 by Department of Planning and Investment of
Hanoi.
After more than 50 years of development, the company has experienced significant
milestone follows:
4
1.2.1 Period 1959 – 1961
On November 1959, Northern native agricultural products corporation has built
an empirical establishment for researching pearl beads with 9 officers and employees
of the Corporation. At the beginning of 1960, implement the policy of companies,
bench has studied in depth and produced vermicelli items from green bean. On that
basis, Hoang Mai vermicelli workshop was born on 2nd December 1960.
1.2.2 Period 1962– 1967
At this time, Hoang Mai vermicelli workshop has been tested successfully and
been in production some items such as soybean oil and corn starch providing for Van
Dien battery factory.
In 1966, Botanical Institute has taken this place as an establishment for the trial
production of food topics. Since then, it had disseminated to local to produce, to solve
logistics on a spot which was suitable in war situation. And from that, Hoang Mai
vermicelli workshop renamed Hai Ha food empirical factory. In addition, the factory
also produced a number of other items such as bullets, fermented sauce, fruit sauce,
protein oil, bread and nutrition flour. And an important thing is the factory initially
studied malt in order to become Confectionery Company.
1.2.3 Period 1968– 1991
In 1968, the factory was managed by the Food Department. By June 1970,
according to the directives of the Food Department, the factory has accessed Hai Chau
confectionery workshop to hand over with 900 tons/year for producing dental gum,
starch paper . on 1970, it was renamed Hai Ha food factory with 444 people.
On December 1976, the factory was approved to expand area with the capacity
from 900 tons / year to 6000 tons / year. The factory gradually expanded the scale of
production, equipped with many new production lines, technical innovation, advanced
technology, step by step to meet the needs of the consumer better.
Until 1987 the factory was again renamed into Hai Ha exporting confectionery
factory managed by the food agriculture and industry department. The company's
5
products are consumed not only in domestic but also in the foreign as well. The speed
for growth of annual output reached from 1 percent to 15 percent and manual
production has gradually mechanized 70 80 percent with state funds received from the
day 01/01/1991 was 5 454 000 000 dong.
1.2.4 Period 1992 to 2002
On January 1992, the factory was managed by the light industrial Department.
On July 1992, it was changed to Hai Ha Confectionery Joint - Stock Company
In the situation of the large fluctuations of the market, there are many
difficulties for enterprises to adapt new regime, yet HAIHACO still stood firm in the
face of difficults and grew.
In 1993, establishment of Hai Ha Kotobuki joint venture. Main products are
hard candy, snack, cookies and gum. Until now, this joint venture has still operated
efficiently.
In 1995, establishment of Viet Tri Miwon glutamate joint Venture Company.
In 1996, establishment of the third joint venture was Kameda Haiha in Nam
Dinh, but unfortunately this joint venture company has been in operation less efficient
and dissolved on November 1998 .
1.2.5 Period 2003 to now
In 2003, the company implemented equitization under the decision No
192/2003/QD-BCN of Industry Department on 14/11/2003. From 1/2004, the company
has been operating in the form of a joint stock company by the certificate of business
registration No 0103003614 issued on 20/01/2004 by the Department of Hanoi
Planning and Investment. And then it changed the second time on 08/13/2007.
The company was approved for listing its shares on Hanoi Stock Exchange
Center No. 312/QD-TTGDHN dated 08/11/2007 and traded officially from the date of
20/11/2007.
The prestige of the company over time increased, so far the company has five
factories including 2 joint venture companies with nearly 2,000 people and modern
equipment. The company is state enterprise which has integrated legal, independently
economic accounting, opened bank accounts and used the seal as the state prescribed.
6
1.3 Functions and missions
Hai Ha Confectionery Joint - Stock Company was founded with the function of
producing candy to meet domestic demand and export. In order to implement the
assigned functions, Board of Directors and all employees of the company must
perform the following tasks:
Firstly, it is necessary to increase investment in depth with the purpose of
enhancing product quality, increasing productivity, diversifying products so as to
expand market.
Secondly, it is very important to build the strategy for confectionery production
technology and a number of other products from 2010 to 2020, strength technological
innovation and improve the quality of products to increase competitiveness.
Finally, the firm needs to identify the primary market, secondary market, focus on
new markets and pay more attention to export markets, particularly the foreign
markets.
1.4 Professions and business fields
Activities of the company were followed the business certificate No 0103003614
which changed on August 13, 2007 is:
- Manufacture of bakery products.
- Processing of milk and dairy products.
- Manufacture of starches and starch products.
- Production of sugar.
- Manufacture of cocoa, chocolate and confections and preserved fruits.
- Manufacture of other products such as:
+ Production of coffee products.
+ Roasting and filtering coffee.
+ Manufacturing substitutes for coffee.
7
- Production of non-alcoholic beverages, mineral water.
- Wholesale food. For example: Wholesale sugar, milk and dairy products, candy
products and the products of cereals, flour, starch, coffee.
- Wholesale beverages.
- Retail food in specialized stores. For instance:
+ Retail sugar, milk and dairy products, bread, jelly, candy and other products made
from cereals, flour, starch in the specialized shops;
+ Retail coffee powder, instant coffee;
- Beverage Services (excluding bars).
- Wholesale of machinery, equipment and other machine parts.
- Investing in construction, leasing offices, residential, commercial centers, consulting,
managing, real estate advertising; Import and Export commodities company business.
Main products:
+ Candy: Chew Candy, soft candy, hard candy lollipop (Haiha pop), Jelly Candy .
+ Cake: Advanced soft Cake, chocolate covered cake, biscuits, crackers, wafers, wafer
tube (Miniwaf), Snack.
+ Box Candy, moon cake (seasonal business products).
+ Instant coffee.
8
1.5 Organizational structure
Board of
directors
Board of
controllers
General
Director
Deputy General Director
of Technology
Department of
developing
technology
Department of
testing quality
Hai Ha
Confecti
onery
Factory
Deputy General Director
of Finance
Office
Confecti
onery
Factory
Department of
Plan Market
Supply
Office
Department of
Finanace
Auxiliary
Factory
Source: Charter of the Company was revised in 2007 by the Department of General
Administration
9
1.6 Business situation and result of HAIHACO in 4 recent years
Table 1.1: Income statement in 4 recent years
INCOME STATEMENT
Net revenue
Cost of goods sold
Gross profit
Financial income
Financial expenses
Selling expenses
General and Administrative expenses
Operating profit
Other profit
Profit/Loss of investments in associates and joint ventures
Profit before tax
Net profit after tax
Profit after tax for shareholders of the parent company
Earnings per share (VND)
Year
Year
Year
Year
2013KT/ĐL 2012KT/ĐL 2011KT/ĐL
2010KT/ĐL
737,575
602,642
134,933
3,729
60
64,758
44,008
29,837
1,895
676,798
573,562
103,237
4,499
81
46,433
37,397
23,824
5,358
31,731
23,761
23,761
2,893
29,182
21,887
21,887
2,665
527,586
448,786
78,799
1,223
86
28,641
27,696
23,598
1,613
25,211
18,908
18,908
3,454
Source: Compiled from audit reports of the Department of the accounting in stage of 2010-2013
637,220
544,348
92,872
2,227
304
35,973
35,196
23,626
3,376
27,001
20,251
20,251
2,774
10
Table 1.2: Balance sheet in 4 recent year
Year
Year
2013
2012
KT/ĐL
KT/ĐL
Current assets
207,745
197,119
173,101 156,894
Cash and cash equivalents
58,999
80,654
45,088
28,400
Short-term investments
30,000
-
-
Short-term receivables
33,287
28,328
23,132
23,956
Inventories
83,871
86,312
100,951 100,970
Other current assets
1,589
1,824
3,929
Non-current assets
107,465
103,208
115,232 67,503
Fixed assets
48,366
43,426
54,917
52,946
Investment properties
-
-
Long-term investments
-
-
BALANCE SHEET
Year 2011
Year 2010
KT/ĐL
KT/ĐL
3,568
Total assets
315,210
300,326
288,333 224,397
Liabilities
120,112
115,481
109,507 96,633
Short -term liabilities
119,820
115,188
105,616 93,506
Long-term liabilities
293
293
3,891
Owner's equity
195,097
184,845
178,826 127,763
Charter capital
82,125
82,125
82,125
54,750
Share premium
22,721
22,721
22,721
3,656
3,127
11
Retained earnings
1,995
1,995
4,308
10,057
Minority interest
-
-
Total owner's equity and liabilities
315,210
300,326
Source: Compiled from audit reports of the Department of the accounting in stage of 2010-2013
288,333 224,397
12
Table 1.3: Basis financial ratios
RATIOS
Year 2013
Year 2012
Year 2011
Year 2010
KT/ĐL
KT/ĐL
KT/ĐL
KT/ĐL
Earnings per share (EPS)
VND
2,893
2,665
2,899
Book value per share (BVPS)
VND
23,756
22,508
21,775 23,336
P/E
Times
7.12
5.74
4.8
7.64
P/B
Times
0.87
0.68
0.64
1.13
Gross profit margin
%
18.29
15.25
14.57
14.94
Net profit margin
%
3.22
3.23
3.18
3.58
ROE
%
12.51
12.04
13.21
15.86
ROA
%
7.72
7.44
7.9
9.07
Short-term ratio
Times
1.73
1.71
1.64
1.68
Interest coverage
Times
1,685.79
1,486.02
89.76
(3,518.94)
Liabilities to assets
%
38.11
38.45
37.98
43.06
0.14
0.24
Debt to equity
%
0.13
0.14
Source: Compiled from audit reports of the Department of the accounting in stage of 2010-2013
3,454
13
Table 1.4: Business result from 2010–2013
Year 2010
Year 2011
Year 2012
Year 2013
Total revenue
530,422
642,823
686,655
743,199
Net revenue
Financial
527,586
637,220
676,798
737,575
income
Other profit
1,223
1,613
2,227
3,376
4,499
5,358
3,729
1,895
Total expense
505,209
615.821
657,473
711,468
sold
Financial
448,786
544,348
573,562
602,642
expenses
Selling
86
304
81
60
expenses
General
28,641
35,973
46,433
64,758
27,696
Profit before tax 25,221
35,196
27,001
37,397
29,182
44,008
31,731
Cost of goods
and
Administrative
expenses
14
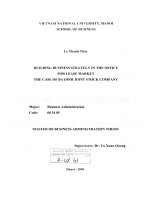
Table 1.5: The chart of the revenue, expense and profit before tax in the period of 2010–2013
Unit: million dong
Through above table and chart, we can realize that total revenue of company
increases gradually over the period. In 2011, total revenue rose 21, 19% compared with
2010, it increases 6, 8% in 2012 compared with 2011, and go up to 8, 2% in 2013
compared with 2012. It is clear that this rate has slowed down in later. As you can see,
financing crisis was light in 2008 and strained in 2011 leading to quick growth in the
period of 2010–2011 but slow development in 2012. However, in economic crisis, the
company got more 21% (year 2011) was a big success.
Total revenue is formed from 3 main sources including net revenue, financing
income, other profit. In particular, net revenue accounted the highest density for more
than 99%, financing income make up the smallest density only from 0, 17% to 0,66% so
that they did not also affect the trend of total revenue. Finally, other profit has small and
irregular proportion.
15
Due to the impact of the global financial crisis and in Vietnam, the total cost of the
company also increased gradually at the same rate with total revenue, detailed as follows:
21.89%; 6.76%; 8.21%. It is this also explains why the total revenue of the company rose
but profits decreased as shown in Table 1.1. However, in the period 2010-2013, the profit
before tax has increased by 32.14%. This is a good result, especially with the first joint
stock company in the period of economic crisis.
Ratio of debt by total capital of the company is always at a safe and stable level
through years, ranging from 38% to 47%.
Ratio of profit before tax / total assets (ROA) of the company fluctuated around
10% that is each 10 dong property, the company makes 1 dong profit before tax; ratio of
profit after tax / equity (ROE) decreased over the years from 15.86% in 2010 to 12.51%
in 2013. Compared with the average interest rate during this period, there is a bit higher
but not really attractive to investors.
To sum up, the above table shows that in the period 2010-2013, the production of
the company developed in unfavorable economy conditions well.
16
CHAPTER 2: THEORETICAL FRAMEWORK
2.1 Key terms and definitions
2.1.1 Marketing
Marketing, more than any other business function, deals with customers.
“Marketing is managing profitable customer relationships”. The twofold goal of
marketing is to attract new customers by promising superior value and keep and grow
current customers by delivering satisfaction.
Sound marketing is critical to the success of every organization. Today, marketing
must be understood not in the old sense of making a sale–“telling and selling” –but in the
new sense of satisfying customer needs. If marketer understands customer needs,
develops products that provide superior customer value, and prices, distributes, ad
promotes them effectively, these products will sell easily.
In other word, marketing is a social and managerial process by which individual
and organizations obtain what they need and want through creating and exchanging value
with others. Hence, marketing is defined as the process by which the companies create
value for customers and build strong customer relationships in order to capture value
from customers in return.
2.1.2 Marketing research
Marketing research is the systematic design, collection, analysis and reporting of
data relevant to a specific marketing situation facing an organization.
Marketing research process has 4 steps: defining the problem and research
objectives, developing the research plan, implementing the research plan and interpreting
and reporting the findings.
17
2.1.3 Targeted customers
Target customer is the person you've identified as most likely to purchase your
products, according to Entrepreneur.com. This is a much more segmented portion of your
target market, as you've identified certain aspects of this individual. These components
might include a specific age instead of a range, a specific income level versus a large
swath of income types, and the reasons these customers are most likely to purchase your
products.
2.1.4 Market segmentation
Market segmentation is to divide a market into smaller segments with distinct
needs, characteristics, or behavior that might require separate marketing strategies or
mixes, which can be reached more efficiently and effectively with products and services
that match their unique needs.
2.1.5 Methods of segmenting customer markets
Geographic segmentation: dividing a market into different geographical units such
as nations, states, regions, countries, cities or even neighborhoods.
Demographic segmentation: dividing the market into segments based on variables
such as age, gender, family size, family life cycle, income, occupation, education,
religion, race, generation and nationality.
Psychographic segmentation: dividing a market into different segments based on
social class, life style, or personality characteristics. People in the same demographic
group can have every different psychographic characteristic. Marketers also use
personality variables to segment markets.
2.2 Role of marketing
Marketing decides and coordinates the connection of business activities of the
enterprise to the market. It is to ensure business operations of the enterprise oriented to
market, know to choose the market, needs and wants of the customer support solidly for
all business decisions.
18
2.3 Factors affecting marketing activities
Customers
Customers are decisive factors for success or failure of your business. If the
company's products were brought to market with little demand, the cheap price and
strong distribution channels is also not effective. So when planning the strategy for
product, the company has research about habits, lifestyles, consumption patterns,
determines exactly needs of our customers.
Table 2.1: Confectionery consumer tastes each region
Area
North area
Central area
Miền Nam
Very
fond
Like salinity, moderately Like sweets, spicy.
sweet.
Often
sweetness and fruit
purchase flavor.
Primary
Often purchase under under the weight or Often
consumer
package,
characteristics
about
packaging.
more
forms
of
care retail
purchased
under weight or buy
of Less interested in package
packaging forms.
Less interested in
packaging forms.
Consumer
Less change
No change
Less change
trends
Source: Compiled from market research report of Department of Plan – Market in stage
of 2010-2013
19
Table 2.2: Confectionery consumption tastes by age and income
Income
Age
Request
about
product
Showy colors
2-14
Enclosed toys
Do
not
Quantity
Like
Motivation
to buy
small Adults
package
Purchase
many times
product
buy Hard Candy,
for
Soft Candy,
Purchase to Jelly Candy,
eat
Normal
care
cookies,
about the price
15-45
Low
Familiar
Moderate quality Big quantity
Party
Wafers
Hard candies,
Cheap price
Holidays
soft
irregular
candies,
weight candy,
Care
about
Wedding
design
normal
biscuits,
weight cakes.
More than
46
Moderate quality Small
Gifts
quantity
Reasonable price Occasion
wafers,
Holidays
Buy
for soft candy
Medium design
Care
15-45
descendant
about Small
quality
quantity
Reasonable price Irregular
mẫu mã
46
Party
Holidays
Hard
candy,
soft
candy,
caramel
candies,
Quan tâm đến
Medium More than Good quality
Biscuits,
Small
quantity
Wedding
wafers,
Gifts
biscuits
Hard candy,
soft
caramel
candy,
20
Reasonable price Occasion
Nice design
Holidays
For
candy,
descendant
crackers,
Jelly
candy, saltine
wafers,
Good quality
Big quantity
Do not care
sometimes
about the price
Nice design
Desserts
Boxed
Gifts
crackers
Sponge
Holidays
candy,
Party
Wedding
caramel
candy,
Jelly
candy, saltine
15-45
crackers,
chocolate
High
covered
wafers, boxed
Good quality
Do
not
Small
quantity
care
much about the sometimes
More than price
Nice design
46
Gifts
crackers.
Soft
candy,
caramel
candy,
Holidays
Descendant
Desserts
Jelly,
saltine
crackers,
chocolate
covered
wafers, boxed
crackers
Source: Compiled from market research report of Department of Plan – Market in stage
of 2010-2013
Competitors
21
Now, Vietnam confectionary market has quite fierce competition. Besides more than
30 confectionery manufactory, there have hundreds of small confectionary manufactories
and imported products. Can be included a number of major competitors of the company
such as Hai Chau Confectionery Company, Trang An confectionery company, Kinh Do
Limited company, Huu Nghi Confectionery Company, ….
Budget for marketing activities
Table 2.3: Budget for marketing activities
Unit: Million dong
Year
Budget
Total expense
The proportion of the total
2010
26.277
505.539
5,20%
2011
31.092
615.821
5,05%
2012
37.310
732.826
5,09%
2013
cost
The budget for marketing activities has increased annually, accounting for about
5% of the total cost which Department of Plan and Market manages and allocates. This
cost is relatively lower than 10% of sales that the general regulations of the state set out
for company’s marketing activities. With this budget, the company has created a strong
system of distribution channels and relatively large consumption output. However,
company should spend on marketing activities and Department of Plan and Market needs
to select and allocate appropriate budget for the agencies, markets, Haiha Bakery shops to
create vast sales network.
Economy – Society
Trend of social and cultural environment greatly affects the shopping way of
consumers. Due to rapid population growth and high standards of living, the demand for
confectionery products also increases dramatically. In fact, consumer habits, religions,
22
ages and standard of living influence on consumption situation of enterprises. Therefore,
companies should care and study cautiously to give appropriate solutions.
During the stage of developing economies, GDP per capita is increasing, for example,
in 2011, GDP reached 1300USD/person. Sector factors such as inflation and especially
economic crisis in 2008 have affected remarkably confectionery consumption situation of
consumers. Besides, the gap between the rich and poor is a major challenge for the
company since the company's products are to serve consumers with the low and medium
price.