CFA 2018 quest bank r43 portfolio risk and return part II q bank
Bạn đang xem bản rút gọn của tài liệu. Xem và tải ngay bản đầy đủ của tài liệu tại đây (380.8 KB, 16 trang )
Portfolio Risk and Return: Part II – Question Bank
www.ift.world
LO.a: Describe the implications of combining a risk-free asset with a portfolio of risky
assets.
1. Investor A invests only in risky assets. Investor B invests in risky assets and the risk free
asset. Which of the following is most accurate?
A. For a given level of risk, Investor A’s maximum return is depicted by the CAL and
Investor B’s maximum return is depicted by the efficient frontier.
B. For a given level of risk, Investor A’s maximum return is depicted by the efficient
frontier and Investor B’s maximum return is depicted by the CAL.
C. For a given level of risk, the maximum return for both investor is depicted by the
efficient frontier.
2. A portfolio has a risk-free asset and two risky assets. Which of the following is most likely to
be a depiction of the risk and return of this portfolio?
A. Capital allocation line.
B. Security characteristic line.
C. Security market line.
3. Sam, an investor, would have an optimal portfolio with respect to the capital market theory,
if the portfolio with a risk-free and a risky asset has the highest:
A. capital allocation line slope.
B. expected return.
C. indifference curve.
4. Roger Phillips is a highly risk-averse investor. A majority of wealth is most likely to be
invested in:
A. an optimal risky portfolio.
B. risk-free assets.
C. risky assets.
5. A portfolio with equal parts invested in a risk-free asset and a risky portfolio will most likely
lie on:
A. the security market line.
B. a capital allocation line.
C. the efficient frontier.
6. An investment in only one asset type has a worse risk-return tradeoff than an investment in a
portfolio of a risk-free asset and a risky asset. This is because the correlation between the
risk-free asset and the risky asset is equal to:
A. -1.
B. 0.
C. 1.
LO.b: Explain the capital allocation line (CAL) and the capital market line (CML).
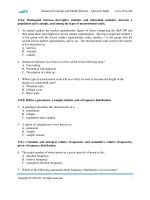
7. If the borrowing rate is higher than the lending rate:
Portfolio Risk and Return: Part II – Question Bank
www.ift.world
A. the slope of the lending part of CML will be equal to the slope of the borrowing part
of the CML.
B. the slope of the lending part of CML will be greater than the slope of the borrowing
part of the CML.
C. the slope of the lending part of CML will be less than the slope of the borrowing part
of the CML.
8. Which of the following combinations is most likely to have its portfolio’s risk and return
presented in the form of the capital market line, CML?
A. Risk-free asset and market portfolio.
B. Risk-free asset and any risky portfolio.
C. Risky asset and a leveraged portfolio.
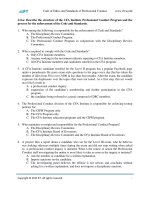
9. Based on the following graph, X is most likely to be considered:
X
A. inefficient.
B. inferior.
C. unachievable.
10. XYZ is a portfolio on the capital market line. The returns on the market portfolio are greater
than the returns on the portfolio XYZ. XYZ is most likely to be:
A. borrowing portfolio.
B. lending portfolio.
C. unachievable portfolio.
11. In defining the CML, we assume that all investors have the same expectations for securities.
This results in:
A. a single optimal risky portfolio called the market portfolio.
B. a portfolio of assets with the same risk.
C. a portfolio of assets with the same returns.
12. Which of the following assumptions of the capital market theory allows for optimal risky
portfolio i.e. market portfolio to exist?
A. All investors plan for the same holding period.
B. All investors are price takers.
C. All investors have homogeneous expectations.
Portfolio Risk and Return: Part II – Question Bank
www.ift.world
13. In accordance with the capital market theory, the optimal risky portfolio is most likely to:
A. have the lowest expected variance.
B. have the highest expected returns.
C. be the market portfolio.
14. As compared to a market portfolio, a borrowing portfolio on the capital market line is most
likely to have:
A. lesser returns.
B. equal returns.
C. greater returns.
LO.c: Explain systematic and nonsystematic risk, including why an investor should not
expect to receive additional return for bearing nonsystematic risk.
15. Risk that can be attributed to factor(s) that impact the market is least likely described as:
A. systematic risk.
B. non-diversifiable risk.
C. unsystematic risk.
16. Which of the following is least likely to be synonymous with systematic risk?
A. Market Risk.
B. Undiversifiable Risk.
C. Firm-specific Risk.
17. Which of the following is most likely to be an example of a nonsystematic risk?
A. Major oil discovery.
B. Natural disaster.
C. Political uncertainty.
18. In accordance to the capital market theory, which of the following risks is priced?
A. Non-systematic risk.
B. Systematic risk.
C. Total risk.
19. Which of the following statements is most likely to be correct?
A. The sum of an asset’s systematic variance and its nonsystematic variance of returns is
equal to the asset’s total variance.
B. The sum of an asset’s systematic standard deviation and its nonsystematic standard
deviation of returns is equal to the asset’s total risk.
C. The sum of an asset’s systematic returns and its nonsystematic returns is equal to the
asset’s beta.
20. Andrew, a portfolio manager, aims to maximize risk-adjusted returns. He is least likely to
invest in securities with a nonsystematic variance of:
A. 0.2.
B. 0.0.
Portfolio Risk and Return: Part II – Question Bank
www.ift.world
C. 0.5.
21. Kate Beckett invested her wealth in a diversified portfolio. Which of the following is she
most likely to avoid?
A. Non-systematic risk.
B. Systematic risk.
C. Total risk.
LO.d: Explain return generating models (including the market model) and their uses.
22. Which of the following best describes a return generating model that provides an estimate of
the expected return of a security based on factors such as earnings growth and cash flow
generation?
A. Macroeconomic factor model.
B. Fundamental factor model.
C. Market factor model.
23. Which of the following is least likely to be the reason for using return-generating models?
A. To simplify the construction of an optimal portfolio.
B. To decompose the total variance into systematic and nonsystematic risk.
C. To estimate an asset’s variance.
LO.e: Calculate and interpret beta.
24. Barry wishes to compute the beta of a stock that has a correlation of 0.64 with the market.
The following data is available:
Standard Deviation of Returns of Stock = 14.1%.
Standard Deviation of Returns of Market = 9.44%.
The beta is closest to:
A. 0.43.
B. 0.74.
C. 0.96.
The following information relates to Questions 25-27
Three investors, Bill, Jill, and Mill, invest in individual securities. The table below shows the
expected annual returns, expected standard deviation, and the correlation between their security
and the market.
Investor Expected annual
return (%)
Bill
15
Jill
12
Mill
12
Expected
standard deviation (%)
21
21
28
The following information is available for the market:
Expected Annual Return:
11%
Expected Standard Deviation:
16%
Correlation between security
and the market.
0.85
0.75
0.65
Portfolio Risk and Return: Part II – Question Bank
www.ift.world
25. Which investor is most likely to be exposed to the highest total risk?
A. Bill.
B. Jill.
C. Mill.
26. Which investor has invested in a security with the highest beta?
A. Bill.
B. Jill.
C. Mill.
27. Which investor is exposed to the least amount of market risk?
A. Bill.
B. Jill.
C. Mill.
28. In a class discussion, Mary stated that the average beta for all assets in the market is less than
1. Amanda argued that it was equal to 1; whereas James insisted it exceeded 1. Which of the
following students is most likely to be correct?
A. Amanda.
B. James.
C. Mary.
29. A security characteristic line’s slope is most likely to be the asset’s:
A. Excess return.
B. Risk premium.
C. Beta.
30. A stock has a correlation of 1 with the market and a standard deviation of returns of 20%. If
the market has a standard deviation of returns of 15%, then the beta of the stock is closest to:
A. 1.33.
B. 0.75.
C. 0.20.
31. Which of the following assets is most likely to have an expected return less than the risk-free
rate?
A. An asset with beta -0.25.
B. An asset with beta 0.00.
C. An asset with beta 0.25.
32. Information for stock Z and the market is given below:
Standard deviation for stock Z's returns
Standard deviation of the market's returns
Correlation of stock Z with the market
The beta of stock Z is closet to:
25%
10%
65%
Portfolio Risk and Return: Part II – Question Bank
www.ift.world
A. 0.26.
B. 0.016.
C. 1.625.
LO.f: Explain the capital asset pricing model (CAPM), including its assumptions, and the
security market line (SML).
33. Which of the following is least likely an assumption of the Capital Asset Pricing Model
(CAPM)?
A. There are no costs or restrictions to short-selling.
B. Investors plan for multiple holding periods.
C. Investors can hold a fraction of any asset.
34. Which
SML:
A.
B.
C.
of the following statements about the Security Market Line is least accurate? The
does not allow us to identify mispriced securities.
prices securities based only on non-diversifiable risk.
slope equals the market risk premium.
35. The security market line’s intercept on the y-axis is most likely to be:
A. the risk free rate.
B. beta.
C. the market risk premium.
36. The security market line’s slope is most likely to be:
A. alpha.
B. beta.
C. the market risk premium.
37. Correctly priced individual securities are most likely to plot on which of the following lines?
A. Capital allocation line.
B. Capital market line.
C. Security market line.
38. Under CAPM, the market portfolio should ideally consist of all:
A. investable assets.
B. risky assets.
C. tradable assets.
39. Which of the following is most likely to be the primary determinant of expected return of an
individual asset in the capital asset pricing model?
A. Asset’s beta.
B. Asset’s standard deviation.
C. Market risk premium.
Portfolio Risk and Return: Part II – Question Bank
www.ift.world
40. Which of the following statements is most likely to be correct for the capital asset pricing
model?
A. The market risk premium exceeds the excess market return.
B. The market risk premium is equal to the excess market return.
C. The market risk premium is less than the excess market return.
41. Richard wants to include a graphical representation of the capital asset pricing model in his
presentation. Which of the following lines will he most likely consider?
A. Capital allocation line.
B. Capital market line.
C. Security market line.
LO.g: Calculate and interpret the expected return of an asset using the CAPM;
42. A portfolio manager is analyzing three securities A, B, and C for an investment opportunity.
He has the following data:
Stock
A
B
C
Investor’s Estimated Return
11.96%
10.88%
16.39%
Beta
1.6
1.2
0.96
If the risk free rate is 2.20% and market return is 9.65%, which of the three securities is most
likely undervalued?
A. Stock A.
B. Stock B.
C. Stock C.
43. The following table shows data for the stock of ABC and a market-index.
Expected return of ABC
10%
Expected return of the market-index
9%
Risk free rate
4%
Standard deviation of ABC returns
15%
Standard deviation of market-index returns
12%
Correlation of ABC and market-index returns
0.5
Based on the capital asset pricing model (CAPM), ABC is most likely:
A. undervalued.
B. overvalued.
C. fairly valued.
The following information relates to Questions 44-47
The table below shows information for securities held by three investors, Daniel, David, and
Diana.
Investor
Daniel
David
Diana
Expected Standard Deviation
30
25
20
Beta
1.60
1.80
1.40
Portfolio Risk and Return: Part II – Question Bank
www.ift.world
44. Given that the expected market risk return is 7% and the risk-free rate is 2.5%, what is the
expected return for Daniel’s security?
A. 4.48%.
B. 9.70%.
C. 14.2%.
45. Given that the expected return for David’s security is 14% and the risk-free rate is 2.5%,
what is the expected return for the market?
A. 6.39%.
B. 8.89%.
C. 15.30%.
46. Given that the expected market risk premium is 7.5%, which of the following investors has
the lowest expected return?
A. Daniel.
B. David.
C. Diana.
47. Given that the expected market return declines, which of the following investor’s security
will have the greatest impact on the expected return?
A. Daniel.
B. David.
C. Diana.
48. Miranda, an analyst, makes use of the capital asset pricing model to come up with the
expected return of Stock X. She then estimates the return for Stock X using cash flow
projections. The estimated return is higher than the return predicted by CAPM. She should
conclude that Stock X is:
A. undervalued.
B. properly valued.
C. overvalued.
49. If the expected return on the market portfolio is 8% and the risk free rate is 4%, the expected
return of a security with a beta of 1.25 is closest to:
A. 8%.
B. 9%.
C. 10%.
LO.h: Describe and demonstrate applications of the CAPM and the SML.
50. Information about three stocks is provided below:
Expected
Stock
Beta
Return
ABC Corp.
6%
0.7
KLM Corp.
10%
1.0
XYZ Corp.
16%
1.5
Portfolio Risk and Return: Part II – Question Bank
www.ift.world
If the expected market return is 10% and the average risk-free rate is 2%, according to the
capital asset pricing model (CAPM) and the security market line (SML), which of the three
stocks is most likely undervalued?
A. Stock ABC.
B. Stock KLM.
C. Stock XYZ.
51. Last year, a portfolio manager earned a return of 10%. The portfolio’s beta was 0.5. For the
same period, the market return was 7% and the average risk-free rate was 4%. Jensen’s alpha
for this portfolio is closest to:
A. 1.5%.
B. 4.5%.
C. -1.5%.
52. An investment manager has the following information regarding his portfolio’s return and
volatility as compared to the market:
Return Risk
Market
9.50% 17.50%
Portfolio
15.50% 23.20%
Given that the risk free rate is 3.50%, M2 would be closest to:
A. 3.05%.
B. 9.91%.
C. – 1.47%.
53. Which of the following statements is least likely to be correct about Jensen’s alpha?
A. It is the excess risk-adjusted return on a portfolio.
B. It is based on systematic risk.
C. It is the slope of the security market line.
54. George, a portfolio manager, aims to maximize risk-adjusted returns. He is most likely to
invest in securities with a Jensen’s alpha of:
A. -0.5.
B. 0.
C. 0.5.
55. Which of the following adjusts for total risk?
A. Jensen’s alpha and M-squared.
B. Jensen’s alpha and Sharpe ratio.
C. M-squared and Sharpe ratio.
56. Carlos wants to evaluate the performance of his portfolio manager. He wants to use a
measure based on systematic risk and one which does not require a comparison to determine
whether the performance is good or not. Which of the following measures is he most likely to
use?
A. Jensen’s alpha.
B. Treynor ratio.
Portfolio Risk and Return: Part II – Question Bank
www.ift.world
C. M2 measure.
57. Brad, an investor, has a portfolio which is not fully diversified. Which performance measure
is most appropriate for Brad?
A. Jensen’s alpha.
B. M-squared.
C. Treynor ratio.
Portfolio Risk and Return: Part II – Question Bank
www.ift.world
Solutions
1. B is correct. Since Investor A only invests in risky assets, the highest return for a given level
of risk is indicated by the efficient frontier. Investor B invests in the risk free asset as well.
For him, the highest return for a given level of risk is indicated by the capital allocation line
(CAL).
2. A is correct. The capital allocation line, CAL, is a combination of the risk-free asset and one
or more risky assets.
3. C is correct. The optimal portfolio for an investor like Sam is the one where the CAL is the
tangent to the investor’s highest possible indifference curve.
4. B is correct. Highly risk-averse investors invest majority of their wealth in risk-free assets.
5. B is correct. A capital allocation line shows possible combinations of a risky portfolio and
the risk-free asset.
6. B is correct. An investment in only one asset type has a worse risk-return tradeoff than an
investment in a portfolio of a risk-free asset and a risky asset because the correlation between
the risk-free asset and the risky asset is equal to 0.
7. B is correct. The slope of the lending part of the CML (left of the market portfolio) is given
by the Sharpe ratio. Since the borrowing rate is relatively high, the additional return for each
additional unit of risk for the borrowing portfolio will be lower the additional return for each
additional unit of risk for the lending portfolio. This is shown in the figure below:
8. A is correct. The capital market line, CML, is a special case of the capital allocation line,
CAL, which includes possible combinations of a risk-free asset and the market portfolio.
Portfolio Risk and Return: Part II – Question Bank
www.ift.world
9. C is correct. Any point above the CML is not achievable, whereas any point below the CML
is inferior to any point on the CML.
10. B is correct. The combination of the risk-free asset and the market portfolio on the capital
market line where returns are less than the returns on the market portfolio are called lending
portfolios. Thus XYZ is a lending portfolio.
11. A is correct. The CML assumes that all investors have the same expectations for securities
that result in an optimal risky portfolio i.e. the market portfolio.
12. C is correct. Investors with homogenous expectations are rational and use the same
probability distributions, same inputs for cash flows, and thus arrive at same valuations. Thus
they will generate same optimal risky portfolio, i.e. the market portfolio.
13. C is correct. The optimal risky portfolio is the market portfolio. The capital market theory
assumes that investors have homogeneous expectations and are rational. As a result, same
inputs are used for valuation purposes and hence the expected return and expected variance
do not differ.
14. C is correct. A borrowing portfolio is towards the right of the point M on the capital market
line, as increasing amounts of borrowed money is being invested. The further towards the
right, the greater the returns.
15. C is correct. Risk that is due to company-specific or industry-specific factors is referred to as
unsystematic risk.
16. C is correct. Firm-specific risk is known as unsystematic risk and can be diversified unlike
the systematic or market risk.
17. A is correct. Nonsystematic risks are firm specific risks; natural disasters and political
uncertainty are factors that affect the entire market and are thus systematic risks.
18. B is correct. Investors do not receive any return for accepting nonsystematic or diversifiable
risk; thus only systematic risk is priced.
19. A is correct. The sum of an asset’s systematic variance and its nonsystematic variance of
returns is equal to the asset’s total variance.
20. C is correct. Since Andrew aims to maximize risk-adjusted returns, securities with greater
nonsystematic returns should have the least weight in the portfolio.
21. A is correct. Non-systematic risk can be avoided by investing in a portfolio of assets that are
not highly correlated with one another. This reduces the overall total risk and exposes the
portfolio to only systematic risk.
Portfolio Risk and Return: Part II – Question Bank
www.ift.world
22. B is correct. A return-generating model based on such factors as earnings growth and cash
flow generation is a fundamental factor model.
23. C is correct. Return-generating models are used to estimate an asset’s expected returns, and
not its variance.
24. C is correct.
25. C is correct.
The highest total risk is calculated based on the highest total variance.
Bill:
0.212 = 0.0441
Jill:
0.212 = 0.0441
Mill:
0.282 = 0.0784
Thus Mill is exposed to the highest total risk.
26. C is correct.
Bill:
Jill:
[(
)(
)]
[(
)(
)]
[(
)(
)]
= 1.116
= 0.984
Mill:
= 1.138
Thus Mill has the security with the highest beta.
27. B is correct.
The security with the lowest beta value is exposed to the least amount of market risk.
Bill:
Jill:
[(
)(
)]
[(
)(
)]
[(
)(
)]
= 1.116
= 0.984
Mill:
= 1.138
Thus Jill has the security with the lowest beta.
28. A is correct.
By definition, the average beta of all assets in the market is equal to 1.
29. C is correct. The excess return of the security on the excess return of the market is plotted on
a security characteristic line. The slope of this line is the beta, and the intercept is the
Jensen’s alpha.
Portfolio Risk and Return: Part II – Question Bank
www.ift.world
30. A is correct. Beta =
31. A is correct. An asset with a negative beta will have an expected return less than the risk free
rate in CAPM.
32. C is correct. Beta =
33. B is correct. CAPM is based on a single period instead of multiple periods because it is easy
to calculate.
34. A is correct. The security market line allows us to identify mispriced securities. The other
two statements are true.
35. A is correct. The SML’s intercept on the y-axis is the risk free rate.
36. C is correct. The SML’s slope is the market risk premium.
37. C is correct. Correctly priced securities will plot on the SML. Overpriced securities will plot
below the SML.
38. B is correct. Theoretically, the market portfolio includes all risky assets. However, not all
assets are tradable, and not all tradable assets are investable.
39. A is correct. The CAPM shows that the primary determinant of expected return for an
individual’s asset is its beta, or how well the asset correlates with the market.
40. B is correct. In the capital asset pricing model, the market risk premium is the difference
between the return on the market and the risk free rate, which is equivalent to the return in
excess of the market return.
41. C is correct. The security market line is a graphical representation of the capital asset pricing
model, with beta risk on the x-axis and expected return on the y-axis.
42. C is correct. For a stock to be undervalued, its estimated return should be greater than the
required return (from CAPM). This condition is true only for stock C. The required return is
calculated using CAPM. Required return for C =
(
–
) =
9.35%. Since the estimated return of 16.39% higher than the required return of 9.35%, the
stock is undervalued.
43. A is correct.
=
(
)
= 0.625
(
–
)=
(
–
) = 0.07
Portfolio Risk and Return: Part II – Question Bank
www.ift.world
The required rate of return of JKU is 7% and the expected return of JKU is 10% therefore
JKU is undervalued relative to the Security Market Line (SML). The risk-return relationship
lies above the SML.
44. B is correct.
The expected return can be calculated using the following equation:
( )
( )
( (
)
(
)
)
45. B is correct.
The expected return for the market can be calculated using the following equation:
( )
( (
)
)
( (
(
)
)
)
46. C is correct. Diana will have the lowest expected return because her investment has the
lowest beta value. The value of the risk-free rate will not matter here.
47. B is correct. The security with the highest beta will be most sensitive to change in the
expected market return.
48. A is correct. A security is undervalued if the estimated return is higher than the return
calculated using CAPM.
[ (
49. B is correct.
)
] = 4 + 1.25(8 – 4) = 9%
50. C is correct.
Calculate the required return for the three stocks and compare them with the expected return
to see which one is undervalued.
XYZ Corp. is undervalued, because it lies above the SML. The expected return, 16%, is more
than the required return, 14%.
51. B is correct. Jensen’s alpha = 0.10 – [0.04 + 0.5(0.07 – 0.04)] = 0.045 or 4.5%.
52. A is correct. M2 = (
=(
–
= 3.05%
) (
–
)
(
)– (
)– (
–
–
)
)
53. C is correct. Jensen’s alpha represents the excess risk-adjusted return of a portfolio and is
based on systematic risk.
54. C is correct. Since George aims to maximize risk-adjusted returns, securities with a higher
Jensen’s alpha should have a greater weight in the portfolio.
Portfolio Risk and Return: Part II – Question Bank
www.ift.world
55. C is correct. M-squared and Sharpe ratio adjust for total risk, whereas Jensen’s alpha adjusts
for systematic risk.
56. A is correct. Jensen’s alpha is based on systematic risk and gives the risk adjusted return.
57. B is correct. M-squared is a performance measure that uses total risk or standard deviation
for adjusting risk.