CFA 2018 CFA 2018 SS 03 quiz 1
Bạn đang xem bản rút gọn của tài liệu. Xem và tải ngay bản đầy đủ của tài liệu tại đây (667.79 KB, 54 trang )
SS 03 Quantitative Methods: Application
Question #1 of 193
Question ID: 413226
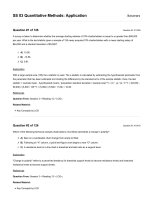
Assume an investor purchases a stock for $50. One year later, the stock is worth $60. After one more year, the stock price has
fallen to the original price of $50. Calculate the continuously compounded return for year 1 and year 2.
Year 1
Year 2
A) 18.23%
-18.23%
B) -18.23%
-18.23%
C) 18.23%
16.67%
Question #2 of 193
Question ID: 434210
Student's t-Distribution
Level of Significance for One-Tailed Test
df 0.100 0.050 0.025 0.01 0.005 0.0005
Level of Significance for Two-Tailed Test
df
0.20
0.10
0.05
0.02
0.01
0.001
40 1.303 1.684 2.021 2.423 2.704 3.551
60 1.296 1.671 2.000 2.390 2.660 3.460
120 1.289 1.658 1.980 2.358 2.617 3.373
The approximate 99% confidence interval for the population mean based on a sample of 60 returns with a mean of 7% and a
sample standard deviation of 25% is closest to:
A) 0.546% to 13.454%.
B) -1.584% to 15.584%.
C) 1.584% to 14.584%.
Question #3 of 193
Question ID: 434204
Assume 30% of the CFA candidates have a degree in economics. A random sample of three CFA candidates is selected. What is
the probability that none of them has a degree in economics?
A) 0.027.
B) 0.343.
C) 0.900.
Question #4 of 193
Question ID: 413257
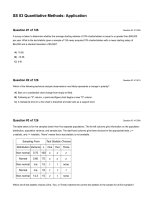
If the true mean of a population is 16.62, according to the central limit theorem, the mean of the distribution of sample means, for
all possible sample sizes n will be:
A) 16.62 / √n.
B) indeterminate for sample with n < 30.
C) 16.62.
Question #5 of 193
Question ID: 413312
An article in a trade journal suggests that a strategy of buying the seven stocks in the S&P 500 with the highest earnings-to-price
ratio at the end of the calendar year and holding them until March 20 of the following year produces significant trading profits.
Upon reading further, you discover that the study is based on data from 1993 to 1997, and the earnings-to-price ratio is
calculated using the stock price on December 31 of each year and the annual reported earnings per share for that year. Which of
the following biases is least likely to influence the reported results?
A) Time-period bias.
B) Survivorship bias.
C) Look-ahead bias.
Question #6 of 193
The mean and standard deviation of returns on three portfolios are listed below in percentage terms:
Portfolio X: Mean 5%, standard deviation 3%.
Portfolio Y: Mean 14%, standard deviation 20%.
Portfolio Z: Mean 19%, standard deviation 28%.
Using Roy's safety first criteria and a threshold of 3%, which of these is the optimal portfolio?
A) Portfolio Z.
B) Portfolio Y.
C) Portfolio X.
Question ID: 413212
Question #7 of 193
Question ID: 413234
Joan Biggs, CFA, acquires a large database of past returns on a variety of assets. Biggs then draws random samples of sets of
returns from the database and analyzes the resulting distributions. Biggs is engaging in:
A) discrete analysis.
B) historical simulation.
C) Monte Carlo simulation.
Question #8 of 193
Question ID: 413278
Which of the following statements about confidence intervals is least accurate? A confidence interval:
A) expands as the probability that a point estimate falls within the interval decreases.
B) has a significance level that is equal to one minus the degree of confidence.
C) is constructed by adding and subtracting a given amount from a point estimate.
Question #9 of 193
Question ID: 710142
Consider a random variable X that follows a continuous uniform distribution: 7 ≤ X ≤ 20. Which of the following statements is least
accurate?
A) F(10) = 0.23.
B) F(12 ≤ X ≤ 16) = 0.307.
C) F(21) = 0.00.
Question #10 of 193
Question ID: 413259
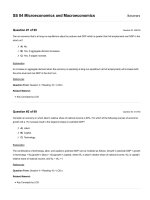
Frank Grinder is trying to introduce sampling into the quality control program of an old-line manufacturer. Grinder samples 38
items and finds that the standard deviation in size is 0.019 centimeters. What is the standard error of the sample mean?
A) 0.00204.
B) 0.00308.
C) 0.00615.
Question #11 of 193
Question ID: 413293
The average U.S. dollar/Euro exchange rate from a sample of 36 monthly observations is $1.00/Euro. The population variance is
0.49. What is the 95% confidence interval for the mean U.S. dollar/Euro exchange rate?
A) $0.8075 to $1.1925.
B) $0.7713 to $1.2287.
C) $0.5100 to $1.4900.
Question #12 of 193
Question ID: 413186
Which of the following would least likely be categorized as a multivariate distribution?
A) The returns of the stocks in the DJIA.
B) The return of a stock and the return of the DJIA.
C) The days a stock traded and the days it did not trade.
Question #13 of 193
Question ID: 413137
A probability distribution is least likely to:
A) contain all the possible outcomes.
B) have only non-negative probabilities.
C) give the probability that the distribution is realistic.
Question #14 of 193
Question ID: 413158
Which of the following could be the set of all possible outcomes for a random variable that follows a binomial distribution?
A) (-1, 0, 1).
B) (0, 1, 2, 3, 4, 5, 6, 7, 8, 9, 10, 11).
C) (1, 2).
Question #15 of 193
Which of the following could least likely be a probability function?
Question ID: 413147
A) X:(1,2,3,4) p(x) = 0.2.
B) X:(1,2,3,4) p(x) = x / 10.
C) X:(1,2,3,4) p(x) = (x × x) / 30.
Question #16 of 193
Question ID: 413287
The table below is for five samples drawn from five separate populations. The far left columns give information on the population
distribution, population variance, and sample size. The right-hand columns give three choices for the appropriate tests: Z =
z-statistic, and t = t-statistic. "None" means that a test statistic is not available.
Sampling From
Test Statistic Choices
Distribution Variance
n
One
Two
Three
Normal
5.60
75
Z
Z
Z
Non-normal
n/a
45
Z
t
t
Normal
n/a
1000
Z
t
t
Non-normal
14.3
15
t
none
t
Normal
0.056
10
Z
Z
t
Which set of test statistic choices (One, Two, or Three) matches the correct test statistic to the sample for all five samples?
A) Two.
B) One.
C) Three.
Question #17 of 193
Question ID: 413190
The mean return of a portfolio is 20% and its standard deviation is 4%. The returns are normally distributed. Which of the
following statements about this distribution are least accurate? The probability of receiving a return:
A) of less than 12% is 0.025.
B) in excess of 16% is 0.16.
C) between 12% and 28% is 0.95.
Question #18 of 193
Question ID: 413224
Given a holding period return of R, the continuously compounded rate of return is:
A) eR − 1.
B) ln(1 + R).
C) ln(1 − R) − 1.
Question #19 of 193
Question ID: 413316
A research paper that reports finding a profitable trading strategy without providing any discussion of an economic theory that
makes predictions consistent with the empirical results is most likely evidence of:
A) a sample that is not large enough.
B) a non-normal population distribution.
C) data mining.
Question #20 of 193
Question ID: 434206
The safety-first criterion focuses on:
A) SEC regulations.
B) shortfall risk.
C) margin requirements.
Question #21 of 193
Question ID: 413164
A stock priced at $20 has an 80% probability of moving up and a 20% probability of moving down. If it moves up, it increases by
a factor of 1.05. If it moves down, it decreases by a factor of 1/1.05. What is the expected stock price after two successive
periods?
A) $22.05.
B) $21.24.
C) $20.05.
Question #22 of 193
Question ID: 413166
A total return index begins the year at 1350.23 and ends the year at 1412.95. A portfolio that tracks this index earns a total return
of 3.65% for the year. The tracking error of this portfolio is closest to:
A) -1.0%.
B) 4.7%.
C) 0.9%.
Question #23 of 193
Question ID: 413142
A random variable that has a countable number of possible values is called a:
A) continuous random variable.
B) probability distribution.
C) discrete random variable.
Question #24 of 193
Question ID: 652911
Cumulative Z-Table
z
0.05
0.06
0.07
0.08
0.09
2.4 0.9929 0.9931 0.9932 0.9934 0.9936
2.5 0.9946 0.9948 0.9949 0.9951 0.9952
2.6 0.9960 0.9961 0.9962 0.9963 0.9964
2.7 0.9970 0.9971 0.9972 0.9973 0.9974
The average return on the Russell 2000 index for 121 monthly observations was 1.5%. The population standard deviation is
assumed to be 8.0%. What is a 99% confidence interval for the mean monthly return on the Russell 2000 index?
A) -0.4% to 3.4%.
B) 0.1% to 2.9%.
C) -6.5% to 9.5%.
Question #25 of 193
Question ID: 413146
If a smooth curve is to represent a probability density function, what two requirements must be satisfied? The area under the
curve must be:
A) one and the curve must not fall below the horizontal axis.
B) one and the curve must not rise above the horizontal axis.
C) zero and the curve must not fall below the horizontal axis.
Question #26 of 193
Question ID: 413238
An analyst wants to generate a simple random sample of 500 stocks from all 10,000 stocks traded on the New York Stock
Exchange, the American Stock Exchange, and NASDAQ. Which of the following methods is least likely to generate a random
sample?
A) Using the 500 stocks in the S&P 500.
B) Listing all the stocks traded on all three exchanges in alphabetical order and selecting every 20th
stock.
C) Assigning each stock a unique number and generating a number using a random number generator.
Then selecting the stock with that number for the sample and repeating until there are 500 stocks in
the sample.
Question #27 of 193
Question ID: 413317
The practice of repeatedly using the same database to search for patterns until one is found is called:
A) data mining.
B) data snooping.
C) sample selection bias.
Question #28 of 193
Question ID: 413145
In a continuous probability density function, the probability that any single value of a random variable occurs is equal to what?
A) Zero.
B) 1/N.
C) One.
Question #29 of 193
Question ID: 434219
Student's t-Distribution
Level of Significance for One-Tailed Test
df 0.100 0.050 0.025 0.01 0.005 0.0005
Level of Significance for Two-Tailed Test
df
0.20
0.10
0.05
0.02
0.01
0.001
40 1.303 1.684 2.021 2.423 2.704 3.551
60 1.296 1.671 2.000 2.390 2.660 3.460
120 1.289 1.658 1.980 2.358 2.617 3.373
The average salary for a sample of 61 CFA charterholders with 10 years experience is $200,000, and the sample standard
deviation is $80,000. Assume the population is normally distributed. Which of the following is a 99% confidence interval for the
population mean salary of CFA charterholders with 10 years of experience?
A) $172,514 to $227,486.
B) $172,754 to $227,246.
C) $160,000 to $240,000.
Question #30 of 193
Question ID: 413251
Which of the following statements regarding the central limit theorem (CLT) is least accurate? The CLT:
A) states that for a population with mean µ and variance σ2, the sampling distribution of the sample
means for any sample of size n will be approximately normally distributed.
B) holds for any population distribution, assuming a large sample size.
C) gives the variance of the distribution of sample means as σ2 / n, where σ2 is the population variance
and n is the sample size.
Question #31 of 193
Question ID: 413185
A multivariate distribution:
A) gives multiple probabilities for the same outcome.
B) applies only to binomial distributions.
C) specifies the probabilities associated with groups of random variables.
Question #32 of 193
Question ID: 413228
Over a period of one year, an investor's portfolio has declined in value from 127,350 to 108,427. What is the continuously compounded rate
of return?
A) -13.84%.
B) -16.09%.
C) -14.86%.
Question #33 of 193
Question ID: 413315
The average mutual fund return calculated from a sample of funds with significant survivorship bias would most likely be:
A) larger than the mean return of the population of all mutual funds.
B) smaller than the mean return of the population of all mutual funds.
C) an unbiased estimate of the mean return of the population of all mutual funds if the sample size was
large enough.
Question #34 of 193
Question ID: 413208
Which of the following portfolios provides the best "safety first" ratio if the minimum acceptable return is 6%?
Portfolio Expected Return (%) Standard Deviation (%)
1
13
5
2
11
3
3
9
2
A) 1.
B) 2.
C) 3.
Question #35 of 193
Question ID: 413242
A sample of five numbers drawn from a population is (5, 2, 4, 5, 4). Which of the following statements concerning this sample is
most accurate?
A) The sampling error of the sample is equal to the standard error of the sample.
B) The mean of the sample is ∑X / (n − 1) = 5.
C) The variance of the sample is: ∑(x1 − mean of the sample)2 / (n − 1) = 1.5.
Question #36 of 193
Question ID: 413167
A portfolio begins the year with a value of $100,000 and ends the year with a value of $95,000. The manager's performance is
measured against an index that declined by 7% on a total return basis during the year. The tracking error of this portfolio is
closest to:
A) −5%.
B) −2%.
C) 2%.
Question #37 of 193
Question ID: 413241
Which of the following statements about sampling errors is least accurate?
A) Sampling errors are errors due to the wrong sample being selected from the population.
B) Sampling error is the error made in estimating the population mean based on a sample mean.
C) Sampling error is the difference between a sample statistic and its corresponding population
parameter.
Question #38 of 193
Question ID: 413248
An analyst is asked to calculate standard deviation using monthly returns over the last five years. These data are best described
as:
A) time series data.
B) cross-sectional data.
C) systematic sampling data.
Question #39 of 193
Question ID: 413196
If a stock's return is normally distributed with a mean of 16% and a standard deviation of 50%, what is the probability of a
negative return in a given year?
A) 0.3745.
B) 0.5000.
C) 0.0001.
Question #40 of 193
The standard normal distribution is most completely described as a:
Question ID: 413204
A) symmetrical distribution with a mean equal to its median.
B) distribution that exhibits zero skewness and no excess kurtosis.
C) normal distribution with a mean of zero and a standard deviation of one.
Question #41 of 193
Question ID: 413207
The mean and standard deviation of returns for three portfolios are listed below in percentage terms.
Portfolio X: Mean 5%, standard deviation 3%.
Portfolio Y: Mean 14%, standard deviation 20%.
Portfolio Z: Mean 19%, standard deviation 28%.
Using Roy's safety-first criteria and a threshold of 4%, select the optimal portfolio.
A) Portfolio X.
B) Portfolio Y.
C) Portfolio Z.
Question #42 of 193
Question ID: 413314
A study reports that from 2002 to 2004 the average return on growth stocks was twice as large as that of value stocks. These
results most likely reflect:
A) survivorship bias.
B) look-ahead bias.
C) time-period bias.
Question #43 of 193
Question ID: 413260
Joseph Lu calculated the average return on equity for a sample of 64 companies. The sample average is 0.14 and the sample
standard deviation is 0.16. The standard error of the mean is closest to:
A) 0.0025.
B) 0.1600.
C) 0.0200.
Question #44 of 193
Question ID: 413300
A local high school basketball team had 18 home games this season and averaged 58 points per game. If we assume that the
number of points made in home games is normally distributed, which of the following is most likely the range of points for a
confidence interval of 90%?
A) 26 to 80.
B) 24 to 78.
C) 34 to 82.
Question #45 of 193
Question ID: 413295
A traffic engineer is trying to measure the effects of carpool-only lanes on the expressway. Based on a sample of 1,000 cars at
rush hour, he finds that the mean number of occupants per car is 2.5, with a standard deviation of 0.4. Assuming that the
population is normally distributed, what is the confidence interval at the 5% significance level for the number of occupants per
car?
A) 2.475 to 2.525.
B) 2.288 to 2.712.
C) 2.455 to 2.555.
Question #46 of 193
Question ID: 413281
When is the t-distribution the appropriate distribution to use? The t-distribution is the appropriate distribution to use when
constructing confidence intervals based on:
A) small samples from populations with known variance that are at least approximately normal.
B) small samples from populations with unknown variance that are at least approximately normal.
C) large samples from populations with known variance that are nonnormal.
Question #47 of 193
Which of the following statements about probability distributions is most accurate?
A) A discrete uniform random variable has varying probabilities for each outcome that total to one.
B) A binomial distribution counts the number of successes that occur in a fixed number of independent trials
that have mutually exclusive (i.e. yes or no) outcomes.
C) A continuous uniform distribution has a lower limit but no upper limit.
Question ID: 413133
Question #48 of 193
Question ID: 413253
According to the Central Limit Theorem, the distribution of the sample means is approximately normal if:
A) the underlying population is normal.
B) the standard deviation of the population is known.
C) the sample size n > 30.
Question #49 of 193
Question ID: 413140
Which of the following is least likely a probability distribution?
A) Zeta Corp.: P(dividend increases) = 0.60, P(dividend decreases) = 0.30.
B) Roll an irregular die: p(1) = p(2) = p(3) = p(4) = 0.2 and p(5) = p(6) = 0.1.
C) Flip a coin: P(H) = P(T) = 0.5.
Question #50 of 193
Question ID: 413322
When sampling from a population, the most appropriate sample size:
A) involves a trade-off between the cost of increasing the sample size and the value of increasing the
precision of the estimates.
B) minimizes the sampling error and the standard deviation of the sample statistic around its population
value.
C) is at least 30.
Question #51 of 193
Question ID: 434214
Student's t-Distribution
Level of Significance for One-Tailed Test
df 0.100 0.050 0.025 0.01 0.005 0.0005
Level of Significance for Two-Tailed Test
df 0.20
0.10
0.05
0.02
0.01
0.001
24 1.318 1.711 2.064 2.492 2.797
3.745
25 1.316 1.708 2.060 2.485 2.787
3.725
26 1.315 1.706 2.056 2.479 2.779
3.707
27 1.314 1.703 2.052 2.473 2.771
3.690
Books Fast, Inc., prides itself on shipping customer orders quickly. Books Fast sampled 27 of its customers within a 200-mile
radius and found a mean delivery time of 76 hours, with a sample standard deviation of 6 hours. Based on this sample and
assuming a normal distribution of delivery times, what is the confidence interval for the mean delivery time at 5% significance?
A) 65.75 to 86.25 hours.
B) 73.63 to 78.37 hours.
C) 68.50 to 83.50 hours.
Question #52 of 193
Question ID: 413229
A stock increased in value last year. Which will be greater, its continuously compounded or its holding period return?
A) Neither, they will be equal.
B) Its holding period return.
C) Its continuously compounded return.
Question #53 of 193
Question ID: 413199
A grant writer for a local school district is trying to justify an application for funding an after-school program for low-income families. Census
information for the school district shows an average household income of $26,200 with a standard deviation of $8,960. Assuming that the
household income is normally distributed, what is the percentage of households in the school district with incomes of less than $12,000?
A) 15.87%.
B) 5.71%.
C) 9.92%.
Question #54 of 193
Question ID: 413311
Sunil Hameed is a reporter with the weekly periodical The Fun Finance Times. Today, he is scheduled to interview a researcher who claims
to have developed a successful technical trading strategy based on trading on the CEO's birthday (sample was taken from the Fortune
500). After the interview, Hameed summarizes his notes (partial transcript as follows). The researcher:
was defensive about the lack of economic theory consistent with his results.
used the same database of data for all his tests and has not tested the trading rule on out-of-sample data.
excluded stocks for which he could not determine the CEO's birthday.
used a sample cut-off date of the month before the latest market correction.
Select the choice that best completes the following: Hameed concludes that the research is flawed because the data and process are
biased by:
A) data mining, time-period bias, and look-ahead bias.
B) data mining, sample selection bias, and time-period bias.
C) sample selection bias and time-period bias.
Question #55 of 193
Question ID: 434209
A stated interest rate of 9% compounded continuously results in an effective annual rate closest to:
A) 9.67%.
B) 9.42%.
C) 9.20%.
Question #56 of 193
Question ID: 413139
Which of the following statements about probability distributions is least accurate?
A) The skewness of a normal distribution is zero.
B) A discrete random variable is a variable that can assume only certain clearly separated values resulting from
a count of some set of items.
C) A binomial probability distribution is an example of a continuous probability distribution.
Question #57 of 193
Question ID: 413263
Melissa Cyprus, CFA, is conducting an analysis of inventory management practices in the retail industry. She assumes the
population cross-sectional standard deviation of inventory turnover ratios is 20. How large a random sample should she gather in
order to ensure a standard error of the sample mean of 4?
A) 25.
B) 20.
C) 80.
Question #58 of 193
Question ID: 434207
Claude Bellow, CFA, is an analyst with a real-estate focused investment firm. Today, one of the partners e-mails Bellow the
following table and requests that he look into the reward-to-variability ratios of two asset classes. The table below gives five years
of annual returns for Marley REIT (real estate investment trust) and a large urban apartment building. Marley REIT invests in
commercial properties. The risk-free rate is 5.0% and the firm's threshold rate for this type is investment is 5.7%. (Note: For this
question, calculate the mean returns using the arithmetic mean.)
Table 1: Annual returns (in %)
Asset
Marley REIT
Apartment
Bldg
Year 1 Year 2 Year 3 Year 4 Year 5
15.0
8.0
13.0
9.0
13.0
10.0
-1.0
8.0
8.0
9.0
One of the office assistants begins to "run some numbers," but is then called away to an important meeting. So far, the assistant
has calculated the standard deviation of the apartment building returns at 3.97% and the standard deviation of the REIT returns
at 2.65%. (He assumed that the returns given represent the entire population of returns.) Now, Bellow must finish the work.
Bellow should conclude that the:
A) REIT has a higher excess return per unit of risk than the apartment building has per unit of risk.
B) partner is asking Bellow to select the investment with the minimal probability that the return falls
below 5.70%.
C) safety-first ratio for the REIT is 2.49.
Question #59 of 193
Question ID: 413195
The average amount of snow that falls during January in Frostbite Falls is normally distributed with a mean of 35 inches and a standard
deviation of 5 inches. The probability that the snowfall amount in January of next year will be between 40 inches and 26.75 inches is
closest to:
A) 87%.
B) 79%.
C) 68%.
Question #60 of 193
Question ID: 413191
For a normal distribution, what approximate percentage of the observations fall within ±3 standard deviation of the mean?
A) 66%.
B) 95%.
C) 99%.
Question #61 of 193
Question ID: 413181
A multivariate normal distribution that includes three random variables can be completely described by the means and variances
of each of the random variables and the:
A) conditional probabilities among the three random variables.
B) correlation coefficient of the three random variables.
C) correlations between each pair of random variables.
Question #62 of 193
Question ID: 413168
Tracking error for a portfolio is best described as the:
A) standard deviation of differences between an index return and portfolio return.
B) portfolio return minus a benchmark return.
C) sample mean minus population mean.
Question #63 of 193
Question ID: 413268
A traffic engineer is trying to measure the effects of carpool-only lanes on the expressway. Based on a sample of 100 cars at rush
hour, he finds that the mean number of occupants per car is 2.5, and the sample standard deviation is 0.4. What is the standard
error of the sample mean?
A) 1.00.
B) 0.04.
C) 5.68.
Question #64 of 193
Question ID: 413267
If the number of offspring for females of a certain mammalian species has a mean of 16.4 and a standard deviation of 3.2, what
will be the standard error of the sample mean for a survey of 25 females of the species?
A) 1.28.
B) 3.20.
C) 0.64.
Question #65 of 193
Question ID: 413156
For a certain class of junk bonds, the probability of default in a given year is 0.2. Whether one bond defaults is independent of
whether another bond defaults. For a portfolio of five of these junk bonds, what is the probability that zero or one bond of the five
defaults in the year ahead?
A) 0.4096.
B) 0.7373.
C) 0.0819.
Question #66 of 193
Question ID: 413231
Monte Carlo simulation is necessary to:
A) compute continuously compounded returns.
B) reduce sampling error.
C) approximate solutions to complex problems.
Question #67 of 193
Question ID: 413135
The number of ships in the harbor is an example of what kind of variable?
A) Continuous.
B) Discrete.
C) Indiscrete.
Question #68 of 193
Question ID: 484167
The sample mean return of Bartlett Co. is 3% and the standard deviation is 6% based on 30 monthly returns. What is the
confidence interval of a two tailed z-test of the population mean with a 5% level of significance?
A) 1.90 to 4.10.
B) 2.61 to 3.39.
C) 0.85 to 5.15.
Question #69 of 193
Question ID: 413216
If random variable Y follows a lognormal distribution then the natural log of Y must be:
A) normally distributed.
B) lognormally distributed.
C) denoted as ex.
Question #70 of 193
Question ID: 413282
Which one of the following statements about the t-distribution is most accurate?
A) The t-distribution approaches the standard normal distribution as the number of degrees of freedom
becomes large.
B) Compared to the normal distribution, the t-distribution has less probability in the tails.
C) The t-distribution is the only appropriate distribution to use when constructing confidence intervals
based on large samples.
Question #71 of 193
Question ID: 413225
If a stock decreases from $90 to $80, the continuously compounded rate of return for the period is:
A) -0.1250.
B) -0.1178.
C) -0.1000.
Question #72 of 193
Question ID: 434208
A stock that pays no dividend is currently priced at 42.00. One year ago the stock was 44.23. The continuously compounded rate
of return is closest to:
A) −5.17%.
B) +5.17%.
C) −5.04%.
Question #73 of 193
Question ID: 413165
A stock priced at $10 has a 60% probability of moving up and a 40% probability of moving down. If it moves up, it increases by a
factor of 1.06. If it moves down, it decreases by a factor of 1/1.06. What is the expected stock price after two successive periods?
A) $11.24.
B) $10.27.
C) $10.03.
Question #74 of 193
Question ID: 413313
An analyst has compiled stock returns for the first 10 days of the year for a sample of firms and estimated the correlation
between these returns and changes in book value for these firms over the just ended year. What objection could be raised to
such a correlation being used as a trading strategy?
A) The study suffers from look-ahead bias.
B) Use of year-end values causes a time-period bias.
C) Use of year-end values causes a sample selection bias.
Question #75 of 193
Question ID: 413134
Which of the following is a discrete random variable?
A) The realized return on a corporate bond.
B) The amount of time between two successive stock trades.
C) The number of advancing stocks in the DJIA in a day.
Question #76 of 193
Question ID: 413187
A portfolio manager is looking at an investment that has an expected annual return of 10% with a standard deviation of annual
returns of 5%. Assuming the returns are approximately normally distributed, the probability that the return will exceed 20% in any
given year is closest to:
A) 0.0%.
B) 2.28%.
C) 4.56%.
Question #77 of 193
Question ID: 413309
Which of the following is the best method to avoid data mining bias when testing a profitable trading strategy?
A) Test the strategy on a different data set than the one used to develop the rules.
B) Increase the sample size to at least 30 observations per year.
C) Use a sample free of survivorship bias.
Question #78 of 193
Question ID: 413221
Compared to a discretely compounded rate of return, continuous compounding will most likely result in a rate of return that is:
A) lower.
B) the same.
C) higher.
Question #79 of 193
Question ID: 413276
Which of the following statements about sampling and estimation is most accurate?
A) The standard error of the sample means when the standard deviation of the population is known
equals σ / √n, where σ = sample standard deviation adjusted by n − 1.
B) The standard error of the sample means when the standard deviation of the population is unknown
equals s / √n, where s = sample standard deviation.
C) The probability that a parameter lies within a range of estimated values is given by α.
Question #80 of 193
Question ID: 413223
The continuously compounded rate of return that will generate a one-year holding period return of -6.5% is closest to:
A) -5.7%.
B) -6.7%.
C) -6.3%.
Question #81 of 193
Question ID: 710143
A stock price decreases in one period and then increases by an equal amount in the next period. The investor calculates a
holding period return for each period and calculates their arithmetic mean. The investor also calculates the continuously
compounded rate of return for each period and calculates the arithmetic mean of these. Which of the arithmetic means will be
greater?
A) The mean of the holding period returns.
B) The mean of the continuously compounded returns.
C) Neither, because both will equal zero.
Question #82 of 193
Question ID: 413182
In a multivariate normal distribution, a correlation tells the:
A) overall relationship between all the variables.
B) strength of the linear relationship between two of the variables.
C) relationship between the means and variances of the variables.
Question #83 of 193
Question ID: 413205
The annual rainfall amount in Yucutat, Alaska, is normally distributed with a mean of 150 inches and a standard deviation of 20
inches. The 90% confidence interval for the annual rainfall in Yucutat is closest to:
A) 137 to 163 inches.
B) 110 to 190 inches.
C) 117 to 183 inches.
Question #84 of 193
A cumulative distribution function for a random variable X is given as follows:
Question ID: 413152
x
F(x)
5
0.14
10
0.25
15
0.86
20
1.00
The probability of an outcome less than or equal to 10 is:
A) 14%.
B) 25%.
C) 39%.
Question #85 of 193
Question ID: 413236
From the entire population of McDonald's franchises, an analyst constructs a sample of the monthly sales volume for 20
randomly selected franchises. She calculates the mean sales volume for those 20 franchises to be $400,000. The sampling
distribution of the mean is the probability distribution of the:
A) mean monthly sales volume estimates from all possible samples of 20 observations.
B) mean monthly sales volume estimates from all possible samples.
C) monthly sales volume for all McDonald's franchises.
Question #86 of 193
Question ID: 413170
A random variable follows a continuous uniform distribution over 27 to 89. What is the probability of an outcome between 34 and
38?
A) 0.0546.
B) 0.0645.
C) 0.0719.
Question #87 of 193
Question ID: 413162
The Night Raiders, an expansion team in the National Indoor Football League, is having a challenging first season with a current win loss
record of 0 and 4. However, the team recently signed four new defensive players and one of the team sponsors (who also happens to hold
a CFA charter) calculates the probability of the team winning a game at 0.40. Assuming that whether the team wins a game is independent
of whether it wins any other game, the probability that the team will win 6 out of the next 10 games is closest to:
A) 0.350.
B) 0.112.
C) 0.417.
Question #88 of 193
Question ID: 413155
Possible outcomes for a discrete uniform distribution are the integers 2 to 9 inclusive. What is the probability of an outcome less
than 5?
A) 62.5%.
B) 50.0%.
C) 37.5%.
Question #89 of 193
Question ID: 413269
From a population of 5,000 observations, a sample of n = 100 is selected. Calculate the standard error of the sample mean if the
population standard deviation is 50.
A) 50.00.
B) 5.00.
C) 4.48.
Question #90 of 193
Question ID: 413153
The number of days a particular stock increases in a given five-day period is uniformly distributed between zero and five
inclusive. In a given five-day trading week, what is the probability that the stock will increase exactly three days?
A) 0.167.
B) 0.600.
C) 0.333.
Question #91 of 193
Standard Normal Distribution
P(Z ≤ z) = N(z) for z ≥ 0
Question ID: 529150