Treatment of semi-aerobic landfill leachate using durian peel-based activated carbon adsorption- Optimization of preparation conditions
Bạn đang xem bản rút gọn của tài liệu. Xem và tải ngay bản đầy đủ của tài liệu tại đây (471.5 KB, 14 trang )
INTERNATIONAL JOURNAL OF
ENERGY AND ENVIRONMENT
Volume 3, Issue 2, 2012 pp.223-236
Journal homepage: www.IJEE.IEEFoundation.org
Treatment of semi-aerobic landfill leachate using durian
peel-based activated carbon adsorption- Optimization of
preparation conditions
Mohamad Anuar Kamaruddin1, Mohd Suffian Yusoff1, Mohd Azmier Ahmad2
1
School of Civil Engineering, Engineering Campus, Universiti Sains Malaysia, 14300 Nibong Tebal,
Penang, Malaysia.
2
School of Chemical Engineering, Engineering Campus, Universiti Sains Malaysia, 14300 Nibong
Tebal, Penang, Malaysia.
Abstract
The treatability of semi-aerobic landfill leachate parameters using durian peel-based activated carbon
(DPAC) was investigated. An ideal experimental design was conducted based on central composite
design (CCD) using response surface methodology to evaluate individual and interactive effects of
operational variables namely activation temperature, activation time and carbon dioxide (CO2) flow rate
on treatment performance in terms of chemical oxygen demand (COD) and colour removal efficiencies.
The DPAC was prepared using physical activation method which consists of CO2 gasification. The
adsorptions of COD and colour were described by Langmuir and Freundlich isotherm models. Based on
the CCD, quadratic model was developed to correlate preparation variables to the two responses. The
optimum DPAC preparation conditions were obtained using 800 °C activation temperature, 2.1 h
activation time and 68.68 ml/s of CO2 flow rate. From the experimental work, the maximum removal of
COD and colour obtained were 41.98 and 39.86%, respectively.
Copyright © 2012 International Energy and Environment Foundation - All rights reserved.
Keywords: Activated carbon; CCD; COD; Colour; Leachate.
1. Introduction
Landfilling has emerged as the prominent option for disposing unwanted or non-economic materials. In
Malaysia, approximately 95% of the collected municipal solid wastes (17,000 tons daily) are disposed in
more than 230 landfills [1]. Due to excessive growth in population, lifestyle and rapid economy
expansions, solid waste generation have become difficult to manage and dispose. Besides, vigorous
combination of domestic, industrial and schedule wastes recognized as the potential hazard source
throughout solid waste disposal on landfills. One distinctive problem associated with landfilling is the
generation of dark liquid that flows through solid waste refuse that eventually reacts with rain water in
the solid wastes matrix that is called leachate. Leachate is defined as a liquid formed by the percolation
of precipitation through an open landfill or through the cap of a finished site [2]. In general, leachate
contains significantly huge amounts of pollutants such as chemical oxygen demand (COD), biochemical
oxygen demand (BOD), ammonia, and high concentrations of heavy metals [1-3]. Leachate is known to
be one of the major problems on landfill operations because of its adverse effects to the surrounding
environment. If not properly treated and manage, leachate flows into water bodies or surface drain could
ISSN 2076-2895 (Print), ISSN 2076-2909 (Online) ©2012 International Energy & Environment Foundation. All rights reserved.
224
International Journal of Energy and Environment (IJEE), Volume 3, Issue 2, 2012, pp.223-236
trigger imbalance and devastate the ecological system of aquatic life and human being. In general, high
strength leachate is defined by its parameter concentrations. Some of the common parameters that can be
found in leachate are heavy metals and degradable organics at the beginning of landfill operation, while
persistent organic pollutants usually appear later as a result of biotic and abiotic processes in the system
[4]. According to Bashir et al. [5], young leachates are characterized by high BOD5 (4000–40,000mg/L),
high COD (6000–60,000mg/L), NH3–N (<400), BOD5:COD ratio typically ≤1.0, and pH range from 4.5
to 7.5. Besides, the high concentrations of colour are mainly contributed by dissolved organic contents in
leachate that has stabilized. Humic substances are natural organic compounds made up of complex
structure of polymerised organic acids, carboxylic acids and carbohydrates [5]. These organic
compounds may be present in the form of recalcitrant material of humic acids.
In operations, leachate treatment is a difficult and expensive process. Nevertheless, various treatment
options have been reported. Some of the methods are physical, chemical, and biological. Air stripping
[6], adsorption [7], and membrane filtration [8] are major physical leachate treatment methods.
Coagulation flocculation [6], chemical precipitation, and chemical and electrochemical oxidation [9]
methods are the common chemical methods employed. However, all the methods offered have certain
limitation which is, it depends mostly on the leachate characteristics. According to Halim et al. [7], the
common features of stabilized leachate are high strengths of ammoniacal nitrogen (3000–5000 mg/L)
and moderately high strengths of COD (5000–20,000 mg/L), as well as a low ratio of BOD/COD (less
than 0.1). A study done by Aghamohammadi et al. [10] found that 49% of COD could be removed under
2.22 day retention time and 43% by using powdered activated carbon augmented activated sludge in
landfill leachate. Halim et al. [7] studied a comparison study of ammonia and COD adsorption on zeolite,
activated carbon and composite materials in landfill leachate treatment. They found that up to 80% of
COD could be removed by activated carbon compared to zeolite and composite material. Recently,
Cotman and Gotvajn [4] in their work reported that the most effective removal of organic substances
were achieved at the addition of 50.0 g L−1 of activated carbon; remove up to 86% of COD and 63% of
NH4+-N. Kurniawan and Lo [11] reported that granular activated carbon adsorption alone could remove
about 60% of COD from leachate.
Studies of leachate by activated carbon adsorption have been reported by various authors [10, 12-15].
Activated carbon is considered as one of the most effective adsorbents, especially for substances
containing refractory organic compounds that resist biodegradation and persist in the environment. It has
been chose as a renowned choice in leachate treatment due to its adsorption properties, a large porous
volume, and a vast surface area ranging from 1000 to 1300/m2 [11]. Its superior performance in terms of
removal efficiency and high adsorption capacity is capable to reduce pollutants level in landfill leachate
treatment. According to Abbas et al. [16], the main aims of activated carbon adsorption in leachate
treatment are to ensure final polishing level by removing toxic heavy metals or organics and support
microorganisms during leachate inhabitant. Commercially activated carbon does not have enough
adsorption capacity because it usually possesses a non-polar surface due to manufacturing conditions at
high temperatures, which is a disadvantage for some applications because of poor interaction with some
polar adsorbates. The major drawback of the usage of commercial activated carbon is due to the
expensive starting material. Nevertheless, numerous works have reported on the modification of the
activated carbon surfaces or to produce composite adsorbent that have the ability to interact with either
polar or non-polar adsorbates [7]. Therefore, there is a need to produce activated carbon from alternative
material that is cheaper, renewable and readily available. In recent years, focus has been given on the
preparation of low cost activated carbon from agricultural wastes such as bamboo waste [17],
mangosteen peel [18], rambutan peel [19], tamarind wood [20] and coconut husk [21].
In this research, an attempt was made in preparing activated carbon from durian peel (DP) precursor by
physical activation process. Native to South-Eastern Asia, durian (Durio zibethinus) is the fruit of trees
from the genus Durio belonging to the Bombacaceae [22]. Landfill leachate parameters, namely COD
and colour were tested to evaluate the percentage removal efficiency of DPAC by batch adsorption test.
The analysis of the isotherm data namely Langmuir and Freundlich were carried out to predict the
suitable model for the operation conditions. The knowledge contribution in this research is deemed
important to the determination of optimum conditions of DPAC preparation variables in landfill leachate
treatment.
ISSN 2076-2895 (Print), ISSN 2076-2909 (Online) ©2012 International Energy & Environment Foundation. All rights reserved.
International Journal of Energy and Environment (IJEE), Volume 3, Issue 2, 2012, pp.223-236
225
2. Materials and methods
2.1 Semi-aerobic landfill leachate
Leachate samples were collected from Pulau Burung Semi-aerobic Landfill Site (PBLS), which is
located within Byram Forest Reserve in Penang, Malaysia. All samples were collected from the influent
of the detention pond in 20 L plastic containers, transported to the laboratory and stored at 4°C [23].
2.2 Preparation of DPAC
Durian peel (DP) used as precursor was obtained from a local orchard in Nibong Tebal, Penang,
Malaysia. DP was firstly washed and subsequently dried at 105°C for 24 h to remove moisture content.
The dried DP were ground and sieved to the size of 1–2 mm and loaded in a stainless steel vertical
tubular reactor placed in a tube furnace. Carbonization step of the dried DP was carried out at 700°C for
2 h under purified nitrogen (99.99%). The char produced was further gasified under carbon dioxide
(CO2) influence as the activation process. The activation step was done using similar reactor as in
carbonization where the activation temperature, activation time and CO2 flow rate were based on the
results suggested by the Design Expert 6.0.7 software (Stat-Ease Inc., Minneapolis, USA). The activated
product was then cooled in room temperature under nitrogen flow. The sample was washed with hot
deionised water and either hydrochloric acid (HCL) or potassium hydroxide (KOH) solution until the pH
of the washed solution reached 6.5 to 7.
2.3 Batch adsorption test
The concentration of COD was measured by Method 5220 D (closed reflux, colourimetric method) and
colour measurement was reported as true colour assayed at 455 nm and reported as platinum-cobalt (PtCo), the unit of colour being produced by 1 mg platinum/L in the form of chloroplatinate ion [5]. The
two parameters were tested by using DR 2500 Hach spectrophotometer. The batch adsorption test was
carried out by pouring 20 g of DPAC into 200 mL of leachate sample in 250 mL Erlenmeyer flasks. The
initial concentration of COD and colour were 3100 and 3286 mg/L, respectively. The prepared mixture
was agitated at 320 rpm until it reached equilibrium condition using orbital shaker (Bioblock Scientific
Agitator 74578). The equilibrium condition was attained when the final concentration of COD and colour
produced similar values from spectrophotometer. The supernatant was filtered by GC-50 filter prior to
the conduct of tests for COD and colour. The percentage removal at equilibrium was calculated using
spectrophotometer as follows:
REMOVAL(%) =
Ci − C f
× 100
(1)
Ci
where Ci and Cf are the initial and final concentration of COD and colour (mg/L), respectively.
2.4 Experimental design
In this work, RSM design called central composite design (CCD) was utilized to investigate the effects of
the DP activated carbon preparation variables; activation temperature (x1), activation time (x2) and CO2
flow rate (x3) towards their responses; COD (Y1) and colour (Y2) removal. The response surface
methodology (RSM) is a collection of statistical and mathematical techniques that uses quantitative data
from appropriate experiments to determine regression model equations and operating conditions [20].
CCD is an effective design that is ideal for sequential experimentation, as it allows reasonable amount of
information to test lack of fit when a sufficient number of experimental values exist [24]. These three
variables together with their respective ranges were chosen based on preliminary studies as given in
Table 1.
Table 1. Independent variables and their coded levels for the CCD
Variable (factors)
Code
Units
Activation temperature
Activation time
CO2 flow rate
x1
x2
x3
°C
h
ml/s
-α
600
0.32
15.91
Coded variable levels
-1
0
+1
531.82 700.00 800
1.00
2.00
3.00
50
100.00 150
+α
868.18
3.68
184.09
ISSN 2076-2895 (Print), ISSN 2076-2909 (Online) ©2012 International Energy & Environment Foundation. All rights reserved.
226
International Journal of Energy and Environment (IJEE), Volume 3, Issue 2, 2012, pp.223-236
2.5 Equilibrium studies
Adsorption isotherms were used to describe the DPAC performance, and the relationship between
adsorbent (DP activated carbon) and dissolved adsorbate (COD and colour). For this purpose, 200 ml of
leachate sample were mixed with desired dosage of DP activated carbon i.e.; 5, 10, 15, 20, 25, 30 g. An
agitating speed of 320 rpm and equilibrium periods of 180 minutes were used to ensure equilibrium
conditions. The amount of adsorbate adsorbed at equilibrium, qe (mg/g) was calculated to determine the
percent removal of adsorbate as given by [24]:
qe =
(Co − Ce )V
(2)
W
where Co and Ce (mg/L) are the liquid-phase concentrations of adsorbate at initial and at equilibrium,
respectively. V is the volume of the solution (L) and W is the mass of adsorbent used (g).
The CCD consists of 2n factorial runs, 2n axial runs and six centre runs, where n is the number of factors.
For three variables, the full design matrix consists of 8 factorial points, 6 axial points and 6 replicates at
the centre points, indicating that altogether 20 experiments [21] as follows:
N = 2 n + 2n + nc = 2 3 + 2(3) + 6 = 20
(3)
where N is the total number of experiments required.
The low, centre and high levels of each variable are designated according to face centred CCD as −1, 0,
and +1, respectively. The axial points are located at (±α, 0, 0), (α, ±, 0) and (α, 0, ±) where α (1.682) is
the distance of the axial point from centre to allow the design rotatable. The responses were COD (Y1)
and colour removal (Y2). Each response was used to develop an empirical model which correlated the
response to the three activated carbon preparation variables using a second-degree polynomial equation
as follows [25]:
2
n −1
n
⎛ n
⎞
Y = bo + ∑ bi xi + ⎜ ∑ bii xi ⎟ + ∑ ∑ bij xi x j
⎜
⎟
i =1
i =1 j = i +1
⎝ i =1
⎠
n
(4)
where Y is the predicted response, bo the constant coefficient, bi the linear coefficients, bij the interaction
coefficients, bii the quadratic coefficients and xi, xj are the coded values of the activated carbon
preparation variables.
2.6 Characterization of DPAC
The surface area, pore volume and average pore diameter of the DP activated carbon were determined by
using Autosorb AS 1 (Quantachrome, USA) volumetric adsorption analyzer. The BET surface area was
measured from the adsorption isotherms using Brunauer–Emmett–Teller equation method. The total pore
volume was estimated to be the liquid volume of nitrogen at a relative pressure of 0.98. The surface
morphology of the samples was examined using a scanning electron microscope (Leo Supra 55 VP,
Germany). The proximate analysis was carried out using thermogravimetric analyzer (Perkin Elmer
TGA7, USA). The elemental analysis was performed using Elemental Analyzer (Perkin Elmer Series II
2400, USA).
3. Results and discussions
3.1 Development of regression model equation
The complete design matrix together with the values of both responses based on the experimental runs is
shown in Table 2. Run 15–20 at the centre point were conducted to determine the experimental error and
the reproducibility of the data [18]. COD and colour removal were observed in the range from 35.21 to
47.50 % and 10.54 to 59.53 %, respectively. According to the sequential model sum of squares, the
models were selected based on the highest order polynomials where the additional terms were significant
and the models were not aliased [17]. For COD and colour removal, quadratic models were suggested by
ISSN 2076-2895 (Print), ISSN 2076-2909 (Online) ©2012 International Energy & Environment Foundation. All rights reserved.
International Journal of Energy and Environment (IJEE), Volume 3, Issue 2, 2012, pp.223-236
227
the software. The final empirical formula models for COD (Y1) and colour removal (Y2) in terms of coded
factors are represented by Eqs.(5) and (6), respectively.
Y1 =+35.89 +2.59x1 +1.13x2 –0.68 x3 +1.71x12+1.63x22 +1.31x32 –1.38 x1x2–2.23 x1x3+0.69x2x3 (5)
Y2 =+57.58 +7.23x1 +3.47 x2 +7.04x3 –13.54x1 2 –8.71 x22 –5.85x3 2 –0.16 x1 x2 +4.91x1x3+0.025x2x3 (6)
The coefficient with one factor represent the effect of the particular factor, while the coefficients with
two factors and those with second-order terms represent the interaction between two factors and
quadratic effect, respectively [18] The quality of the fit polynomial model was expressed by correlation
coefficient, R2 In this experiment, the R2 values were 0.9159 and 0.8899, for COD and colour removal,
respectively. These indicate that 91.59 and 88.99% of the total variation were accurate as explained by
the model and attributed to the experimental variable studied. In general, the regression models obtained
for COD and colour removal were satisfied since the values of R2 were relatively high and close to unity.
Subsequently, a high R2 coefficient ensures a satisfactory adjustment of the quadratic model to the
experimental data [24]. R2 values obtained were relatively high and show that the predicted values for
COD and colour removal were accurate and closer to its actual value and ensure a satisfactory adjustment
of the quadratic model to the experimental data.
Table 2. Experimental design matrix for preparation of DP activated carbon
Run
1
2
3
4
5
6
7
8
9
10
11
12
13
14
15
16
17
18
19
20
Level
-1
+1
-1
+1
-1
+1
-1
+1
- 1.682
+1.682
0
0
0
0
0
0
0
0
0
0
-1
-1
+1
+1
-1
-1
+1
+1
0
0
- 1.682
+1.682
0
0
0
0
0
0
0
0
-1
-1
-1
-1
+1
+1
+1
+1
0
0
0
0
- 1.682
+1.682
0
0
0
0
0
0
DPAC preparation variables
Activation Activatio CO2 flow
temperatur
rate (ml/s)
n time,
e, x1 (°C)
x2 (h)
x3
600.00
1.00
50.00
800.00
1.00
50.00
600.00
3.00
50.00
800.00
3.00
50.00
600.00
1.00
150.00
800.00
1.00
150.00
600.00
3.00
150.00
800.00
3.00
150.00
531.82
2.00
100.00
868.18
2.00
100.00
700.00
0.32
100.00
700.00
3.68
100.00
700.00
2.00
15.91
700.00
2.00
184.09
700.00
2.00
100.00
700.00
2.00
100.00
700.00
2.00
100.00
700.00
2.00
100.00
700.00
2.00
100.00
700.00
2.00
100.00
COD
removal,
Y1 (%)
Color
removal
Y2 (%)
35.25
44.56
37.43
44.60
35.71
39.50
44.01
38.90
35.52
47.50
39.65
42.89
42.05
38.70
35.55
36.43
36.80
35.57
35.51
35.21
17.47
19.15
16.65
19.51
20.43
43.56
21.53
42.20
10.54
40.54
24.89
53.49
35.05
59.53
56.45
57.54
57.83
57.55
56.54
57.40
3.2 Statistical analysis
Tables 3 and 4 show the results of the surface quadratic mode for COD and colour using analysis of
variance (ANOVA), respectively. ANOVA is requisite to identify the significance and adequacy of the
models developed. The mean squares were obtained by dividing the sum of the squares of each of the
variation sources, the model and the error variance, by the respective degrees of freedom [19]. If the
value of Prob.>F less than 0.05, the model terms are considered as significant while values greater than
0.1000 indicate that the model terms are not significant [21]. From Table 3, the model F-value of 12.09
and low Prob.> F of 0.0003 implied that the model was significant for COD removal and there is only a
ISSN 2076-2895 (Print), ISSN 2076-2909 (Online) ©2012 International Energy & Environment Foundation. All rights reserved.
228
International Journal of Energy and Environment (IJEE), Volume 3, Issue 2, 2012, pp.223-236
0.01% chance that model F-value this large could occur due to noise. In this case, x1, x2, x12, x22, x32 x1x2,
and x1x3 factors were significant model terms whereas x3 and x2x3 factors were insignificant model terms
to the responses.
From Table 4, the model F-value of 8.98 and Prob. > F of 0.0010 indicated that the model was
significant. x1, x3, x12, x22and x32 factors were significant model terms whereas x2, and x1x2, x1x3 and x2x3
factors were insignificant model terms to the responses. The lack of fit test values for COD and colour
removal were 11.45 and 398.43, respectively. It shows that there are only 0.91 and 0.01% chances for
both models that the lack of fit F- values this large could occur due to noise. It was also contributed by
some systematic variation unaccounted in the hypothesized model resulted to undesirably significant lack
of fit.
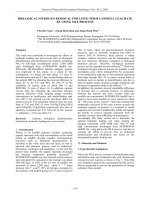
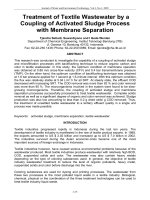
Based on the results of the statistical analysis, the response surface model constructed for predicting
COD and colour removal were adequate and within the range o the variable studied. The finding was
also further justified with the plot of predicted values versus experimental values for COD and colour
removal as shown in Figures 1and 2. It can be seen that the models developed were successful in
capturing the correlation between the DP activated carbon preparations variables to the responses when
the predicted values obtained were quite close to the experimental values.
Figure 1. Predicted versus experimental COD removal of DP activated carbon
Figure 2. Predicted versus experimental of color removal of DP activated carbon
ISSN 2076-2895 (Print), ISSN 2076-2909 (Online) ©2012 International Energy & Environment Foundation. All rights reserved.
International Journal of Energy and Environment (IJEE), Volume 3, Issue 2, 2012, pp.223-236
229
3.3 COD removal
From Table 3, it was observed that the F-value of 37.95 and Prob.>F of 0.0001 for activation
temperature are the highest among all factors. It shows that COD removal is significantly influenced by
the activation temperature of the DP activated carbon compared to the others factors. The effect of
activation time was significant as well. However, it was found that the effect of flow rate contributes less
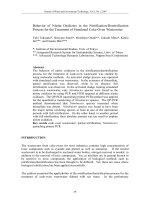
effect to the response. Three-dimensional response surface curves were plotted by statistically significant
model to investigate the interaction of the medium components. Figure 3 demonstrates the effect of
activation time and activation temperature on the COD uptake, with CO2 flow rate fixed at zero level (Q=
100 ml/s). From the figure, the COD removal increases with the increase in activation time and
activation temperature.
Table 3. Analysis of variance (ANOVA) for response surface quadratic model for COD removal of DP
activated carbon
Source
Model
x1
x2
x3
x12
x22
x32
x1x2
x1x3
x2x3
Residual
Lack of fit
Sum of
squares
261.81
91.28
17.30
6.41
42.30
38.21
24.81
15.24
39.60
3.75
24.05
22.12
Degree of
freedom (DF)
9
1
1
1
1
1
1
1
1
1
10
5
Mean
square
29.09
91.28
17.30
6.41
42.30
38.21
24.81
15.24
39.60
3.75
2.41
4.42
F-Value
Prob. > F
Comment
12.09
37.95
7.19
2.66
17.59
15.89
10.31
6.33
16.47
1.56
0.0003
0.0001
0.0230
0.1337
0.0018
0.0026
0.0093
0.0306
0.0023
0.2400
significant
11.45
0.0091
significant
Generally, as the activation temperature increases, higher reaction rate between carbon and CO2 occur
which caused higher releasing of volatile matter. This could accelerate the reaction between C and CO2,
subsequently; the speed of widening pores was faster than that of developing pores. Thus, increases in
pore diameters were expected. Further, it was observed that the activation time played an important role
during CO2 gasification. The time should just be enough to eliminate all the moisture and most of the
volatile components in the precursor to cause pores to develop. Therefore, the capability of DP activated
carbon was further enhanced to adsorb COD which mainly constitutes from organic contents in leachate
sample.
3.4 Colour removal
From Table 4, it can be seen that the F-value of 39.56 and Prob.>F less than 0.0001 for activation
temperature was the highest among all factors. It was followed by the quadratic factor of activation time
with the F-value of 16.38. It can be inferred that the quadratic effects for both activation temperature and
time played significant role for colour removal from leachate. It was further observed that the effect of
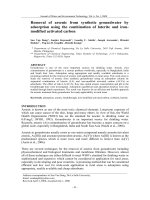
flow rate contributes less effect to the response. Three-dimensional response surface curves were plotted
by statistically significant model to investigate the interaction of the medium components.
Figure 4 demonstrates the effect of activation time and activation temperature on the COD uptake, with
CO2 flow rate was fixed at zero level (Q= 100 ml/s). From the figure, as the activation temperature and
time increase, the colour removal was also increased. Generally as activation temperature increase with
time, some surface metal complexes are produced, which are responsible for further carbon gasification
and release of gaseous products such as CO2, CO and H2. The removal of colour was also dependent by
kinetic rate of adsorption which was found to be influenced not just by film diffusion and by the rate of
adsorption and the internal surface diffusion on the solid surface of the adsorbent [2].
ISSN 2076-2895 (Print), ISSN 2076-2909 (Online) ©2012 International Energy & Environment Foundation. All rights reserved.
230
International Journal of Energy and Environment (IJEE), Volume 3, Issue 2, 2012, pp.223-236
Figure 3. Three-dimensional response surface plot of COD removal of DPAC (effect of temperature and
time, flow rate = 100 ml/s)
Table 4. Analysis of variance (ANOVA) for response surface quadratic model for color removal of DP
activate carbon
Source
Sum of
squares
Model
x1
x2
x3
x12
x22
x32
x1x2
x1x3
x2x3
Residual
Lack of fit
5394.77
714.67
164.37
676.38
2640.63
1093.39
492.61
0.20
192.67
5.000E-003
667.47
665.80
Degree of
freedom
(DF)
9
1
1
1
1
1
1
1
1
1
10
5
Mean square
F-Value
Prob. > F
Comment
599.42
714.67
164.37
676.38
2640.63
1093.39
492.61
0.20
192.67
5.000E-003
66.75
133.16
8.98
10.71
2.46
10.13
39.56
16.38
7.38
3.068E-003
2.89
7.491E-005
0.0010
0.0084
0.1477
0.0098
< 0.0001
0.0023
0.0217
0.9569
0.1202
0.9933
significant
398.43
< 0.0001
significant
ISSN 2076-2895 (Print), ISSN 2076-2909 (Online) ©2012 International Energy & Environment Foundation. All rights reserved.
International Journal of Energy and Environment (IJEE), Volume 3, Issue 2, 2012, pp.223-236
231
Figure 4. Three-dimensional response surface plot of color removal of DPAC (effect of temperature and
time, flow rate = 100 ml/s)
3.5 Process optimization
CCD has been used to optimize the parameters affecting the COD and colour removal responses. Since
the desired interest region for both COD and colour removal was equivalent, the function of desirability
was applied using Design-Expert software to co-joint the factors. In this case, the desired goal for
variables was chosen within the range while the responses set at maximum values. The program
combines the individual desirability’s into a single number, and then searches to maximize this function
[24]. The predicted and experimental results of COD and colour removal obtained were shown in Table
5. The optimum DP activated carbon preparation conditions were obtained by using activation
temperature of 800 °C, activation time of 2.1 h and flow rate of 68.68 ml/s. The optimum DP activated
carbon showed COD and colour removal of 42.47 and 39.86%, respectively. It was observed that the
experimental values obtained were in good agreement with the values predicted from the models, with
relatively small errors, which were only 1.16 and 4.72 %, respectively for COD and colour.
Table 5. Model validation
Model
desirability
0.613
Activation
Temperature,
x1 °C
Activation
time, x2 h
800.00
2.10
CO2
flow
rate, x3
ml/s
COD removal (%)
Color removal (%)
Predicted
Experimental
Error
Predicted
Experimental
Error
68.68
42.47
41.98
1.16
41.74
39.86
4.72
3.6 Equilibrium studies
The equilibrium studies of the experiment were carried out by using Langmuir and Freundlich isotherm
models. Langmuir isotherm is based on the assumption that the adsorbed layer will be one molecule thick
(homogeneous) while Freundlich isotherm assumes that the adsorbent has a heterogeneous surface
composed of different classes of adsorption sites, with adsorption on each class of site following the
Langmuir isotherm [26]. The Langmuir isotherm equation is expressed by the following equation:
ISSN 2076-2895 (Print), ISSN 2076-2909 (Online) ©2012 International Energy & Environment Foundation. All rights reserved.
232
International Journal of Energy and Environment (IJEE), Volume 3, Issue 2, 2012, pp.223-236
x
QbC
=
m 1 + bC
(7)
The linear form of Langmuir isotherm equation is given by following equation:
1
1
1
=
+
( x m) QbC Q
(8)
where x is the amount of material adsorbed (mg), m is the weight of adsorbent (g); C is the equilibrium
concentration of adsorbate in solution after adsorption is complete (mg/L); Q (mg/g) and b is the
Langmuir adsorption constant related to the maximum adsorption capacity and the energy adsorption.
The Freundlich isotherm assumes that adsorption occurs on a heterogenous surface through a multilayer
adsorption mechanism and that the adsorbed amount increases with the concentration according to the
following equation:
1
qe = K F C e n
(9)
where qe is the amount of adsorbate adsorbed at equilibrium, (mg/g), Ce is the equilibrium concentration
of adsorbate, (mg/L), Kf is the Freundlich constant, (mg/g)(L/mg)1/n and n is the Freundlich
heterogeneity factor. The equation is conveniently used in the linear form by taking the logarithmic of
both sides as:
log e = log K f +
1
log C e
n
(10)
Table 6 summarizes all the constants and correlation coefficients, R2 values obtained from the three
isotherm models applied for adsorption of COD and colour on the DP activated carbon. On the basis of
the R2, it can be seen that Freundlich model fitted the data better than Langmuir. This is confirmed by the
high value of correlation coefficient, R2 (0.855) for the Freundlich isotherm model compared to
Langmuir (0.800) indicating surface heterogeneity of the adsorbent and thus is responsible for multilayer
adsorption due to the presence of energetically heterogenous adsorption sites [27]. Langmuir isotherm
model of the DP activated carbon prepared showed relatively large COD adsorption with adsorption
capacity of 61.72 mg/g it is relatively high compared to some previous works which employed
commercial activated carbon for COD adsorption such as [7] (Q = 37.88 mg/g), and [5],(Q = 4.16 mg/g).
For the case of colour adsorption, it can be seen that adsorption of colour is well represented by
Langmuir isotherm considering high values of correlation coefficient, R2 of 0.774 compared to
Freundlich (R2= 0.619) indicating that the adsorption of colour on DP activated carbon takes place as
monolayer adsorption on a surface that is homogeneous in adsorption affinity [24]. By comparing the
adsorption capacity of DP activated carbon, this result is considered relatively high when compared to
previous work which utilized commercial activated carbon to remove colour from landfill leachate such
as [5] (Q= 12.5 mg/g).
Table 6. Langmuir and Freundlich equations for COD and color removal
Leachate
parameters
Isotherm
COD
Langmuir
Q (mg/g)
61.72
b (L/mg)
1.53x10⁻³
Color
100.00
0.111
R
0.800
Freundlich
KF (mg/g (L/mg)1/n)
2.87x10⁻⁸
1/n
3.289
R2
0.855
0.774
2.38x10⁻⁶
2.538
0.619
2
ISSN 2076-2895 (Print), ISSN 2076-2909 (Online) ©2012 International Energy & Environment Foundation. All rights reserved.
International Journal of Energy and Environment (IJEE), Volume 3, Issue 2, 2012, pp.223-236
233
3.7 Characterization of activated carbon prepared under optimum condition
The BET surface area, total pore volume and average pore diameter of the prepared activated carbon
were found to be 763.31 m2/g, 0.35 cm3/g and 6.02 nm, respectively. The average pore diameter of 6.02
nm indicates that the DP activated carbon prepared was in the mesopores region according to the IUPAC
classification IUPAC [28]. The physical activation process has contributed to the relatively high surface
area and total pore volume of the prepared activated carbon. The activated carbon development porosity
is associated with gasification reaction.
Figures 5 (a) and (b), respectively shows the SEM images of the precursor and the DP activated carbon.
By referring to Figure 5 (a), before activation process took place, the surface texture of raw DP was
uneven, rough and undulating with very little pores available on the surface. After activation process, the
resulted DP activated carbon produced large and well-developed pores on its surface as shown in Figure
5 (b). It also can be seen that almost homogeneous type pores structure were distributed on the surface of
the DP activated carbon. This result revealed that the activation process CO2 was effective in creating
well-developed pores, resulting to large surface area activated carbon with good mesoporous structure.
According to Aworn et al. [29], the pore evolution of the activated carbons occurred from continual
devolatilization and carbon–CO2 reaction whereby enhanced pores development on the surface of
activated carbon.
(a)
(b)
Figure 5. SEM images; (a) Raw DP (b) DP activated carbon (magnification 1000 x)
Table 7 presents the proximate and elemental analysis of precursor, char and DP activated carbon. After
undergoing carbonization and activation process, the volatile matter content of the precursors decreased
significantly whereas the fixed carbon content increased in activated carbons. It can be seen that the
carbon content of DP was increased from 38.78 to 62.85% from the elemental analysis. This might be
due to pyrolytic effect at high temperature where most of the organic substances have been degraded and
discharged both as gas and liquid tars leaving a material with high carbon purity [19].
Table 7. Proximate and elemental contents
Sample
Moisture
DP precursor
10.13
Char
10.88
DPAC
17.09
a
Estimated by difference
Proximate analysis (%)
Volatile
Fixed Carbon
Matter
69.30
16.76
54.86
26.40
13.63
60.78
Ash
C
3.80
7.86
8.49
38.78
70.84
62.85
Elemental analysis (%)
H
S
(N+O)a
3.87
2.54
1.44
0.42
0.20
0.12
56.93
26.82
35.59
4. Conclusion
In this research, response surface methodology was successfully used to investigate the effects of
activation temperature, activation time and CO2 flow rate, on the percentage removal of COD and colour
from semi-aerobic landfill leachate. The optimum DP activated carbon preparation conditions were
ISSN 2076-2895 (Print), ISSN 2076-2909 (Online) ©2012 International Energy & Environment Foundation. All rights reserved.
234
International Journal of Energy and Environment (IJEE), Volume 3, Issue 2, 2012, pp.223-236
obtained using 800 °C activation temperature, 2.1 h activation time and 68.68 ml/s of CO2 flow rate.
From the experimental work, the maximum removal of COD and colour obtained were 41.98 and
39.86%, respectively. Through analysis of the response surface, activation temperature and activation
time were found to give significant effects on both COD and colour removal. The DP activated carbon
prepared demonstrated high surface area and well-developed porosity. According to this study, DP
activated carbon can be utilized as the replacement of commercial activated carbon for semi-aerobic
landfill leachate. The equilibrium data were well represented by the Freundlich isotherm for COD
adsorption whereas for colour adsorption, Langmuir isotherm giving maximum monolayer adsorption
capacity as high as 100 mg/g.
Acknowledgements
The authors wish to acknowledge the University Sains Malaysia (USM) for the financial support it
extended under USM fellowship and postgraduate research grant scheme (PRGS) that resulted in this
article.
References
[1] Bashir, M. J. K., Aziz, H. A., Yusoff, M. S., Aziz, S. Q. & Mohajeri, S. (2010) Stabilized Sanitary
Landfill Leachate Treatment Using Anionic Resin: Treatment Optimization By Response Surface
Methodology. Journal Of Hazardous Materials, 182, 115-122.
[2] Aziz, S. Q., Aziz, H. A., Yusoff, M. S. & Bashir, M. J. K. (2011) Landfill leachate treatment using
powdered activated carbon augmented sequencing batch reactor (SBR) process: Optimization by
response surface methodology. Journal of Hazardous Materials, 189, 404-413.
[3] Satyawali, Y. & Balakrishnan, M. (2008) Wastewater treatment in molasses-based alcohol
distilleries for COD and color removal: A review. Journal of environmental management, 86, 481497.
[4] Cotman, M. & Gotvajn, A. Z. (2010) Comparison of different physico-chemical methods for the
removal of toxicants from landfill leachate. Journal of Hazardous Materials, 178, 298-305.
[5] Foul, A. A., Aziz, H. A., Isa, M. H. & Hung, Y. T. (2009) Primary Treatment Of Anaerobic
Landfill Leachate Using Activated Carbon And Limestone: Batch And Column Studies.
International Journal Of Environment And Waste Management, 4, 282-298.
[6] Guo, J. S., Abbas, A. A., Chen, Y. P., Liu, Z. P., Fang, F. & Chen, P. (2010) Treatment Of Landfill
Leachate Using A Combined Stripping, Fenton, Sbr, And Coagulation Process. Journal Of
Hazardous Materials, 178, 699-705.
[7] Halim, A. A., Aziz, H. A., Johari, M. A. M. & Ariffin, K. S. (2010) Comparison study of ammonia
and COD adsorption on zeolite, activated carbon and composite materials in landfill leachate
treatment. Desalination, 262, 31-35.
[8] Zouboulis, A. I. & Petala, M. D. (2008) Performance Of Vsep Vibratory Membrane Filtration
System During The Treatment Of Landfill Leachates. Desalination, 222, 165-175.
[9] Papastavrou, C., Mantzavinos, D. & Diamadopoulos, E. (2009) A comparative treatment of
stabilized landfill leachate: Coagulation and activated carbon adsorption vs. electrochemical
oxidation. Environmental technology, 30, 1547-1553.
[10] Aghamohammadi, N., Aziz, H. A., Isa, M. H. & Zinatizadeh, A. A. (2007) Powdered activated
carbon augmented activated sludge process for treatment of semi-aerobic landfill leachate using
response surface methodology. Bioresource Technology, 98, 3570-3578.
[11] Kurniawan, T. A. & Lo, W. (2009) Removal of refractory compounds from stabilized landfill
leachate using an integrated H2O2 oxidation and granular activated carbon (GAC) adsorption
treatment. Water research, 43, 4079-4091.
[12] Aziz, H. A., Adlan, M. N., Zahari, M. S. M. & Alias, S. (2004) Removal of ammoniacal nitrogen
(N-NH3) from municipal solid waste leachate by using activated carbon and limestone. Waste
Management & Research, 22, 371.
[13] ầeỗen, F., Erdinỗler, A. & Kiliỗ, E. (2003) Effect of powdered activated carbon addition on sludge
dewaterability and substrate removal in landfill leachate treatment. Advances in Environmental
Research, 7, 707-713.
[14] Rivas, F. J., Beltrán, F. J., Gimeno, O., Frades, J. & Carvalho, F. (2006) Adsorption of landfill
leachates onto activated carbon: Equilibrium and kinetics. Journal of Hazardous Materials, 131,
170-178.
ISSN 2076-2895 (Print), ISSN 2076-2909 (Online) ©2012 International Energy & Environment Foundation. All rights reserved.
International Journal of Energy and Environment (IJEE), Volume 3, Issue 2, 2012, pp.223-236
235
[15] Kurniawan, T. A., Lo, W.-H. & Chan, G. Y. S. (2006) Physico-chemical treatments for removal of
recalcitrant contaminants from landfill leachate. Journal of Hazardous Materials, 129, 80-100.
[16] Abbas, A. A., Jingsong, G., Ping, L. Z., Ya, P. Y. & Al-Rekabi, W. S. (2009) Review on LandWll
Leachate Treatments. Journal of Applied Sciences Research, 5, 534-545.
[17] Ahmad, A.A. & B.H. Hameed, Effect of preparation conditions of activated carbon from bamboo
waste for real textile wastewater. Journal of Hazardous Materials, 2010. 173(1-3): p. 487-493.
[18] Ahmad, M. A. & Alrozi, R. (2010) Optimization of preparation conditions for mangosteen peelbased activated carbons for the removal of Remazol Brilliant Blue R using response surface
methodology. Chemical Engineering Journal.
[19] Ahmad, M. A. & Alrozi, R. (2011) Optimization of rambutan peel based activated carbon
preparation conditions for Remazol Brilliant Blue R removal. Chemical Engineering Journal.
[20] Sahu, J. N., Acharya, J. & Meikap, B. C. (2010) Optimization of production conditions for
activated carbons from Tamarind wood by zinc chloride using response surface methodology.
Bioresource Technology, 101, 1974-1982.
[21] Tan, I. A. W., Ahmad, A. L. & Hameed, B. H. (2008) Optimization of preparation conditions for
activated carbons from coconut husk using response surface methodology. Chemical Engineering
Journal, 137, 462-470.
[22] Wai, W. W., Alkarkhi, A. F. M. & Easa, A. M. (2009) Optimization of Pectin Extraction from
Durian Rind (Durio zibethinus) Using Response Surface Methodology. Journal of food science,
74, C637-C641.
[23] APHA, A. (1992) Standard Methods for The Examination of Water and Wastewater. Public Health
Association, Washington.
[24] Bashir, M. J. K., Aziz, H. A., Yusoff, M. S. & Adlan, M. (2010) Application of response surface
methodology (RSM) for optimization of ammoniacal nitrogen removal from semi-aerobic landfill
leachate using ion exchange resin. Desalination, 254, 154-161.
[25] Singh, K. P., Gupta, S., Singh, A. K. & Sinha, S. (2010) Experimental design and response surface
modeling for optimization of Rhodamine B removal from water by magnetic nanocomposite.
Chemical Engineering Journal.
[26] Benefield, L. D., Judkins, J. F. & Weand, B. L. (1982) Process Chemistry for Water and
Wastewater Treatment. Prentice-Hall Inc. USA.
[27] Ahmad, A., Rafatullah, M., Sulaiman, O., Ibrahim, M. H. & Hashim, R. (2009) Scavenging
behaviour of meranti sawdust in the removal of methylene blue from aqueous solution. Journal of
Hazardous Materials, 170, 357-365. 29.
[28] IUPAC (1972), IUPAC manual of symbols and terminology, Pure Appl. Chem. 31
[29] Aworn, A., Thiravetyan, P. & Nakbanpote, W. (2008) Preparation and characteristics of
agricultural waste activated carbon by physical activation having micro- and mesopores. Journal of
Analytical and Applied Pyrolysis, 82, 279-285.
ISSN 2076-2895 (Print), ISSN 2076-2909 (Online) ©2012 International Energy & Environment Foundation. All rights reserved.
236
International Journal of Energy and Environment (IJEE), Volume 3, Issue 2, 2012, pp.223-236
ISSN 2076-2895 (Print), ISSN 2076-2909 (Online) ©2012 International Energy & Environment Foundation. All rights reserved.