Financial information for managemetn paper 1 2 2003 answers
Bạn đang xem bản rút gọn của tài liệu. Xem và tải ngay bản đầy đủ của tài liệu tại đây (113.09 KB, 10 trang )
Answers
Part 1 Examination – Paper 1.2
Financial Information for Management
December 2003 Answers
Section A
11
12
13
14
15
16
17
18
19
10
11
12
13
14
15
16
17
18
19
20
21
22
23
24
25
D
C
C
D
B
C
D
C
C
B
B
D
A
D
A
C
A
C
C
D
D
A
B
A
D
1
D
2
C
3
C
4–(0·95 + 1·25 + 0·7) = 1·1
£
37,500
Marginal costing profit
Add: fixed costs in closing stock
(350 × 4)
Less: fixed costs in opening stock
(100 × 4)
11,400
1,1(400)
–––––––
38,500
–––––––
Absorption costing profit
4
D
5
B
Units
100
150
––––
250
(100)
100
––––
250
(75)
––––
175
––––
Receipts and issues
Price per unit
5·00
5.50
––––
5·30
5·30
6·00
––––
5·58
5·58
––––
5·58
––––
Cost
500
825
––––––
1,325
(530)
600
––––––
1,395
(418·5)
––––––
976·50
––––––
19
6
C
A
1·00512×5 – 1
––––––––––– = 7,000
0·005
A
A × 69·77 = 7,000
A
7,000
A = –––––– = 100·33 ≈ 100
69·77
7
D
8
C
9
C
10 B
Materials
Usage 7,200 × 3 kg = 21,600 kg
kg
Usage
21,600
Opening stock
(400)
Closing stock
500
–––––––
Purchases
21,700
–––––––
hi
low
difference
11 B
400,000 = fixed cost + variable cost per unit × 10,000
250,000 = fixed cost + variable cost per unit × 5,000
150,000 = variable cost per unit × 5,000
150,000
variable cost per unit = ––––––– = £30
5,000
383
IRR = 10% + –––––––––––
383 – (– 246)
(15% – 10%)
383
IRR = 10% + –––––––––– × 5%
383 + 246
383
IRR = 10% + –––– × 5%
629
IRR = 10% + 3% = 13%
12 D
Output
Closing stock
conversion costs
9,850
135
–––––
9,985
–––––
= 450 × 30%
13 A
20
14 D
300
OF
y
200
C
B
100
A
D
OF
0
15 A
16 C
200
100
∑ p3q3 (130 × 2) + (135 × 4) 800
–––––– = ––––––––——––––––– = –––– = 0·86
∑ p3q1 (130 × 3) + (135 × 4) 930
=
Labour required
Spare capacity
Remaining hours required
100 hours from either:
overtime
production of X
500 hours
400 hours
100 hours
no relevant cost
100 × 1·5 × 12 = £1,800
100
(100 × 12) + —— × 4 = 1,400
2
(
)
therefore it is cheaper to take the hours from the production of X
17 A
18 C
Volume variance
Budgeted volume
Actual volume
Difference
10,000 units
9,800 units
–––––––––––
200 units
At standard profit per unit
× £5
Variance
£1,000 adverse
19 C
fixed costs
Breakeven sales revenue = –––––––––
C/S ratio
Fixed costs = £200,000 – £50,000 = £150,000
£200,000
C/S ratio = ––––––––– = 0·4
£500,000
£150,000
Breakeven sales revenue = ––––––––– = £375,000
0·4
21
300
x
20 D
Time
Flow
Discount
factor
Present
value
£000
8%
£000
0
(20,000)
1
(20,000)
1–4
13,000
3·312
19,936
5–8
17,000
5·747 – 3·312=
2·435
17,045
10
(10,000)
0·463
(4,630)
Net Present Value
12,351
21 D
22 A
Over absorbed fixed production overheads
Absorbed overheads
(4,500 × £8)
Actual overheads incurred
23 B
£
(6,000)
36,000
–––––––
30,000
(2,000 × £4·50) + 13,340 – (2,000 × 5% × £3)
cost/unit = ––––––––––––––––––––––––––––––––––––––––––
2,000 – (2,000 × 5%)
£22,040
cost/unit = –––––––– = £11·6
1,900
24 A
25 D
Rate variance
Did cost
Should cost
(14,000 × £10)
Efficiency variance
Did take
Should take
(5,500 × 3)
At standard cost
£
176,000
140,000
––––––––
36,000 adverse
hours
14,000
16,500
–––––––
2,500 favourable
× £10
£25,000 favourable
–––––––––––––––––
22
Section B
1
(a)
Centre 1
Centre 2
Service A
Service B
Service C
2,000
3,500
300
500
700
500 × 50% =
500 × 20% =
500 × 20% =
500 × 10% =
250
100
100
(500)
50
–––––––––––––––––––––––––––––––––––––––––––––––––––––––––––––––––––––––––––––
2,250
3,600
400
0
750
400 × 45% =
400 × 45% =
400 × 10% =
180
180
(400)
40
–––––––––––––––––––––––––––––––––––––––––––––––––––––––––––––––––––––––––––––
2,430
3,780
0
40
750
750 × 60% =
750 × 40% =
450
300
(750)
–––––––––––––––––––––––––––––––––––––––––––––––––––––––––––––––––––––––––––––
2,880
4,080
0
40
0
40 × 50% = 20 40 × 20% = 8 40 × 20% = 8 (40)
40 × 10% = 4
–––––––––––––––––––––––––––––––––––––––––––––––––––––––––––––––––––––––––––––
2,900
4,088
8
0
4
8 × 45% = 4
8 × 45% = 4
(8)
8 × 10% = 0
–––––––––––––––––––––––––––––––––––––––––––––––––––––––––––––––––––––––––––––
2,904
4,092
0
0
4
4 × 60% = 2
4 × 40% = 2
(4)
–––––––––––––––––––––––––––––––––––––––––––––––––––––––––––––––––––––––––––––
2,906
4,094
0
0
0
–––––––––––––––––––––––––––––––––––––––––––––––––––––––––––––––––––––––––––––
The total amount for overheads in production centre 1 is £2,906 and in production centre 2 is £4,094.
2
(b)
Centre 1
The most appropriate basis is to use machine hours as it is machine intensive.
£2,906
Overhead absorption rate = –––––––––– = £0·969/machine hour
3,000 hours
(a)
(i)
£
Total revenue
Costs and
revenue
Total costs
Break-even
revenue
Variable costs
Fixed costs
0
(ii)
Breakeven
volume
units
Contribution would be established by taking the difference between the sales revenue line and the variable costs line.
23
(b)
(i)
Profit
Profit
£
Breakeven point
0
Units
Loss
£
Fixed costs
(ii)
3
Contribution would be established by taking the difference between profit and fixed costs.
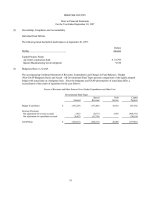
(a)
Sales – units
Production – units
Sales price
Cost of sales
Opening stock
Production costs:
Materials
Labour
Fixed production
overheads
Closing stock
Profit
Flexed budget
9,750
11,000
£000
292·5
= 30 × 9,750
Actual results
9,750
11,000
£000
325
0
0
Variances
£000
32·5 favourable
55
99
= 5 × 11,000
= 9 × 11,000
65
100
10 adverse
1 adverse
96 (note)
––––––––
250
27·5
––––––––
222·5
––––––––
70
––––––––
= 8 × 12,000
95
–––––––––––
260
27·5
–––––––––––
232·5
–––––––––––
92·5
–––––––––––
1 favourable
–––––––––––––
10 adverse
= 22 × (11,000 – 9,750)
–––––––––––––
22·5 favourable
–––––––––––––
Note: This figure can also be established by taking the absorbed fixed production overheads of 8 × 11,000 = £88,000 and
adding the under absorbed amount of £8,000.
(b)
The sales price variance will have arisen due to a higher selling price than budgeted being obtained.
The material variance may have arisen either because the number of kg used were more than expected, and/or the amount
paid per kg was higher than expected.
24
4
(a)
EOQ =
EOQ =
(b)
2CoD
Ch
2 × 200 × 12, 000 = 2,000 units
£1 ⋅ 2
Revised stock costs
Purchase costs (12,000 × £15)
12,000
Order costs –––––– × 200
2,000
2,000
Holding costs ––––– × 15 × 0·08
2
£
180,000
1,200
1,200
––––––––
182,400
183,000
––––––––
600
––––––––
Original stock costs
Saving
(c)
Discounts are likely to increase the EOQ as the holding cost will be reduced.
Since the purchase price is lower the total purchase cost will be reduced.
As the order cost uses the EOQ to divide the total demand, this cost will be reduced as the EOQ has increased.
The holding cost will change as it uses both the increased EOQ and a reduced purchase price.
5
Demand
Selling Price
per unit
Total
Revenue
Marginal
Revenue
Cost
per unit
Total
Cost
Marginal
Cost
Units
£
£
£
£
£
£
=units ×
unit
selling
price
=units ×
cost per
unit
1,100
48
52,800
52,800
22
24,200
24,200
1,200
46
55,200
12,400
21
25,200
11,000
1,300
45
58,500
13,300
20
26,000
11,800
1,400
42
58,800
1,1300
19
26,600
11,600
MR ≥ MC at 1,300 units, therefore profits will be maximised at this point which is a selling price of £45.
25
Part 1 Examination – Paper 1.2
Financial Information for Management
December 2003 Marking Scheme
Marks
Section A
2 marks per question giving a total of 50 marks.
Section B
1
(a)
(b)
reapportionment
1 mark for each correct line using correct %’s max
Note: any method with sound bases for allocation
should be accepted and given full credit.
Conclusion
6
1
–––
reason for using basis
using correct overhead figure from (a)
using machine hours as a basis
using the correct machine hours figure
correct calculation
1
1/
2
1/
2
1/
2
1/
2
–––
2
(a)
(i)
(ii)
(b)
(i)
7
correctly labelled axes
total revenue line
variable cost line
fixed cost line
total cost line
break-even point
3
–––
10
–––
1
1/
2
1/
2
1/
2
1/
2
1
–––
4
total revenue – variable costs
2
–––
correctly labelled axes
profit line
fixed costs
break-even point
6
1/
2
1/
2
1/
2
1/
2
–––
2
(ii)
profit – fixed costs
2
–––
27
4
–––
10
–––
Marks
3
(a)
Flexed budget
Sales units
Production units
Sales revenue
Material cost
Labour cost
Fixed cost
Closing stock
1/
2
1/
2
1/
2
1/
2
1/
2
1/
2
1
Actual figures – all of them
1
Variances
Sales revenue
Material cost
Labour cost
Fixed cost
1/
2
1/
2
1/
2
1/
2
–––
(b)
4
(a)
(b)
(c)
5
Sales price
Mentioning materials price
Mentioning materials usage
1
1
1
–––
correctly putting in the order cost
correctly putting in the annual demand
correctly putting in the holding cost
calculation
on
on
on
on
3
–––
10
–––
1/
2
1/
2
1/
2
1/
2
Purchase cost
Order cost
Holding cost
Saving
Effect
Effect
Effect
Effect
7
EOQ
purchase costs
order costs
holding costs
––-–
2
1
1
1
1
–––
4
1
1
1
1
–––
Calculation of total revenue (1/2 per correct entry)
Calculation of marginal revenue (1/2 per correct entry)
Calculation of total cost (1/2 per correct entry)
Calculation of marginal revenue (1/2 per correct entry)
Profit maximising point
2
2
2
2
2
–––
28
4
–––
10
–––
10
–––