Chẩn đoán vết nứt trong thanh, dầm đàn hồi bằng hàm đáp ứng tần số tt tt tieengs anh
Bạn đang xem bản rút gọn của tài liệu. Xem và tải ngay bản đầy đủ của tài liệu tại đây (1.37 MB, 27 trang )
MINISTRY OF EDUTATION
AND TRAINING
VIETNAM ACADEMY OF SCIENCE
AND TECHNOLOGY
GRADUATE UNIVERSITY OF SCIENCE AND TECHNOLOGY
-----------------------------
LE KHANH TOAN
CRACK DETECTION IN BARS, BEAMS BY
MEASUREMENT OF FREQUENCY RESPONSE
FUNCTION
Specialization: Engineering Mechanics
Code: 9 52 01 01
ABSTRACT OF DOCTOR THESIS
IN MECHANICAL ENGINEERING AND ENGINEERING
MECHANICS
HANOI - 2019
The thesis has been completed at: Graduate University of Science and
Technology - Vietnam Academy of Science and Technology
Supervisions:
1: Prof.DrSc. Nguyen Tien Khiem
2: Assoc.Prof.Dr. Nguyen Viet Khoa
Reviewer 1:
Reviewer 2:
Reviewer 3:
Thesis is defended at Graduate University of Science and Technology
- Vietnam Academy of Science and Technology at…, on
date…month…2019
Hardcopy of the thesis be found at:
- Library of Graduate University of Science and Technology
- Vietnam National Library
INTRODUCTION
1. Significance of the study
Damage in structures, especially cracks, can cause the
construction to collapse if not detected in time. This is proved
by the results of studies of accidents that have occurred in
important projects such as offshore rigs. However, it is difficult
to determine the position and the extent of a crack in a structure,
because the crack usually stays in the structures that the naked
eye cannot detect. Therefore, to diagnose cracks, people often
use non-destructive testing methods. One of these methods,
which is comprehensive and applicable to complex
construction, is based on measuring the oscillation parameters
of a building to determine the position and extent of the damage
in construction.
The oscillation parameters commonly used in structural
failure diagnosis are specific frequencies and patterns of
oscillations or frequency response functions. These parameters
are characteristics which are quite comprehensive for the
technical condition of a building without depending on external
stimuli. However, identifying these characteristics from
measurement data (often understood as measurement) is also an
important issue. This is the problem of Modal Testing
Technique. The specific oscillation frequency is the first
parameter to be used and is still being used in the evaluation of
structural health monitoring. As the specific frequency of
oscillations is associated with the overall properties of the
structure (such as mass, hardness), it is easy to measure
accurately. The biggest obstacle of using specific frequencies
that are still being addressed is that we only measure very few
specific frequencies while the number of failures is often
unknown. If the natural frequency is a numerical characteristic,
1
then the specific oscillation pattern of the structure is a function
feature in space, which can give us more detailed information
about the position of the failure. There have been many
publications using both frequency and specific patterns to
diagnose the damage in the structure, but the existing problem
is the difficulty in measuring the oscillation patterns separately.
In order to be able to measure specific oscillations, a lot of
transducers are required and a specific method of determining
the oscillation patterns accurately from the measurement data
(due to the non-unique nature of the specific oscillation
patterns).
As mentioned above, both the frequency and the specific
patterns of oscillations are determined from the measurement
data of the frequency response function. Determining
frequencies and specific patterns from frequency response
functions also encounter many errors that are still being studied.
In order to avoid the errors in processing the above
measurement data, many experts have suggested using the
frequency response function for the diagnosis of structural
damage. In addition, the frequency response function is also a
function characteristic in the frequency domain that allows us
not only to define a specific frequency, its own oscillation
patterns, but also to show the behavior of the structure in the
vicinity of the frequency (approximate frequency). This
potential of the frequency response function that has not yet
been exploited and applied in diagnosing structural damage.
2. Aims of the study
The aims of this study are to develop and apply the
method of using frequency response functions to diagnose
cracks in elastic bar and beams structure. The contents of the
study includes: building models of cracked elastic bar and
2
beams structure; studying the changes of oscillation parameters,
mainly frequency response functions due to cracks; conducting
experimental studies to measure the oscillation parameters of
cracked elastic bar and beams structure in the laboratory and
proposing some algorithms to diagnose cracks in the structure
based on the built model and experimental measurements.
3. The main contents of the study
(1) Study the change of axial oscillation nodes in the bar
and the bending oscillation of the beam due to the appearance
of cracks in order to diagnose cracks.
(2) Experimental study of elastic bar and beam structure
containing many cracks by measuring frequency response
functions. Since then, we analyze and process the measurement
data of frequency response functions to find specific
experimental frequencies.
(3) Construct an explicit frequency response function in
the bar structure, thereby combining with experimental
measurement data and using CSM (Crack Scanning Method) to
solve the diagnostic problem in the cracked bar.
(4) Using Rayleigh formula and CSM to set up and solve
the problem of crack diagnosis from experimental frequencies.
This thesis includes an introduction, 5 chapters and a
conclusion, in which chapter 1 presents an overview of
literature; chapter 2 presents the theory of multi-cracked bars
and beams; chapter 3 presents the changes in the oscillation
nodes; chapter 4 presents the experimental study and chapter 5
presents the algorithms and results of bar and beam structural
diagnosis based on the frequency response function and
particular frequency.
3
CHAPTER 1: LITERATURE OVERVIEW
1.1. Questions of damage diagnosis
With a technical object, there are always two questions:
the forward question, studying behavior of the structure; the
diagnostic question, in fact is an inverse question, which aims
to detect damage in the structure from the measurement data
based on the analysis of the forward problem. Specifically for a
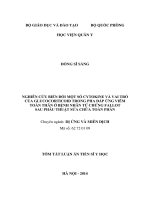
mechanical system, it is often described by a diagram:
X
∑
Y
Figure 1.1. Mechanical diagram of mechanics
with: X: input, external impact,
∑: modeling, describing the structure and characteristics
of the system,
Y: output, the response of the system.
Mechanical systems can be represented by a
mathematical equation:
LY X
A crack is a typical form of failure in the structure of
buildings and machinery. The crack is generally described by its
position and size in the structure. The appearance of cracks in
the structure degrades the hardness of the structure in the
vicinity of the crack.
The diagnosis of cracks in the composition of the
structure has attracted many researchers over the past two
decades as indicated in the general reports of Doebling et al in
1996, Salawu in 1997 and Sohn et al in 2004.
In the diagnosis of damage of the structure in general as
well as the cracks in particular, people often use dynamic
characteristics. The specific oscillation frequencies, specific
4
oscillation patterns and frequency response functions (and
related characteristics such as the hardness and the softness) are
often used.
The diagnosis of damage in general and the cracks in
particular of the structure based on the frequency change
usually only detects the appearance of the crack without
determining the crack position. Meanwhile, the cracks affect
locally. Therefore the crack information is based on the specific
patterns considered in the diagnostic problem.
From domestic and foreign studies, it has been shown
that specific forms can be used to determine the position of
cracks. However, if only the specific form is used for this
purpose, it is necessary to have accurate measurement data,
which is not always practical in practice. Meanwhile, the
response function contains information of both frequency and
specific patterns that can be used to analyze the effect of cracks
on structural response. Measuring frequency response functions
is simple and gives accurate results. Therefore, the development
of methods of application of frequency response functions in
crack diagnosis is very necessary due to its superiority.
1.2. Frequency response functions in diagnosing structural
damage
In the measurement data of oscillation characteristics, it
was found that using the frequency response functions, which is
usually measured directly as input for the diagnosis of damage
is better than using frequency and specific patterns. This is due
to the remarkable advantages of measured frequency response
function data:
• The external frequency response function provides
information about the specific frequency (resonant frequency),
5
which can also provide additional information about the
response of the structure at distant resonant frequencies.
• Using the frequency response function will avoid the
error of processing the measurement data for frequency
separation and the specific form of the measured data (the
frequency response function is the input in the separate format
analysis).
• In addition, important information such as the position
of the measurement point and of the force set can be found in
the frequency response functions.
In recent years the use of a frequency response function
to diagnose the damage in structures can be mentioned as in
2005 proposal of Araujo dos Santos et al - a method of
determining damage based on the sensitivity of frequency
response functions. They pointed out that the damage detection
results would be better if we measured low frequencies and
stimulus nodes, not cracked nodes. Therefore, there is a wide
range of the possibilities of exploiting more information from
the frequency response functions. In 2012 Huang et al identified
the damage of the five-storey house structure in the structural
control problem based on the change of the frequency response
functions and the dampers. Here they have shown that with
greater noise than 10% it is impossible to determine the
damage.
1.3. Reviews and research questions
The method of measuring the oscillation characteristics
of structures to diagnose the damage is currently the most
effective method. However, no matter how we directly analyze
the measurement signal or use the model to diagnose the
damage, the following two problems still exist. One is that the
easy-to-measure characteristics are less sensitive to damage and
6
the second is the measurement error may be greater than the
effect of the damage. Therefore, finding other oscillation
characteristics which is not sensitive to measurement errors, but
is sensitive to the damage to diagnose the damage in the
construction is still an unsolved problem. In the oscillation
characteristics: frequency and specific oscillation patterns, the
drag coefficient and the frequency response function, the
frequency and the frequency response function are easily
measured and the most accurate. However, the frequency
response function is an aggregate feature, including all three
previous features (frequency, specific patterns and drag
coefficient) and describes the spectral structure of the system.
Therefore, the interaction between the vibrational forms and
their sensitivity makes the sensitivity of the frequency response
function to failure very complex and difficult to identify. This is
an obstacle to the use of a frequency response function in
diagnosing structural failure. The majority of published works
in the world for crack diagnosis by impulse response function
are based on finite element method, which does not allow
determining the exact position of the crack. Therefore, it is
necessary to develop methods aimed at utilizing the precise
measurement of the frequency and the frequency response
functions in the diagnosis of the damage, which is finding its
representations through damage parameters. This allows us to
study the frequency sensitivity and frequency response
functions for damage and therefore can apply to the structural
damage diagnosis.
The questions of this thesis are as follows:
Study the change of axial oscillation nodes in the bar,
bending oscillation of the beam due to the appearance of cracks
in order to diagnose the cracks.
7
Experimental study of elastic bar and beam structure
containing many cracks by measuring the frequency response
function. Since then, we can analyze and process measurement
data of frequency response functions in order to find
experimental specific frequencies.
Constructing the explicit frequency response function in
the bar structure, thereby combining with experimental
measurement data and using CSM (Crack Scanning Method) to
solve the diagnostic problem in the bar containing cracks.
Using Rayleigh formula and CSM to set up and solve the
problem of crack diagnosis from experimental frequency.
CHAPTER 2. THE OSCILLATION OF CRACKED BAR
AND BEAM STRUCTURES
2.1. Model of cracks in elastic bar and beam structures
The crack, generally understood as an interface in a solid
object, causes the state of deformation stress at that interface to
be interrupted. The appearance of cracks in the structure
changes the dynamic characteristics. Usually cracks are
characterized by parameters: position, size and shape.
For elastic bars and beams, cracks are considered as
changes in the cross section in a segment of very small length b
with the depth a. It is precisely the crack pattern opened in the
form of a saw which is called The V-shaped crack. The concept
of the crack depth and the beginning of the crack is clearly
described. Furthermore, it is calculated that the decrease in
hardness (or increase in softness) of the bar - beam at the crackcontaining cross-section has led to the idea of modeling the
crack with a spring which is equivalent to the hardness K at the
section containing the crack. Thus, it is possible to describe
8
cracks in elastic beams with a spring that links the two sides of
the crack with the hardness determined by experiment and
destructive mechanical theory.
Figure 2.1. Crack pattern and replacement springs (bending pulling compressors).
2.2. Axial oscillation of cracked elastic bars
The specific oscillation patterns of the elastic bar has the
parameters (E, ρ, A, L), which is defined from the equation:
( x ) 2 ( x ) 0 , x ( 0 ,1), L / c 0 , c 0
E /.
Suppose that there are n cracks in the bars at the
positions e1,..., en with the corresponding depths of a1, ..., and
is described by the springs along the axial hardness Kj - a
function of the crack depth aj. Then the compatibility condition
at the crack is:
2.1.1. Transmission matrix method
As the functions m ( x ), m 1,..., n are continuous
solutions of oscillation equations, they can be expressed in the
form of:
m ( x) A m cos x Bm sin x, m 1, ..., n
Constants are defined from:
Am
A
H m 0
Bm
B0
9
H m Tm Tm1...T1 [ H ijm hij ( , e1 ,...,e m , 1 ,..., m ), i, j 1,2]
1 j sin e j cose j
j cos2 e j
Tj T(, e j , j )
, j 1,..., n
2
1 j sin e j cose j
j sin e j
Then, we can build the typical equation (also called the
frequency equation) in the axial oscillation of the bar with n
cracks by the transmission matrix method.
n
Dn ( ) H 11n S 0p C1q H 12n C0p C1q H 21n S 0p S1q H 22
C0p S1q 0
with
p (cosx)
C C ()
x p
q (cosx)
C1q C1q ()
xq
p
0
p
0
p (sinx)
x 0 ; S S ( )
x 0 ;
x p
q (sinx)
q
q
;
S
S
(
)
x 1 1
1
x 1.
xq
p
0
p
0
2.1.2. The frequency response functions of the axial
oscillation of the bar
Consider the forced oscillion of the cracked bar
described by the equation:
( x) 2 ( x) Q0 ()a0 ( x x0 ), a0 L / EF, 0 x0 1.
It is easy to see that the general solution of the above
equation presented in the form:
x
( x, ) 0 ( x, ) Q0 ( )a0 h( x s) (s x0 )ds.
0
10
Doing the integral on the right and applying the last
boundary condition, we get the general expression of the
frequency response function:
n
h( p) (1 x0 )[ L0 (x) j K(x e j )]
j 1
.
FRF(x, x0 , ) H(x, x0 , ) a0 h(x x0 )
n
( p)
( p)
L0 (1) j K (1 e j )
j 1
Then we analyze the number of the frequency response
function in the axial oscillation of the cracked bar. Consider the
frequency response function in the vicinity of the first and
second specific frequencies, denoted by FRF1 and FRF2. The
effect of crack position on the frequency response functions
mentioned above is shown in Figure 2.2, Figure 2.3 for the twoends free bar. The graph shows the change of the modulus of
response functions by the position and the depth of one or more
cracks.
Figure 2.2. Influence of crack position on FRF1 frequency
response function of the two-ends free rod (30% crack depth).
11
Figure 2.3. Effect of crack position on FRF2 frequency
response function of the two-ends free bar (the crack depth of
30%).
• The change in the frequency response function is
similar to the change of resonance frequency due to the crack.
However, because the frequency response function is a
frequency-dependent function, the changes of the the frequency
response function due to the crack provides more information
than the resonant frequency which is only a fixed numerical
value;
• A small crack in the bar is difficult to be detected by
frequency response functions and it is likely that the question of
crack diagnosis does not have a unique answer, especially with
a bar with symmetrical boundary conditions;
However, the appearance of new peaks in the frequency
response function diagram is also a suggestion to diagnose two,
three or more cracks. The distance between the new peaks are
also a sign to diagnose multi-cracks in a bar;
12
2.2. Bending oscillation of cracked elastic beams
2.2.1. Explicity general test
To solve this question, we divide the beam into n 1
sections (e j 1 , e j ), j 1,..., n 1, e0 0, en 1 1 and consider
the equation in each segment.
It is easy to see that the general solution of the equation
(2.53) has the following form:
j ( x ) C1 L1 j ( x ) C 2 L2 j ( x ) C 3 L3 j ( x ) C 4 L4 j ( x ).
Satisfying the condition at the crack and applying
boundary conditions gives us a typical equation:
n
n
j 1
j 1
D0 ( ) 1 j D2 ( , e j ) 2 j D1 ( , e j )
n
j ,k 1
1j
2 k D12 ( ) 0.
2.2.2. Rayleigh's formula to calculate the specific oscillation
frequency of multi-cracked elastic beams
The approximate formula for calculating the frequency
of cracked beams is the expression of crack parameters.
n
n
j 1
i , j 1
4k 4k 0 j k02 (e j ) k i j ij (ei , e j )k0 (ei )k0 (e j ).
Chapter 2 conclusion
The basic formulas in axial oscillation of cracked elastic
bars have been developed, especially the expression of the
frequency response functions. The frequency response functions
around the first two frequencies (FRF1 and FRF2) depending
on the position, the depth and the number of cracks are
diagnosed in details. The results of the numerical analysis show
that the effect of cracks on the frequency response functions is
clearly expressed in the vicinity of the natural frequency and the
qualitative change which is similar to the change of the natural
13
frequency due to the cracks. However, large deep cracks can
cause new resonant peaks to appear near the initial resonance
peak (of the uncracked beam) and the distance between these
two resonant peaks depends on both position and depth crack;
Basic equations have been established to calculate the
frequency and the specific oscillation pattern of multi-cracked
elastic beams. These equations are the main tool for studying
the effect of cracks on typical oscillation of of beams. In
particular, the Rayleigh formula has been established, a
manifested expression of the specific frequency for crack
parameters. This is the main tool to diagnose cracks by specific
frequency using the scanning method by GS. Nguyen Tien
Khiem proposed. The new feature of this formula compared to
the published results is that it is possible to calculate the
second-order component of crack magnitude. This is an
important factor to solve some difficulties in diagnosing cracks
using the first approximation published in the documents.
CHAPTER 3. AXIAL OSCILLATION NODES IN THE
CRACKED BAR, BENDING OSCILLATION OF
CRACKED BEAMS
3.1. Concept of oscillation nodes in elastic bars and beams
One of the oscillation characteristics, which is very
similar to the frequency in terms of both the nature and the
measurement method, is the oscillation nodes. By definition, the
oscillation node is the position in the structure where some
patterns of oscillation are suppressed (equal to 0).
3.2. The axial oscillation nodes in the cracked elastic bar
tan xm
H11m S0p ( ) H12mC0p ( )
H 22m C0p ( ) H 21m S 0p ( )
14
0
0,05
e3=0.8,a=10%
0,1
e3=0.85,a=25%
e1
e3=0.84,a=20%
e3=0.85,a=23,2905%
e3=0.8,a=25%
0,15
0,2
e3=0.8,a=20%
e3=0.85,a=30%
e3=0.9025222
0.25
0.3
0.35
0.4
0.45
0.5
e2
0.55
0.6
0.65
0.7
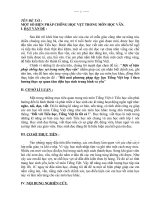
Figure 3.1. The effect of the third crack on the displacement of
the second node (the second oscillation pattern). The nondisplacement contour lines of the second node depend on the
first and second crack positions corresponding to the position
and the depth of the third crack.
3.3. The oscillation nodes of the cracked elastic beams
E110
0
4 E21
1
n
E1 jT j1
j 1
Fm1 ( xm )
E120
E130
0
22
0
23
E
4
E
j 1
1
1j
T
E
n
j2
Fm 2 ( xm )
4
E
j 1
1
1j
0
24
T jn3
Fm 3 ( xm )
15
A
0
E
B0
4
0
E11jT jn4 C0
j 1
Fm 4 ( xm ) D 0
E140
0.01
0.005
S u t h ay d o i d ie m n u t th u n ha t
0
-0.005
-0.01
-0.015
-0.02
0
0.1
0.2
0.3
0.4
0.5
Vi tri vet nut
0.6
0.7
0.8
0.9
1
Figure 3.2. The change of the position of the first node (1/3) of
the third pattern according to the crack position and the depth
varying from 0% to 50% in the two-end single-girder beam.
0.015
Su thay doi diem nut, mode 2
0.01
0.005
0
-0.005
-0.01
-0.015
0
0.1
0.2
Vi tri vet nut thu nhat
0.3
0.4
0.5
0.5
0.55
0.6
0.65
0.7
0.75
0.9
0.85
0.8
Vi tri vet nut thu hai
0.95
1
Figure 3.3. The change of the position of the second pattern
according to the position of the two cracks on both sides of the
node, the two-end single-girder beam.
Chapter 3 conclusion
Thus, the illustrated numerical results obtained for the
bar have been described more clearly and in detail than the
results of Delina and Morassi, in which the “push-pull” areas
are not clearly defined.
The pictures above allow us to determine the direction of
movement of the nodes due to the effect of cracks. These are
16
the charts which allow us to partition, even determine the exact
position of the crack when the position of the nodes is
measured.
CHAPTER 4. EXPERIMENTAL MEASUREMENT FOR
THE MODEL IN THE LAB
4.1. Measuring frequency response function for the cracked
elastic bar model
A free two-ends concrete bar model, with a circular section of
0.2m in diameter, 1.5m in length (Figure 4.4) has been made for
the experimental measurement of frequency response functions
and crack diagnosis by frequency response functions. Two
cracks are the saws with the depth of 12% and 5%, which were
created at the positions of 0.49m and 1.02m.
Figure 4.1. Experimental model and measuring equipment
system
Figure 4.2. Input signal and FRF of the elastic concrete bar
17
4.2. Measurement of frequency response functions for 006D
cracked elastic model
Figure 4.3. Experimental model of two-ends elastic beams.
Figure 4.6. Frequency response function (FRF) on logarithmic
scale and linearly-stimulated scale at p = 0.28m.
Chapter 4 conclusion
In this chapter, a brief theoretical overview of the
measurement of the frequency response function and the use of
the frequency response function in determining specific
frequencies are presented;
The frequency response function of the bar in the first
and second separate frequencies vicinity was measured. Only
the measurement results in the vicinity of specific frequencies
18
were selected, without the far-fetched frequencies. The result
shows the graph of the frequency response function not only at
the resonant peaks (used to determine the corresponding
frequencies and oscillation patterns) but also shows the
behavior of the frequency response function at the frequencies
near the resonance. Our understanding of the frequency
response function is widened in order to diagnose cracks by
frequency response functions.
In addition, the measured frequency data of cracked
beams were compared with the calculated results. This
comparison allows us to simultaneously verify the correctness
of both: calculation and measurement.
CHAPTER 5. CRACK DIAGNOSIS IN THE ELASTIC
BEAMS
5.1. Scanning method in diagnosing cracks with oscillation
(1) Selecting a split grid
(0 e1 e2 .... en 1)
including the positions of possible cracks with unknown depths
(a1,....., an ) ;
(2) Building the model of beams with above cracks and
using this model to establish the equations of crack diagnosis
from measurement data;
(3) Using the above diagnostic equations together with
the given measurement data, determine the vector of magnitude
parameters of unknown cracks ( 1 ,..., n ) ;
(4) Removing the positions corresponding to the crack
magnitude with 0 or negative in the split grid, we get a new split
grid with the number of smaller nodes (eˆ1 ,..., eˆnc )
corresponding to the positive magnitude values (ˆ1 ,..., ˆnc ) ;
19
(5) Using the new split grid of the crack position
(eˆ1 ,..., eˆnc ) to repeat steps 2-3-4 until the new grid is not
received, then stop;
(6) The final split grid obtained in step 5 is the position
of possible cracks (e1 ,..., er ) , corresponding to the the positive
crack magnitudes ( 1 ,..., r ) ;
(7) From the magnitude of the crack found ( 1 ,..., r )
using the T.G. Chondros formula to calculate the crack depth;
(8) Finally, we found the position (e1 ,..., er ) and the
depth (a1 ,....., ar ) together with the number of r-cracks, and
then the question was solved.
5.2. Crack diagnose for the bar by the frequency response
function
Developing the following diagnostic equations
n
j 1
j
(, e, μ)γ j b( ).
Using the frequency response function measurement
data for the above concrete bar model, the result of crack
position diagnosis for the following figure.
Figure 5.1. Results of the crack diagnosis in the concrete bar by
FRF1 frequency response function.
20
5.2. Diagnose cracks in beams by the measurement
frequency
Figure 5.2. Diagnosis results of 03 cracks at the position 0.2,
0.45 and 0.7 with 10% depth (a. diagnosis result is similar to
the first, linear; b, c - intermediate nonlinear iterations; d. the
final iteration).
Chapter 5 conclusion
In chapter 5, the following results has been presented:
A general crack scanning method was proposed by Prof.
Nguyen Tien Khiem was presented and will be applied for two
questions of cracking diagnosis in bars from frequency response
function and in beams from measured frequencies;
The diagnosis algorithm with scanning method has been
applied to the bar using the measurement of the frequency
response function in the first frequency vicinity. Since the
measurement of the frequency response function is sufficiently
large (at frequencies in the resonant region), the number of
chosen cracks assumed by the scanning method is always equal
to the number of frequency division points in the adjacent
frequency range. Therefore, the Tikhonov adjustment does not
need to be applied. Moreover, the iteration performed in the
algorithm is according to the damaged index variable () rather
than repeating the crack magnitude. The diagnosis results show
that the diagnosis of crack in the bar by the frequency response
21
function only gives accurate results when the crack depth is
greater than 10%, although the measured data has increased
significantly;
A crack scanning algorithm was applied for crack
diagnosis in beams based on the same frequency measurement
data and using the extended Rayleigh formula for multi-cracked
beams. Since the number of measurement frequencies is
limited, it is necessary to apply Tikhonov in the scanning
algorithm and iteration method in the crack magnitude vector.
Cracks, including the number of cracks, are correctly
diagnosed, although the number of measured frequencies is still
small because the Tikhonov adjustment method was applied and
the diagnostic equation was precised (due to the quadratic
approximation for the crack magnitude).
22
CONCLUSION AND SUGGESTION
1. The explicit expressions of frequency, specific
patterns and frequency response functions in axial oscillation of
cracked bars and beams was constructed. This model is quite
convenient in analyzing the effect of cracks on the dynamic
characteristics of bars and beams and is an effective tool to
diagnose cracks by dynamic characteristics, especially the
frequency response function;
2. The effect of cracks on the frequency response
function in the axial oscillation of the bar has been studied in
detail. In particular, it has been explored that the cracks can
cause new resonant peaks to appear in the vicinity of the initial
resonance peak. This may be an expression of the nonlinear
effect of the cracks on linear elastic bars;
3. The change of the oscillation nodes (which is the
position on the beam where the specific oscillation patterns are
eliminated) due to the cracks has been studied in detail. It has
been found that the movement (both magnitude and direction)
of the oscillation nodes depends heavily on the crack position
and the change in the natural frequency of the structure due to
the crack. These changes are important indicators for
determining the position and the depth of cracks;
4. Experimental measurements of the frequency response
function of the cracked elastic bars and beams have been carried
out methodically and in detail. Measurement results in
accordance with theory and practice were collected. At the same
time, this makes the input data reliable enough to diagnose
cracks with experimental measurement data;
5. Scanning method to diagnose cracks in the bar by
frequency response function was applied. This method of crack
diagnosis has been tested on an experimental model of a
cracked concrete bar. The diagnostic results show that the
23