climate change evidence and causes full
Bạn đang xem bản rút gọn của tài liệu. Xem và tải ngay bản đầy đủ của tài liệu tại đây (3.69 MB, 36 trang )
Climate Change
Evidence & Causes
An overview from the Royal Society and the
US National Academy of Sciences
n sum m a r y
Foreword
CLIMATE CHANGE IS ONE OF THE DEFINING ISSUES OF OUR TIME. It is now more
certain than ever, based on many lines of evidence, that humans are changing Earth’s
climate. The atmosphere and oceans have warmed, accompanied by sea-level rise, a
strong decline in Arctic sea ice, and other climate-related changes.
The evidence is clear. However, due to the nature of science, not every single detail is ever
totally settled or completely certain. Nor has every pertinent question yet been answered.
Scientific evidence continues to be gathered around the world, and assumptions and
findings about climate change are continually analysed and tested. Some areas of active
debate and ongoing research include the link between ocean heat content and the rate of
warming, estimates of how much warming to expect in the future, and the connections
between climate change and extreme weather events.
The Royal Society and the US National Academy of Sciences, with their similar missions
to promote the use of science to benefit society and to inform critical policy debates, offer
this new publication as a key reference document for decision makers, policy makers,
educators, and other individuals seeking authoritative answers about the current state
of climate-change science. The publication makes clear what is well established, where
consensus is growing, and where there is still uncertainty. It is written and reviewed by a
UK-US team of leading climate scientists. It echoes and builds upon the long history of
climate-related work from both national science academies, as well as the newest climatechange assessment from the United Nations’ Intergovernmental Panel on Climate Change.
Scientific information is a vital component of the evidence required for societies to make
sensible policy decisions. Climate-change science will continue to help society make
informed decisions about how to reduce the magnitude of climate change and to adapt to
its impacts. The Royal Society and the US National Academy of Sciences will continue to
support the use of robust science toward these critical goals.
In 2008 Raymond and Beverly Sackler established the USA-UK Scientific Forum to help
the scientists of the United Kingdom and the United States forge an enduring partnership
on topics of worldwide scientific concern. As Presidents of the Royal Society and National
Academy of Sciences, we are pleased to introduce the latest piece of work supported by
the Sacklers’ inspired generosity.
Dr. Ralph J. Cicerone
President, National Academy of Sciences
2
Clim at e Ch a nge
Sir Paul Nurse
President, Royal Society
contents
Summary ......................................................................................................................................................... 2
Climate Change Q& A
1 Is the climate warming? ............................................................................................................................ 3
2 How do scientists know that recent climate change is largely caused by human activities? .............. 5
3CO2 is already in the atmosphere naturally, so why are emissions from
human activity significant? ....................................................................................................................... 6
4 What role has the Sun played in climate change in recent decades? .................................................... 7
5 What do changes in the vertical structure of atmospheric temperature—from the
surface up to the stratosphere—tell us about the causes of recent climate change? ......................... 8
6 Climate is always changing. Why is climate change of concern now? .................................................. 9
7 Is the current level of atmospheric CO2 concentration unprecedented in Earth’s history? ................. 9
8 Is there a point at which adding more CO2 will not cause further warming? ..................................... 10
9 Does the rate of warming vary from one decade to another? .............................................................. 11
10Does the recent slowdown of warming mean that climate change is no longer happening? ............ 12
11 If the world is warming, why are some winters and summers still very cold? ..................................... 13
12Why is Arctic sea ice decreasing while Antarctic sea ice is not? .......................................................... 14
13How does climate change affect the strength and frequency
of floods, droughts, hurricanes, and tornadoes? .................................................................................. 15
14How fast is sea level rising? ................................................................................................................... 16
15 What is ocean acidification and why does it matter? ............................................................................ 17
16How confident are scientists that Earth will warm further over the coming century? ....................... 18
17 Are climate changes of a few degrees a cause for concern? ................................................................ 19
18What are scientists doing to address key uncertainties
in our understanding of the climate system? ....................................................................................... 19
19 Are disaster scenarios about tipping points like ‘turning off the Gulf Stream’
and release of methane from the Arctic a cause for concern? ............................................................. 21
20If emissions of greenhouse gases were stopped, would the climate return
to the conditions of 200 years ago? ...................................................................................................... 22
The Basics of Climate Change .............................................................................................. B1–B8
Conclusion ................................................................................................................................................ 23
Acknowledgements ............................................................................................................................. 24
For Further Reading .......................................................................................................................... C3
E v i de n c e & C a u se s
1
Summary
GREENHOUSE GASES such as carbon dioxide (CO2) absorb heat (infrared radiation)
emitted from Earth’s surface. Increases in the atmospheric concentrations of these
gases cause Earth to warm by trapping more of this heat. Human activities—especially
the burning of fossil fuels since the start of the Industrial Revolution—have increased
atmospheric CO2 concentrations by about 40%, with more than half the increase
occurring since 1970. Since 1900, the global average surface temperature has increased by
about 0.8 °C (1.4 °F). This has been accompanied by warming of the ocean, a rise in sea
level, a strong decline in Arctic sea ice, and many other associated climate effects. Much
of this warming has occurred in the last four decades. Detailed analyses have shown
that the warming during this period is mainly a result of the increased concentrations of
CO2 and other greenhouse gases. Continued emissions of these gases will cause further
climate change, including substantial increases in global average surface temperature and
important changes in regional climate. The magnitude and timing of these changes will
depend on many factors, and slowdowns and accelerations in warming lasting a decade
or more will continue to occur. However, long-term climate change over many decades
will depend mainly on the total amount of CO2 and other greenhouse gases emitted as a
result of human activities.
2
Clim at e Ch a nge
Q& A
1
Is the climate warming?
Yes. Earth’s average surface air temperature has increased by about 0.8 °C (1.4 °F)
since 1900, with much of this increase taking place since the mid-1970s (figur e 1 a).
A wide range of other observations (such as reduced Arctic sea ice extent and increased
ocean heat content) and indications from the natural world (such as poleward shifts
of temperature-sensitive species of fish, mammals, insects, etc.) together provide
incontrovertible evidence of planetary-scale warming.
The clearest evidence for surface warming comes from widespread thermometer records. In some places,
these records extend back to the late 19th century. Today, temperatures are monitored at many thousands
of locations, over both the land and ocean surface. Indirect estimates of temperature change from such
sources as tree rings and ice cores help to place recent temperature changes in the context of the past. In
terms of the average surface temperature of Earth, these indirect estimates show that 1983 to 2012 was
probably the warmest 30-year period in more than 800 years.
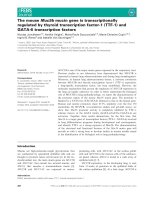
Figure 1a. Earth’s global average
surface temperature has risen as
shown in this plot of combined
land and ocean measurements
from 1850 to 2012, derived from
three independent analyses of the
available data sets. The temperature
changes are relative to the global
average surface temperature of
1961−1990. Source: IPCC AR5, data from
the HadCRUT4 dataset (black), UK Met
Office Hadley Centre, the NCDC MLOST
dataset (orange), US National Oceanic
and Atmospheric Administration, and the
NASA GISS dataset (blue), US National
Aeronautics and Space Administration.
Anomaly (°C) relative to 1961–1990
A wide range of other observations provides a more comprehensive picture of warming throughout the
climate system. For example, the lower atmosphere and the upper layers of the ocean have also warmed,
snow and ice cover are decreasing in the Northern Hemisphere, the Greenland ice sheet is shrinking, and
sea level is rising [Figur e 1b]. These measurements are made with a variety of monitoring systems, which
gives added confidence in the reality that Earth’s climate is warming.
E v i de n c e & C a u se s
3
n Q& A
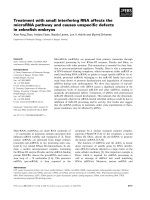
Figur e 1b. A large amount of
observational evidence besides
the temperature records shows
that Earth’s climate is changing.
For example, additional evidence
of a warming trend can be found
in the dramatic decrease in the
extent of Arctic sea ice at its
summer minimum (which occurs
in September), decrease in spring
snow cover in the Northern
Hemisphere, increases in the global
average upper ocean (upper 700 m
or 2300 feet) heat content (shown
relative to the 1955–2006 average),
and in sea-level rise.
Source: NOAA climate.gov
4
Clim at e Ch a nge
Q& A n
2
How do scientists know that recent
climate change is largely caused by
human activities?
Scientists know that recent climate change is largely caused by human activities from an
understanding of basic physics, comparing observations with models, and fingerprinting
the detailed patterns of climate change caused by different human and natural influences.
Since the mid-1800s, scientists have known that CO2 is one of the main greenhouse gases of importance to
Earth’s energy balance. Direct measurements of CO2 in the atmosphere and in air trapped in ice show that
atmospheric CO2 increased by about 40% from 1800 to 2012. Measurements of different forms of carbon
(isotopes, see Question 3) reveal that this increase is due to human activities. Other greenhouse gases
(notably methane and nitrous oxide) are also increasing as a consequence of human activities. The observed
global surface temperature rise since 1900 is consistent with detailed calculations of the impacts of the
observed increase in atmospheric CO2 (and other human-induced changes) on Earth’s energy balance.
Different influences on climate have different signatures in climate records. These unique fingerprints are
easier to see by probing beyond a single number (such as the average temperature of Earth’s surface), and
looking instead at the geographical and seasonal patterns of climate change. The observed patterns of
surface warming, temperature changes through the atmosphere, increases in ocean heat content, increases
in atmospheric moisture, sea level rise, and increased melting of land and sea ice also match the patterns
scientists expect to see due to rising levels of CO2 and other human-induced changes (see Question 5).
The expected changes in climate are based on our understanding of how greenhouse gases trap heat.
Both this fundamental understanding of the physics of greenhouse gases and fingerprint studies show
that natural causes alone are inadequate to explain the recent observed changes in climate. Natural causes
include variations in the Sun’s output and in Earth’s orbit around the Sun, volcanic eruptions, and internal
fluctuations in the climate system (such as El Niño and La Niña). Calculations using climate models (see
infobox, p.20) have been used to simulate what would have happened to global temperatures if only
natural factors were influencing the climate system. These simulations yield little warming, or even a slight
cooling, over the 20th century. Only when models include human influences on the composition of the
atmosphere are the resulting temperature changes consistent with observed changes.
E v i de n c e & C a u se s
5
n Q& A
3
CO2 is already in the atmosphere
natur ally, so why are emissions from
human activity significant?
Human activities have significantly disturbed the natural carbon cycle by extracting longburied fossil fuels and burning them for energy, thus releasing CO2 to the atmosphere.
In nature, CO2 is exchanged continually between the atmosphere, plants and animals through
photosynthesis, respiration, and decomposition, and between the atmosphere and ocean through gas
exchange. A very small amount of CO2 (roughly 1% of the emission rate from fossil fuel combustion) is
also emitted in volcanic eruptions. This is balanced by an equivalent amount that is removed by chemical
weathering of rocks.
The CO2 level in 2012 was about 40% higher than it was in the nineteenth century. Most of this CO2
increase has taken place since 1970, about the time when global energy consumption accelerated.
Measured decreases in the fraction of other forms of carbon (the isotopes 14C and 13C) and a small
decrease in atmospheric oxygen concentration (observations of which have been available since 1990)
show that the rise in CO2 is largely from combustion of fossil fuels (which have low 13C fractions and no
14
C). Deforestation and other land use changes have also released carbon from the biosphere (living
world) where it normally resides for decades to centuries. The additional CO2 from fossil fuel burning and
deforestation has disturbed the balance of the carbon cycle, because the natural processes that could
restore the balance are too slow compared to the rates at which human activities are adding CO2 to the
atmosphere. As a result, a substantial fraction of the CO2 emitted from human activities accumulates
in the atmosphere, where some of it will remain not just for decades or centuries, but for thousands of
years. Comparison with the CO2 levels measured in air extracted from ice cores indicates that the current
concentrations are higher than they have been in at least 800,000 years (see Question 6).
6
Clim at e Ch a nge
Q& A n
4
What role has the Sun played in
climate change in recent decades?
The Sun provides the primary source of energy driving Earth’s climate system, but its
variations have played very little role in the climate changes observed in recent decades.
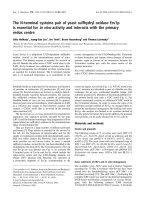
Direct satellite measurements since the late 1970s show no net increase in the Sun’s output, while at the same time global surface temperatures have increased [Figur e 2].
For earlier periods, solar changes are less certain because they are inferred from indirect
sources — including the number of sunspots and the abundance of certain forms (isotopes) of carbon
or beryllium atoms, whose production rates in Earth’s atmosphere are influenced by variations in the
Sun. There is evidence that the 11 year solar cycle, during which the Sun’s energy output varies by roughly
0.1%, can influence ozone concentrations, temperatures, and winds in the stratosphere (the layer in the
atmosphere above the troposphere, typically from 12 to 50 km, depending on latitude and season). These
stratospheric changes may have a small effect on surface climate over the 11 year cycle. However, the
available evidence does not indicate pronounced long-term changes in the Sun’s output over the past
century, during which time human-induced increases in CO2 concentrations have been the dominant
influence on the long-term global surface temperature increase. Further evidence that current warming
is not a result of solar changes can be found in the temperature trends at different altitudes in the
atmosphere (see Question 5).
Figur e 2. Measurements of the
Sun’s energy incident on Earth
show no net increase in solar
forcing during the past 30 years,
and therefore this cannot be
responsible for warming during
that period. The data show only
small periodic amplitude variations
associated with the Sun’s 11-year
cycle. Figure by Keith Shine.
Source: TSI data from PhysikalischMeteorologisches Observatorium
Davos, Switzerland, adjusted down
by 4.46 W m-2 to agree with the 2008
solar minimum data from Kopp and
Lean, 2011; temperature data from the
HadCRUT4 dataset, UK Met Office,
Hadley Centre
E v i de n c e & C a u se s
7
n Q& A
5
What do changes in the vertical
structure of atmospheric temperature
— from the surface up to the
stratosphere — tell us about the
causes of recent climate change?
The observed warming in the lower atmosphere and cooling in the upper atmosphere
provide us with key insights into the underlying causes of climate change and reveal that
natural factors alone cannot explain the observed changes.
In the early 1960s, results from mathematical/physical models of the climate system first showed that
human-induced increases in CO2 would be expected to lead to gradual warming of the lower atmosphere
(the troposphere) and cooling of higher levels of the atmosphere (the stratosphere). In contrast, increases
in the Sun’s output would warm both the troposphere and the full vertical extent of the stratosphere. At
that time, there was insufficient observational data to test this prediction, but temperature measurements
from weather balloons and satellites have since confirmed these early forecasts. It is now known that the
observed pattern of tropospheric warming and stratospheric cooling over the past 30 to 40 years is broadly
consistent with computer model simulations that include increases in CO2 and decreases in stratospheric
ozone, each caused by human activities. The observed pattern is not consistent with purely natural changes
in the Sun’s energy output, volcanic activity, or natural climate variations such as El Niño and La Niña.
Despite this agreement between the global-scale patterns of modelled and observed atmospheric temperature change, there are still some differences. The most noticeable differences are in the tropical troposphere, where models currently show more warming than has been observed, and in the Arctic, where the
observed warming of the troposphere is greater than in most models.
8
Clim at e Ch a nge
Q& A n
6
Climate is always changing. Why is
climate change of concern now?
All major climate changes, including natural ones, are disruptive. Past climate changes led
to extinction of many species, population migrations, and pronounced changes in the land
surface and ocean circulation. The speed of the current climate change is faster than most of
the past events, making it more difficult for human societies and the natural world to adapt.
The largest global-scale climate variations in Earth’s recent geological past are the ice age cycles (see
infobox, p.B4), which are cold glacial periods followed by shorter warm periods [Figur e 3]. The last few
of these natural cycles have recurred roughly every 100,000 years. They are mainly paced by slow changes
in Earth’s orbit which alter the way the Sun’s energy is distributed with latitude and by season on Earth.
These changes alone are not sufficient to cause the observed magnitude of change in temperature, nor to
act on the whole Earth. Instead they lead to changes in the extent of ice sheets and in the abundance of
CO2 and other greenhouse gases which amplify the initial temperature change and complete the global
transition from warm to cold or vice versa.
Recent estimates of the increase in global average temperature since the end of the last ice age are 4 to 5
°C (7 to 9 °F). That change occurred over a period of about 7,000 years, starting 18,000 years ago. CO2 has
risen by 40% in just the past 200 years, contributing to human alteration of the planet’s energy budget
that has so far warmed Earth by about 0.8 °C (1.4 °F). If the rise in CO2 continues unchecked, warming
of the same magnitude as the increase out of the ice age can be expected by the end of this century or
soon after. This speed of warming is more than ten times that at the end of an ice age, the fastest known
natural sustained change on a global scale.
7
Is the current level of atmospheric
CO2 concentr ation unprecedented
in Earth’s history?
The present level of atmospheric CO2 concentration is almost certainly unprecedented
in the past million years, during which time modern humans evolved and societies
developed. The atmospheric CO2 concentration was however higher in Earth’s more
distant past (many millions of years ago), at which time palaeoclimatic and geological
data indicate that temperatures and sea levels were also higher than they are today.
Measurements of air in ice cores show that for the past 800,000 years up until the 20th century, the
atmospheric CO2 concentration stayed within the range 170 to 300 parts per million (ppm), making the recent
rapid rise to nearly 400 ppm over 200 years particularly remarkable [figure 3]. During the glacial cycles of
the past 800,000 years both CO2 and methane have acted as important amplifiers of the climate changes
triggered by variations in Earth’s orbit around the Sun. As Earth warmed from the last ice age, temperature
continued
E v i de n c e & C a u se s
9
n Q& A
and CO2 started to rise at approximately the same time and continued to rise in tandem from about 18,000 to
11,000 years ago. Changes in ocean temperature, circulation, chemistry and biology caused CO2 to be released
to the atmosphere, which combined with other feedbacks to push Earth into an even warmer state.
Data from ice cores have
been used to reconstruct Antarctic
temperatures and atmospheric
CO2 concentrations over the past
800,000 years. Temperature is
based on measurements of the
isotopic content of water in the
Dome C ice core. CO2 is measured
in air trapped in ice, and is a
composite of the Dome C and
Vostok ice core. The current CO2
concentration (blue star) is from
atmospheric measurements. The
cyclical pattern of temperature
variations constitutes the ice
age/ interglacial cycles. During
these cycles, changes in CO2
concentrations (in blue) track
closely with changes in temperature
(in red). As the record shows, the
recent increase in atmospheric CO2
concentration is unprecedented
in the past 800,000 years. Source:
Figur e 3.
For earlier geological times, CO2 concentrations and temperatures have been inferred from less direct
methods. Those suggest that the concentration of CO2 last approached 400 ppm about 3 to 5 million
years ago, a period when global average surface temperature is estimated to have been about 2 to 3.5°C
higher than in the pre-industrial period. At 50 million years ago, CO2 may have reached 1000 ppm, and
global average temperature was probably about 10°C warmer than today. Under those conditions, Earth
had little ice, and sea level was at least 60 metres higher than current levels.
Figure by Jeremy Shakun, data from
Lüthi et al., 2008 and Jouzel et al., 2007.
8
Is there a point at which adding more
CO2 will not cause further warming?
No. Adding more CO2 to the atmosphere will cause surface temperatures to continue to
increase. As the atmospheric concentrations of CO2 increase, the addition of extra CO2
becomes progressively less effective at trapping Earth’s energy, but surface temperature
will still rise.
Our understanding of the physics by which CO2 affects Earth’s energy balance is confirmed by laboratory
measurements, as well as by detailed satellite and surface observations of the emission and absorption
of infrared energy by the atmosphere. Greenhouse gases absorb some of the infrared energy that Earth
emits in so-called bands of stronger absorption that occur at certain wavelengths. Different gases absorb
energy at different wavelengths. CO2 has its strongest heat-trapping band centred at a wavelength of 15
micrometres (millionths of a metre), with wings that spread out a few micrometres on either side. There
are also many weaker absorption bands. As CO2 concentrations increase, the absorption at the centre of
the strong band is already so intense that it plays little role in causing additional warming. However, more
energy is absorbed in the weaker bands and in the wings of the strong band, causing the surface and
lower atmosphere to warm further.
10
Clim at e Ch a nge
Q& A n
9
Does the r ate of warming vary from
one decade to another?
Yes. The observed warming rate has varied from year to year, decade to decade, and place
to place, as is expected from our understanding of the climate system. These shorterterm variations are mostly due to natural causes, and do not contradict our fundamental
understanding that the long-term warming trend is primarily due to human-induced
changes in the atmospheric levels of CO2 and other greenhouse gases.
Even as CO2 is rising steadily in the atmosphere, leading to gradual warming of Earth’s surface, many natural
factors are modulating this long-term warming. Large volcanic eruptions increase the number of small
particles in the stratosphere that reflect sunlight, leading to short-term surface cooling lasting typically two
to three years, followed by a slow recovery. Ocean circulation and mixing vary naturally on many time scales,
causing variations in sea surface temperatures as well as changes in the rate at which heat is transported to
greater depths. For example, the tropical Pacific swings between warm El Niño and cooler La Niña events
on timescales of two to seven years. Scientists know of and study many different types of climate variations,
such as those on decadal and multi-decadal timescales in the Pacific and North Atlantic Oceans, each with
its own unique characteristics. These oceanic variations are associated with significant regional and global
shifts in temperature and rainfall patterns that are evident in the observations.
Warming from decade to decade can also be affected by human factors such as variations in the emissions,
from coal-fired power plants and other pollution sources, of greenhouse gases and of aerosols (airborne
particles that can have both warming and cooling effects).
Office, based on the HadCRUT4 dataset
from the Met Office and Climatic
Research Unit (Morice et al., 2012).
0.5°C
Annual average
0°C
0.5°C
−0.5°C
0°C
10-year average
0.5°C
0°C
−0.5°C
30-year average
0.5°C
−0.5°C
0°C
60-year average
Temperature change
(relative to the 1961−1990 average
varies naturally from year to year
and from decade to decade, reliable
inferences about human-induced
climate change must be made with
a longer view, using multi-decadal
and longer records. Calculating a
‘running average’ over these longer
timescales allows one to more easily
see long-term trends. For the global
average temperature for the period
1850-2012 (using the data from
the UK Met Office Hadley Centre
relative to the 1961-90 average) the
plots show: (top) the average and
range of uncertainty for annually
averaged data; (2nd plot) the
temperature given for any date is
the average for the ten years about
that date; (3rd plot) the equivalent
picture for 30-year; and (4th plot)
the 60-year averages. Source: Met
These variations in the temperature trend are clearly evident in the observed temperature record [Figur e
Short-term natural climate variations could also affect the long-term human-induced climate change
signal and vice-versa, because climate variations on different space and timescales can interact with
one another. It is partly for this reason that climate change projections are made using climate models
(see infobox, p.20) that can account for many different types of climate variations and their interactions.
Reliable inferences about human-induced climate change must be made with a longer view, using records
that cover many decades.
4].
Temperature change
(relative to the 1961−1990 average
Figure 4. As the climate system
−0.5°C
1850
1900
1950
2000
E v i de n c e & C a u se s
11
n Q& A
10
Does the recent slowdown of
warming mean that climate change
is no longer happening?
No. Since the very warm year 1998 that followed the strong 1997-98 El Niño, the
increase in average surface temperature has slowed relative to the previous decade
of rapid temperature increases. Despite the slower rate of warming the 2000s were
warmer than the 1990s. A short-term slowdown in the warming of Earth’s surface does
not invalidate our understanding of long-term changes in global temperature arising
from human-induced changes in greenhouse gases.
Decades of slow warming as well as decades of accelerated warming occur naturally in the climate system.
Decades that are cold or warm compared to the long-term trend are seen in the observations of the past
150 years and also captured by climate models. Because the atmosphere stores very little heat, surface
temperatures can be rapidly affected by heat uptake elsewhere in the climate system and by changes in
external influences on climate (such as particles formed from material lofted high into the atmosphere
from volcanic eruptions). More than 90% of the heat added to Earth is absorbed by the oceans and
penetrates only slowly into deep water. A faster rate of heat penetration into the deeper ocean will slow the
warming seen at the surface and in the atmosphere, but by itself will not change the long-term warming
that will occur from a given amount of CO2. For example, recent studies show that some heat comes out
of the ocean into the atmosphere during warm El Niño events, and more heat penetrates to ocean depths
in cold La Niñas. Such changes occur repeatedly over timescales of decades and longer. An example is the
major El Niño event in 1997–98 when the globally averaged air temperature soared to the highest level in
the 20th century as the ocean lost heat to the atmosphere, mainly by evaporation.
Recent studies have also pointed to a number of other small cooling influences over the past decade or so.
These include a relatively quiet period of solar activity and a measured increase in the amount of aerosols
(reflective particles) in the atmosphere due to the cumulative effects of a succession of small volcanic
eruptions. The combination of these factors, both the interaction between the ocean and the atmosphere
and the forcing from the Sun and aerosols, is thought likely to be responsible for the recent slowdown in
surface warming.
Despite the decadal slowdown in the rise of average surface temperature, a longer-term warming trend
is still evident (see Figure 4). Each of the last three decades was warmer than any other decade since
widespread thermometer measurements were introduced in the 1850s. Record heatwaves have occurred
in Australia (January 2013), USA (July 2012), in Russia (summer 2010), and in Europe (summer 2003). The
continuing effects of the warming climate are also seen in the increasing trends in ocean heat content and
sea level, as well as in the continued melting of Arctic sea ice, glaciers and the Greenland ice sheet.
12
Clim at e Ch a nge
Q& A n
11
If the world is warming, why are some
winters and summers still very cold?
Global warming is a long-term trend, but that does not mean that every year will be
warmer than the previous one. Day to day and year to year changes in weather patterns
will continue to produce some unusually cold days and nights, and winters and summers,
even as the climate warms.
Climate change means not only changes in globally averaged surface temperature, but also changes in
atmospheric circulation, in the size and patterns of natural climate variations, and in local weather. La
Niña events shift weather patterns so that some regions are made wetter, and wet summers are generally
cooler. Stronger winds from polar regions can contribute to an occasional colder winter. In a similar way,
the persistence of one phase of an atmospheric circulation pattern known as the North Atlantic Oscillation has contributed to several recent cold winters in Europe, eastern North America, and northern Asia.
Atmospheric and ocean circulation patterns will evolve as Earth warms and will influence storm tracks
and many other aspects of the weather. Global warming tilts the odds in favour of more warm days and
seasons and fewer cold days and seasons. For example, across the continental United States in the 1960s
there were more daily record low temperatures than record highs, but in the 2000s there were more than
twice as many record highs as record lows. Another important example of tilting the odds is that over
recent decades heatwaves have increased in frequency in large parts of Europe, Asia and Australia.
E v i de n c e & C a u se s
13
n Q& A
12
Why is Arctic sea ice decreasing
while Antarctic sea ice is not?
Sea ice extent is affected by winds and ocean currents as well as temperature. Sea ice
in the partly-enclosed Arctic Ocean seems to be responding directly to warming, while
changes in winds and in the ocean seem to be dominating the patterns of climate and sea
ice change in the ocean around Antarctica.
Sea ice in the Arctic has decreased dramatically since the late 1970s, particularly in summer and autumn.
Since the satellite record began in 1978 (providing for the first time a complete and continuous areal
coverage of the Arctic), the yearly minimum Arctic sea ice extent (which occurs in early to mid-September)
has decreased by more than 40% [Figur e 5]. Ice cover expands again each Arctic winter but the ice is
thinner than it used to be. Estimates of past sea ice extent suggest that this decline may be unprecedented
in at least the past 1,450 years. The total volume of ice, the product of ice thickness and area, has
decreased faster than ice extent over the past decades. Because sea ice is highly reflective, warming is
amplified as the ice decreases and more sunshine is absorbed by the darker underlying ocean surface.
Figur e 5. The Arctic summer
sea ice extent in 2012, (measured
in September) was a record low,
shown (in white) compared to the
median summer sea ice extent for
1979 to 2000 (in orange outline). In
2013, Arctic summer sea ice extent
rebounded somewhat, but was still
the sixth smallest extent on record.
Source: National Snow and Ice Data
Center
14
Clim at e Ch a nge
Sea ice in the Antarctic has shown a slight increase in extent since 1979 overall, although some areas,
such as that to the west of the Antarctic Peninsula, have experienced a decrease. Changes in surface
wind patterns around the continent have contributed to the Antarctic pattern of sea ice change while
ocean factors such as the addition of cool fresh water from melting ice shelves may also have played a
role. The wind changes include a recent strengthening of westerly winds, which reduces the amount of
warm air from low latitudes penetrating into the southern high latitudes and alters the way in which ice
moves away from the continent. The change in winds may result in part from the effects of stratospheric
ozone depletion over Antarctica (i.e., the ozone hole, a phenomenon that is distinct from the humandriven changes in long-lived
greenhouse gases discussed in
this document). However, shortterm trends in the Southern
Ocean, such as those observed,
can readily occur from natural
variability of the atmosphere,
ocean and sea ice system.
Q& A n
13
How does climate change affect the
strength and frequency of floods,
droughts, hurricanes, and tornadoes?
Earth’s lower atmosphere is becoming warmer and moister as a result of human-emitted
greenhouse gases. This gives the potential for more energy for storms and certain severe
weather events. Consistent with theoretical expectations, heavy rainfall and snowfall events
(which increase the risk of flooding) and heatwaves are generally becoming more frequent.
Trends in extreme rainfall vary from region to region: the most pronounced changes are
evident in North America and parts of Europe, especially in winter.
Attributing extreme weather events to climate change is challenging because these events are by definition
rare and therefore hard to evaluate reliably, and are affected by patterns of natural climate variability. For
instance, the biggest cause of droughts and floods around the world is the shifting of climate patterns
between El Niño and La Niña events. On land, El Niño events favour drought in many tropical and subtropical
areas, while La Niña events promote wetter conditions in many places, as has happened in recent years.
These short-term and regional variations are expected to become more extreme in a warming climate.
There is considerable uncertainty about how hurricanes are changing because of the large natural variability
and the incomplete observational record. The impact of climate change on hurricane frequency remains
a subject of ongoing studies. While changes in hurricane frequency remain uncertain, basic physical
understanding and model results suggest that the strongest hurricanes (when they occur) are likely
to become more intense and possibly larger in a warmer, moister atmosphere over the oceans. This is
supported by available observational evidence in the North Atlantic. Some conditions favourable for strong
thunderstorms that spawn tornadoes are expected to increase with warming, but uncertainty exists in other
factors that affect tornado formation, such as changes in the vertical and horizontal variations of winds.
E v i de n c e & C a u se s
15
n Q& A
14
How fast is sea level rising?
Long-term measurements of tide gauges and recent satellite data show that global sea
level is rising, with best estimates of the global-average rise over the last two decades
centred on 3.2 mm per year (0.12 inches per year). The overall observed rise since 1901 is
about 20 cm (8 inches) [Figur e 6].
This sea-level rise has been driven by (in order of importance): expansion of water volume as the ocean
warms, melting of mountain glaciers in most regions of the world, and losses from the Greenland and
Antarctic ice sheets. All of these result from a warming climate. Fluctuations in sea level also occur due to
changes in the amounts of water stored on land. The amount of sea level change experienced at any given
location also depends on a variety of other factors, including whether regional geological processes and
rebound of the land weighted down by previous ice sheets are causing the land itself to rise or sink, and
whether changes in winds and currents are piling ocean water against some coasts or moving water away.
The effects of rising sea level are felt most acutely in the increased frequency and intensity of occasional
storm surges. If CO2 and other greenhouse gases continue to increase on their current trajectories, it is
projected that sea level may rise by a further 0.5 to 1 m (1.5 to 3 feet) by 2100. But rising sea levels will
not stop in 2100; sea levels will be much higher in the following centuries as the sea continues to take up
heat and glaciers continue to retreat. It remains difficult to predict the details of how the Greenland and
Antarctic Ice Sheets will respond to continued warming, but it is thought that Greenland and perhaps West
Antarctica will continue to lose mass, whereas the colder parts of Antarctica could start to gain mass as
they receive more snowfall from warmer air that contains more moisture. Sea level in the last interglacial
(warm) period around 125,000 years ago peaked at probably 5 to 10 m above the present level. During this
period, the polar regions were warmer than they are today. This suggests that, over millennia, long periods
of increased warmth will lead to very significant loss of parts of the Greenland and Antarctic Ice Sheets and
to consequent sea level rise.
Observations show that
the global average sea level has
risen by about 20 cm (8 inches)
since the late 19th century. Sea level
is rising faster in recent decades;
measurements from tide gauges
(blue) and satellites (red) indicate
that the best estimate for the
average sea level rise over the last
two decades is centred on 3.2 mm
per year (0.12 inches per year). The
shaded area represents the sea level
uncertainty, which has decreased as
the number of gauge sites used in
the global averages and the number
of data points have increased.
Figur e 6.
Source: Shum and Kuo (2011)
16
Clim at e Ch a nge
Q& A n
15
What is ocean acidification and why
does it matter?
Direct observations of ocean chemistry have shown that the chemical balance of seawater
has shifted to a more acidic state (lower pH) [Figur e 7]. Some marine organisms (such
as corals and some shellfish) have shells composed of calcium carbonate which dissolves
more readily in acid. As the acidity of sea water increases, it becomes more difficult for
them to form or maintain their shells.
CO2 dissolves in water to form a weak acid, and the oceans have absorbed about a third of the CO2 resulting
from human activities, leading to a steady decrease in ocean pH levels. With increasing atmospheric CO2,
the chemical balance will change even more during the next century. Laboratory and other experiments
show that under high CO2 and in more acidic waters, some marine species have misshapen shells and
lower growth rates, although the effect varies among species. Acidification also alters the cycling of
nutrients and many other elements and compounds in the ocean, and it is likely to shift the competitive
advantage among species, with as-yet-to-be-determined impacts on marine ecosystems and the food web.
400
pCO2 or CO2 concentration
(2009) and Bates et al. (2012).
390
Atmospheric CO2 concentration (ppm)
Surface Ocean pCO2, Bermuda (μatm)
Surface Ocean pCO2, Hawaii (μatm)
380
370
360
350
340
330
320
8.11
8.10
8.09
pH
As CO2 in the air has
increased, there has been an
increase in the CO2 content of the
surface ocean (upper box), and a
decrease in the seawater pH (lower
box). Source: adapted from Dore et al.
figur e 7.
8.08
Surface Ocean pH
Bermuda
Hawaii
1990
1995
8.07
2000
Year
2005
2010
8.06
E v i de n c e & C a u se s
17
n Q& A
16
How confident are scientists that
Earth will warm further over the
coming century?
Very confident. If emissions continue on their present trajectory, without either technological or regulatory abatement, then warming of 2.6 to 4.8 °C (4.7 to 8.6 °F) in addition to that
which has already occurred would be expected by the end of the 21st century.
Warming due to the addition of large amounts of greenhouse gases to the atmosphere can be understood in
terms of very basic properties of greenhouse gases. It will in turn lead to many changes in natural climate processes, with a net effect of amplifying the warming. The size of the warming that will be experienced depends
largely on the amount of greenhouse gases accumulating in the atmosphere and hence on the trajectory
of emissions [Figure 8]. If the total cumulative emissions since 1870 are kept below about 1 trillion (million
million) tonnes of carbon, then there is a two-thirds chance of keeping the rise in global average temperature
since the pre-industrial period below 2 °C (3.6 oF). However, over half this amount has already been emitted.
Based just on the established physics of the amount of heat CO2 absorbs and emits, a doubling of
atmospheric CO2 concentration from pre-industrial levels (up to about 560 ppm) would by itself, without
amplification by any other effects, cause a global average temperature increase of about 1 °C (1.8 °F).
However, the total amount of warming from a given amount of emissions depends on chains of effects
(feedbacks) that can individually either amplify or diminish the initial warming.
figur e 8. If emissions continue
on their present trajectory, without
either technological or regulatory
abatement, then the best estimate
is that global average temperature
will warm a further 2.6 to 4.8 °C
(4.7 to 8.6 °F) by the end of the
century (right). The figure on left
shows projected warming with very
aggressive emissions reductions.
The figures represent multi-model
estimates of temperature averages
for 2081-2100 compared to
1986–2005. Source: IPCC AR5
18
Clim at e Ch a nge
The most important amplifying feedback is caused by water vapour, which is a potent greenhouse gas in the
atmosphere as warmer air can hold more moisture. Also, as Arctic sea ice and glaciers melt, more sunlight
is absorbed into the darker underlying land and ocean surfaces causing further warming and further melting
of ice and snow. The biggest uncertain factor in our knowledge of feedbacks is in how the properties of
clouds will change in response to climate change. Other feedbacks involve the carbon cycle. Currently the
land and oceans together absorb about half of the CO2 emitted from human activities, but the capacities of
land and ocean to store additional carbon are expected to decrease with additional warming, leading to faster
increases in atmospheric CO2 and faster warming. Models vary in their projections of how much additional
warming to expect, but all such models agree that the overall net effect of feedbacks is to amplify the
CO2-only warming by a factor of 1.5 to 4.5.
Q& A n
17
Are climate changes of a few degrees
a cause for concern?
Yes. Even though an increase of a few degrees in global average temperature does not
sound like much, global average temperature during the last ice age was only about 4 to
5 °C (7 to 9 °F) colder than now. Global warming of just a few degrees will be associated
with widespread changes in regional and local temperature and precipitation as well as
with increases in some types of extreme weather events. These and other changes (such
as sea level rise and storm surge) will have serious impacts on human societies and the
natural world.
Both theory and direct observations have confirmed that global warming is associated with greater warming
over land than oceans, moistening of the atmosphere, shifts in regional precipitation patterns and increases in
extreme weather events, ocean acidification, melting glaciers, and rising sea levels (which increases the risk of
coastal inundation and storm surge). Already, record high temperatures are on average significantly outpacing
record low temperatures, wet areas are becoming wetter as dry areas are becoming drier, heavy rainstorms
have become heavier, and snowpacks (an important source of freshwater for many regions) are decreasing.
These impacts are expected to increase with greater warming and will threaten food production,
freshwater supplies, coastal infrastructure, and especially the welfare of the huge population currently
living in low-lying areas. Even though certain regions may realise some local benefit from the warming, the
long-term consequences overall will be disruptive.
18
What are scientists doing to
address key uncertainties in our
understanding of the climate system?
Science is a continual process of observation, understanding, modelling, testing and
prediction. The prediction of a long-term trend in global warming from increasing
greenhouse gases is robust and has been confirmed by a growing body of evidence.
Nevertheless, understanding (for example, of cloud dynamics, and of climate variations
on centennial and decadal timescales and on regional-to-local spatial scales) remains
incomplete. All of these are areas of active research.
Comparisons of model predictions with observations identify what is well-understood and, at the same
time, reveal uncertainties or gaps in our understanding. This helps to set priorities for new research.
Vigilant monitoring of the entire climate system—the atmosphere, oceans, land, and ice—is therefore
critical, as the climate system may be full of surprises.
continued
E v i de n c e & C a u se s
19
n Q& A
Together, field and laboratory data and theoretical understanding are used to advance models of Earth’s climate
system and to improve representation of key processes in them, especially those associated with clouds,
aerosols, and transport of heat into the oceans. This is critical for accurately simulating climate change and
associated changes in severe weather, especially at the regional and local scales important for policy decisions.
Simulating how clouds will change with warming and in turn may themselves affect warming, remains
one of the major challenges for global climate models, in part because many cloud processes occur on
scales smaller than the current models can resolve. Greater computer power may enable some of these
processes to be resolved in future-generation models.
Dozens of groups and research institutions work on climate models, and scientists are now able to analyse
results from essentially all of the world’s major Earth-System Models and compare them with each other and
with observations. Such opportunities are of tremendous benefit in bringing out the strengths and weaknesses of various models and diagnosing the causes of differences among models, so that research can focus
on the relevant processes. The differences among models allow estimates to be made of the uncertainties in
projections of future climate change, and in understanding which aspects of these projections are robust.
Studying how climate responded to major changes in the past is another way of checking that we understand
how different processes work and that models are capable of performing under a wide range of conditions.
Why are computer models used to study climate change?
The future evolution of Earth’s climate as it responds to
the present rapid rate of increasing atmospheric CO2 has
no precise analogues in the past, nor can it be properly
understood through laboratory experiments. As we are also
unable to carry out deliberate controlled experiments on Earth
itself, computer models are among the most important tools
used to study Earth’s climate system.
Climate models are based
on mathematical equations
that represent the best
understanding of the basic
laws of physics, chemistry,
and biology that govern the
behaviour of the atmosphere,
ocean, land surface, ice, and
other parts of the climate
system, as well as the
20
Clim at e Ch a nge
interactions among them. The most comprehensive climate
models, Earth-System Models, are designed to simulate
Earth’s climate system with as much detail as is permitted by
our understanding and by available supercomputers.
The capability of climate models has improved steadily since
the 1960s. Using physics-based equations, the models can
be tested and are successful in simulating a broad range of
weather and climate variations, for example from individual
storms, jet stream meanders, El Niño events, and the climate
of the last century. Their projections of the most prominent
features of the long-term human-induced climate change signal
have remained robust, as generations of increasingly complex
models yield richer details of the change. They are also used
to perform experiments to isolate specific causes of climate
change and to explore the consequences of different scenarios
of future greenhouse gas emissions and other influences on
climate.
Q& A n
19
Are disaster scenarios about tipping
points like ‘turning off the Gulf
Stream’ and release of methane from
the Arctic a cause for concern?
Results from the best available climate models do not predict abrupt changes in such
systems (often referred to as tipping points) in the near future. However, as warming
increases, the possibilities of major abrupt change cannot be ruled out.
The composition of the atmosphere is changing towards conditions that have not been experienced for
millions of years, so we are headed for unknown territory, and uncertainty is large. The climate system
involves many competing processes that could switch the climate into a different state once a threshold
has been exceeded.
A well-known example is the south-north ocean overturning circulation, which is maintained by cold salty
water sinking in the North Atlantic and which involves the transport of extra heat to the North Atlantic via
the Gulf Stream. During the last ice age, pulses of freshwater from the ice sheet over North America led to
slowing down of this overturning circulation and to widespread changes in climate around the Northern
Hemisphere. Freshening of the North Atlantic from the melting of the Greenland ice sheet is however,
much less intense and hence is not expected to cause abrupt changes. As another example, Arctic
warming could destabilise methane (a greenhouse gas) trapped in ocean sediments and permafrost,
potentially leading to a rapid release of a large amount of methane. If such a rapid release occurred, then
major, fast climate changes would ensue.
Such high-risk changes are considered unlikely in this century, but are by definition hard to predict.
Scientists are therefore continuing to study the possibility of such tipping points beyond which we risk
large and abrupt changes.
E v i de n c e & C a u se s
21
n Q& A
20
If emissions of greenhouse gases were
stopped, would the climate return
to the conditions of 200 years ago?
No. Even if emissions of greenhouse gases were to suddenly stop, Earth’s surface temperature
would not cool and return to the level in the pre-industrial era for thousands of years.
If emissions of CO2 stopped altogether, it would take many thousands of years for atmospheric CO2 to
return to ‘pre-industrial’ levels due to its very slow transfer to the deep ocean and ultimate burial in ocean
sediments. Surface temperatures would stay elevated for at least a thousand years, implying extremely
long-term commitment to a warmer planet due to past and current emissions, and sea level would likely
continue to rise for many centuries even after temperature stopped increasing [Figur e 9] . Significant
cooling would be required to reverse melting of glaciers and the Greenland ice sheet, which formed
during past cold climates. The current CO2-induced warming of Earth is therefore essentially irreversible
on human timescales. The amount and rate of further warming will depend almost entirely on how much
more CO2 humankind emits.
figur e 9. If global emissions
were to suddenly stop, it would
take a long time for surface air
temperatures and the ocean to
begin to cool, because the excess
CO2 in the atmosphere would
remain there for a long time and
would continue to exert a warming
effect. Model projections show how
atmospheric CO2 concentration
(a), surface air temperature (b),
and ocean thermal expansion (c)
would respond following a scenario
of business-as-usual emissions
ceasing in 2300 (red), a scenario
of aggressive emission reductions,
falling close to zero 50 years from
now (orange), and two intermediate
emissions scenarios (green and
blue). The small downward tick
in temperature at 2300 is caused
by the elimination of emissions
of short-lived greenhouse gases,
including methane. Source: Zickfeld
et al., 2013
22
Clim at e Ch a nge
Q& A n
The Basics of
Climate Change
Greenhouse gases affect Earth’s energy balance and climate
The Sun serves as the primary energy source for Earth’s climate. Some of the incoming
sunlight is reflected directly back into space, especially by bright surfaces such as ice and
clouds, and the rest is absorbed by the surface and the atmosphere. Much of this absorbed
solar energy is re-emitted as heat (longwave or infrared radiation). The atmosphere in turn
absorbs and re-radiates heat, some of which escapes to space. Any disturbance to this
balance of incoming and outgoing energy will affect the climate. For example, small changes
in the output of energy from the Sun will affect this balance directly.
If all heat energy emitted from the surface passed through the atmosphere directly into
space, Earth’s average surface temperature would be tens of degrees colder than today.
Greenhouse gases in the atmosphere, including water vapour, carbon dioxide, methane,
and nitrous oxide, act to make the surface much warmer than this, because they absorb and
emit heat energy in all directions (including downwards), keeping Earth’s surface and lower
atmosphere warm [Figure B1]. Without this greenhouse effect, life as we know it could not
have evolved on our planet. Adding more greenhouse gases to the atmosphere makes it
even more effective at preventing heat from escaping into space. When the energy leaving is
less than the energy entering, Earth warms until a new balance is established.
Greenhouse gases
in the atmosphere, including
water vapour, carbon dioxide,
methane, and nitrous oxide, absorb
heat energy and emit it in all
directions (including downwards),
keeping Earth’s surface and
lower atmosphere warm. Adding
more greenhouse gases to the
atmosphere enhances the effect,
making Earth’s surface and lower
atmosphere even warmer. Image
based on a figure from US EPA.
figur e b1.
THE GREENHOUSE EFFECT
Some solar radiation
is reflected by
Earth and the
atmosphere
Some of the infrared radiation
passes through the atmosphere.
Some is absorbed by greenhouse
gases and re-emitted in all directions
by the atmosphere. The effect of
this is to warm Earth’s
Atmosphere
surface and the
lower atmosphere.
Earth‘s Surface
Some radiation
is absorbed
by Earth’s
surface and
warms it
Infrared radiation
is emitted by
Earth’s surface
E v i de n c e & C a u se s
B1