International association of fish meal manufacturers hoval house orchard parade mutton lane potters bar hertfordshire
Bạn đang xem bản rút gọn của tài liệu. Xem và tải ngay bản đầy đủ của tài liệu tại đây (436.57 KB, 12 trang )
r
international association of fish meal manufacturers
Hoval House. Orchard Parade. Mutton Lane. Potters Bar. Hertfordshire. EN6 3AR
Tel: (Potters Bar) 0707 42343
No. I
OCTOBER 1970
AVAILABLE AMINO ACID CONTENT OF FISH MEALS
Summary. The Food and Agriculture Organization of the United Nations has recently issued
a paper entitled "Available Amino Acid Content of Fish Meals" in which the most recent data
on this subject have been evaluated. The data have been compared with figures for soyabean
meal and meat meal. From animal experiments the mean percentage availability for lysine,
methionine and tryptophan is estimated as 93. 97, 103 for fish meals; 86, 75, 77 for meat
meals; 90, 101, 103 for soyabean meals respectively. These figures correspond quite closely
to the true digestibility values for the amino acids which are 91% for fish meal, 91 % for
soyabean meal and 71 % for meat meals. This suggests that indigestibility is a major cause of
incomplete availability. Thus the evidence indicates that fish meals and soyabean meals have
comparable high amino acid availability, whilst meat meals have a lower aniino acid availability.
Some time ago the Food and Agriculture Organisation of the United Nations initiated the collection of analytical data for various feedstuffs, including fish meal, to be used in the fonnulation of
feeds. At the beginning of this year Dr. E.L.Miller of the University of Cambridge, U.K. was
commissioned to prepare a review paper, entitled "Available Amino Acid Content of Fish Meals",
so that the most important amino acid data could be collected together and evaluated. The 66-page
document has now been published and is available from F.A.O. Headquarters in Rome l .
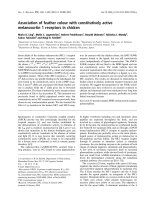
The paper presents the mean values for the amino acid composition of fish meals detennined in
the last 10 years by ion exchange chromatography (Table I). These figures are based on results of
analyses of .159 samples by a number of different laboratories. The standard deviations appropriate
to the mean values of the fish meals listed in Table I are presented in Table 2. The standard deviations were determined either from results obtained in one particular laboratory or from results
obtained from a number of laboratories; thus the standard deviations are expressed as either "within
laboratory" or "between laboratory" respectively. The question arises as to which is the appropriate
standard deviation. If it is desired to know the confidence limits within which an analysis from any
laboratory should fall, then the "between laboratory" standard deviation is appropriate. On the
other hand if it is desired to know the variability between fish meals of a similar type, then the
"within laboratory" standard deviation is more appropriate, since variability due to the laboratory
--- - - - - - - _ . _ - - - - - - - - - - - - - - - - -
TABLE 1
MEAN VALUE OF TOTAL AMINO ACID COMPOSITION (g/16gN) OF FISH MEALS DETERMINED MAINLY BY
ION- EXCHANGE CHROMATOGRAPHY
Herring meals
Anchovy meals
Pilchard &
Maasbanker meals
Tuna
(mixed species)
offal meals
White fish meals
Lysine
7,73
7,75
7,94
7,30
7,56
6,90
Methionine
2,86
2,95
2,71
2,75
2,82
2,60
Cystine
0,97
0,94
0,95
0,79
0,90
0,93
Tryptophan
1,15
1,20
1,02
1,05
1,07
0,94
Histidine
2,41
2,43
3,02
3,41
2,32
2,01
Arginine
5,84
5,82
5,95
6,43
6,04
6,37
Threonine
4,26
4,31
4,38
4,34
3,97
3,85
Valine
5,41
5,29
5,41
5,31
5,10
4,47
Isoleucine
4,49
4,68
4,48
4,46
4,40
3,70
Leucine
7,50
7,62
7,30
7,20
7,14
6,48
Phenylalanine
-3,91
4,21
3,91
4,10
3,95
3,29
Tyrosine
3,13
3,40
3,23
3,28
3,22
2,60
Aspartic acid
9,10
9,49
9,37
9,30
9,07
8,54
Serine
3,82
3,84
4,27
4,18
3,61
4,75
12,77
12,96
12,92
11,93
12,70
12,71)
Proline
4,15
4,17
4,52
5,43
4,58
5,34
Glycine
5,97
5,62
6,92
8,15
6,78
9,92
Alanine
6,25
6,31
6,17
6,76
5,94
6,31
65,4
53,24
62,01
65,01
9,0
6,20
8,25
8,49
Glutamic acid
Crude protein %
Moisture %
Ash %
73,6
6,93
65,4
8,01
I
I
\
Menhaden meals
processed by wet
reduction
\
20,92
)
~
TABLE 2
STANDARD DEVIATIONS APPROPRIATE TO MEAN VALUES GIVEN IN TABLE 1.
Herrin. meals
w
Anchovy meals
Pilchard &
Tuna
Maasbanker meals (mixed species)
offal meals
Between authors
within
within a single
laboratory
laboratory
Menhaden wet
reduction
within
laboratory
White fish
meals
Between
laboratories
Between
laboratories
Within
laboratory
Between
laboratories
Within
laboratory
Lysine
0,77
0,52
0,77
0,43
0,33
0,49
0,39
0,96
Methionine
0,59
0,21
0,34
0,17
0,23
0, II
0,16
0,32
Cystine
0,12
0,12
0,18
0,13
0,04
0,12
0,11
0,31
Tryptophan
0,48
0,10
·0,29
0,14
0, II
0,10
0,15
0,12
Histidine
0,79
0,31
0,55
0,25
0,34
0,28
0,21
0,44
Arginine
0,89
0,62
0,52
0,29
0,29
0,28
0,37
0,52
Threonine
0,58
0,33
0,70
0,21
0,28
0,24
0,20
0,35
Valine
0,42
0,30
0,42
0,35
0,46
0,44
0,21
0,64
Isoleucine
0,43
0,27
0,32
0,20
0,36
0,23
0,22
0,51
Leucine
0,73
0,36
0,49
0,35
0,33
0,34
0,34
0,67
Phenylalanine 0,38
0,17
0,39
0,21
0,36
0,19
0,19
0,61
Tyrosine
0,51
0,22
0,55
0,53
0,40
0,17
0,23
0,57
Aspartic acid
0,94
0,48
0,48
0,64
0,51
0,53
0,42
0,64
Serine
0,65
0,22
1,21
0,24
0,17
0,85·
0,21
0,60
Glutamic acid
1,24
0,()8
0,56
0,81
0,66
0,38
0,56
1,00
Proline
0,64
0,23
0,81
0,28
0,52
0,39
0,27
0,94
Glycine
0,90
0,37
0,48
0,33
0,90
0,78
0,41
1,83
Alanine
0,57
0,21
0,74
0,38
0,40
0,26
0,29
0,72
Crude protein 3,4
1,79
3,44
2,03
3,62
1,31
2,94
1,5
1.25
0,88
0,96
1,55
1,25
2,19
Moisture
Ash
1,05
•
p
is more or less excluded. "Within laboratory" standard deviations are given for all meals except
white fish meal, and whilst the analyses of pilchard and maasbanker meals came from one laboratory,
they were the work of different authors at different times.
However, a feed, even with such a good balance of amino acids as is found in fish meal, will be
of little value if the nutrients are not available to the animal ingesting it. The paper considers four
possible reasons for the failure of an animal to make full use of a dietary amino acid, even though it
is the one limiting protein quality.
I.
In the course of digestion, proteins are hydrolised by digestive enzymes to their constituent
amino acids. The free amino acids are absorbed from the digestive tract and passed to the liver
via the bloodstream. Some proteins, due to their chemical structure, are resistant to the
digestive process. Heat damaged proteins are also more slowly digested. Clearly, an amino
acid which is not digested is also unavailable.
2.
All the free amino acids must be present simultaneously at the site of protein synthesis. If
amino acids are digested and absorbed from the intestinal tract at different rates, so that the
optimum ratio of amino acids at the site of protein synthesis is not maintained, the absorbed
amino acid will be utilised with impaired efficiency. In practice, however, with animals fed
ad libitum, proteins in various stages of digestion will always be present in the digestive tract, and
it seems. unlikely that any differential rate of digestion of the proteins from a single meal will
result in differential availability of amino acids at the site of protein synthesis.
3.
It is not sufficient for amino acids to be present simultaneously at the site of protein synthesis.
They must be present in proportions not too far different from those finally required in the
synthesized protein. Excess of certain amino acids, by creating an imbalance, prevents the
optimum utilisation of other amino acids. For example, high levels of lysine in the diets of
chicks are known to increase the requirement for arginine. Again, amino acid imbalance is
unlikely to be important in practical diets which contain a mixture of proteins from various
feedstuffs, but imbalance effects may be important in laboratory procedures used to determine
protein quality and available amino acids.
4.
Amino acids may be present in foods in some combined form so that they are unable to partake
in metabolic reactions, although digested and absorbed at a normal rate. Such amino acids may
be released by acid hydrolysis and be included in the total amino acid value by most present-day
analytical techniques. For example, lysine is known to react with carbonyl groups of reducing
sugars and of oxidised lipids, thus decreasing its availability, but nevertheless it is analysed by
ion exchange chromatography.
In recent years a great deal of experimental work has been carried out in order to determine the
availability of amino acids in feedstuffs. Combs 2 in 1968 reviewed much of the data and produced
feedstuffs analysis tables in which the amino acid data had been modified by what he described as
an availability factor. Soyabean meal and com were given an arbitrary value of 100. Other feed
ingredients were expressed relative to this figure. Fish meal was given an availability figure of 90,
together with meat meal and meat and bone meal. Dr. Miller has reviewed the various methods that
have been used to estimate this availability factor and reassessed the situation in the light of more
recent data.
4
-.
There are three basic methods for estimating the availability of amino acids - biological
procedures using live animals, microbiological procedures and chemical methods. Assessing the
practical validity of the results of these methods is not an easy task, for in some cases meals of
extreme quality -good and bad - are selected for experimental purposes and these, therefore, do
not reflect the quality of meals available commerciallr. Furthermore, some of the older references
reflect the quality of the .meal at the time of the experiments, but improvements in feed processing
techniques since that time relegate these results to' mere historical significance. Also, "between
hiboratory" variation in the data is high and can be misleading.. Finally, the methods themselves
are by no means established, and currently there is a great deal of work being undertaken to examine
the validity of the various techniques, attempting to correlate results of biological tests with those
of microbiological and chemical tests.
Accepting these difficulties, Dr.Miller has reviewed the
literature of the past 10 years, and, wherever possible, compared the mean availability figures of
fish meal with those of soyabean meal and meat meal.
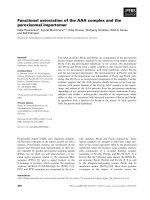
Available lysine, methionine and tryptophan values determined by biological procedures are
summarised in table 3 for fish meal, meat meals and soyabean meals. Where authors have given the
total amino acid content for individual meals, the percentage availability has been calculated. Where
no total values were reported, mean values given in table 1, or by F.A.O. 3 were used to calculate
availability. Unweighted mean values for percentage availability for lysine, methionine and tryptophan are respectively 93,97,103 for fish meals; 86,75,77 for meat meals; 90,101,103 for
soyabean meals. Owing to the great variability between results from different bio-assay procedures,
little weight can be given to the individual values. However, the indication from the mean values is
that fISh meals and soyabean meals have a comparable high amino acid availability, whilst meat
meals have a lower amino acid availability.
The value of a protein when fed as the sole source of nitrogen depends upon the available level
of the limiting amino acid. Supplementation studies have shown the sulphur amino acids to be
limiting in both fish meal and soyabean meal when fed as the sole protein tq rats, and, therefore, the
net protein utilisation (N.P.U.) of fish meals and soyabean meals should be a measure of available
methionine-plus-eystine. The results of 28 N.P.U. carcass experiments were averaged and compared
with calculated N.P.U. values based on the total content of methionine-plus-eystine in both fish
meal and soyabean meal. The percentage by which the experimentally determined N.P.U. values
were smaller than the calculated values gave a measure of the availability of the sulphur containing
amino acids. The results of this excerciseconfirmed the equal availability of the sulphur amino acids
in fISh meal and soyabean meal.
The same conclusion can be drawn from the results of the large number of published "biological
vfllue" experiments with these two protein sources. The results are summarised in Table 4 where it
is seen that the N.P.U. value is approximately 25% greater for the protein of fish meal than of soyabean meal - this is, of course, to be explained by the higher content in fish protein of the two
sulphur-eontaining amino acids.
TABLE 4
Mean Values (with their standard errors) for % Nitrogen Digestibility,
Biological Value, and Net Protein Utilisation (N.P.U.) of Fish Meal and Soyabean Meal
N Digestibility (TD)
Biological Value (BV)
N.P.U. (BV x TD)
Fish Meal
91,1 ± 0,51 (51) •
80,4 ± 1,06 (37)
73,9 ± 1,18 (35)
Soyabeu Meal
86,0 ± 1,56 (15)
67,5 ± 2,15 (14)
59,3 ± 2,16 (14)
• Number of samples for which values are reported.
5
AVAILABLE AMINO ACIDS DETERMINED BY BIOASSAY IN F1SHMEALS, MEAT MEALS AND SOYABEAN MEALS
Animal
Dose R.sponlC
Mt
t
e arne .rs
Lysine
Methionine
As Y "
sa,
Conditions
Total
(II 16.N)
Available
(J/16I!N)
Tryptophan
A
"'-
v
Availability
(%)
V
Total
(J/16l1 N)
Available
(g/16gN)
Availability
(%) .
_
--
...
Total
(lI/16I!N)
Available
(g/16gN)
Availabillty
1,1
1,3
118
1,15(4)
0,76(4)
-
1,4
[117]
0,8
1,0
125
0,9
1,1
122
-
0,64
[68]
(%)
1. HERRING MEALS
Chick
Chick
Chick
Chick
Chick
Chick
Chick
1
2
2
7,5
7,7
7,3
8,7
-
6,8
97
113
2,6
2,7
104
-
3,1
3,1
100
2,6(4)
3,3(12)
3,4(8)
[91]
118(12)
113(8)
C
8
A
D
A
8
8
7,6(12)
7,9(9)
2
2
4
4
C
8
8
8
8
1
1
1
4
C
C
C
8
2
3
A
D
D
-
6,4
[93]
2
A
-
6,8
3
D
)-
6,4
3
2
4
4
-
[88]
-
-
7,2(12)
7,8(9)
95(12)
100(9)
2,8(12)
3,0(8)
7,6
6,7
7,8(31)
7,8(8)
6,8
8,7
4,3
7,0(31)
7,9(8)
[88]
114
64
89(31)
101(8)
3,0(14)
3,0(5)
3,0(14)
3,2(5)
101(14)
104(5)
9,6
7,6.
7,2
7,6(19)
6,1
7,8
6,6
7,3(19)
64
103
92
97(19)
3,0
2,3
2,6
2,8(14)
2,2
2,4
2,3
3,4(14)
73
104
88
120(14)
2,7
2,7
2,5
2,9
93
107
[99]
-
2,4
[92]
[80]
-
_
)_
66
2. ANCHOVY MEALS
C1'
Chick
Chick
Chick
Chick
Chick
3. MENHADEN MEALS
Chick
Chick
Chick
Chick
1
-
-
-
-
4. U.K. WlUTE FISH
MEAL
Chick
Chick
Chick
Rat (Lysine)
}
Chick (Methionine)
Chick (Tryptophan)
2
-
-
S. S. AFRICAN
PILCHARD MEAL
Chick
60_"2
6. TUNA MEAL
..... _
•
6. TUNA MEAL
Chick
Chick
C
B
)7
7,4(7)
5,2
7,3(7)
91
99(7)
1,9
2,8(5)
3,3{J)
c
7,6
7,2
95
2,9
1
C
5,3
5,5
104
2
A
A
1,4
1,2
1,2
1,8
1,0
2,0
3,4(3)
[65]
1
4
2,4
»26
118(5)
0,5
0,6
120
2,6
90
1,0
0,9
90
1,9
0,8
0,9
1,24
0,56
0,93
136
67
75
68
56
47
0,8
0,5
62
1,08(6)
(77]
0,63(2)
0,61(2)
97(2)
0,66
0,48
73
1,26
1,53
121
1,5
1,6
107
7. ROSEFISH MEAL
Chick·
8. MEAT MEALS
Chick
Chick
Chick
Chick
Chick
Chick
Chick
Chick
Rat (Lysine)
}
Chick (Methionine)
Chick (Tryptophan)
Chick
2
5
5
5
3
2
A
A
A
D
A
2
A
4,2
[80]
0,94
[67]
4
B
5,0(4)
[95]
1,2(4)
[86]
6
6
A
A
C
1,4
1,35
1,1
1,6
80
118
1,8(3)
1,9(3)
1,4(10)
105
[100]
9. SOYABEAN MEALS
-.)
Rat
Rat
Chick
Chick
Chick
Chick
Chick
1
3
5
4
4
6,3
D
6,7
3,3(3)
106
[54]
6,3(13)
6,5
[103]
98
A
B
E
6,6
1,25
[81 ]
Number of samples.
Calculated assuming total lysine, methionine and tryptophan of meat m·eal 5,25, 1,4, 0,88 and of soyabean meal 6,1, 1,4, 1,54 (FAO, 1969).
meals taken from Table 1.
Dose-response metameters
I. Assumed amino acid requirement; weight gain.
2. % amino acid supplement; food conversion efficiency.
3. Logarithm % amino supplement; gN retained/gN ingested.
Assay Conditions
A. Test protein added at expense of carbohydrate; crude protein and amino acid
balance not constant.
B. Test protein added at expense of protein; crude protein constant, amino acid
balance not constant.
C. Crude protein constant,
4. g. available amino acid eaten; weight gain.
Total value for fish
amino acid balance of te.,t and positive control
similar.
5. Logarithm % amino acid supplement; food conversion efficiency.
D. Test protein added at expense of identical amino acids; crude protein and amino
acid balance constant.
6. % amino acid supplement; weight gain.
E. Test protein added to crystalline amino acid basal; crude protein and amino
acid balance not constant.
Recent collaborative studi~s in the U.K. on microbiological methods for estimating available
amino acids have shown considerable variability in results, making the confidence limits on the tests
too widt1 for the values to be of use in discriminating between commercial fish meals. Consequently,
the values obtained for various protein concentrates by these methods have not been reviewed.
Probably,the mo~t widely reported chemical test for measuring the availability of amino acids
~ the cllemical estim':ition o(,4lvailable lysine with the reagent, fluorodinitrobenzene (FONB). The
hypothetts that only lysine molecules with reactive €-NH 2 groups are nutritionally available is the
basis ofthis'chemical methbd. A number of published papers have shown a good correlation between
FDNB-available lysine values for fish meal and the biological availability determined by the gross
protein value (G.P.V.) procedure. However, there are other reports, particularly with commercial
fish meals, which do not demonstrate a significant correlation between G.P.V. or other biological
assays and FDNB-available lysine, but in these reports the range of values obtained by feeding experiments is quite smal\. It is possible that such results can be explained, not only by the inaccuracy
of the chemical procedure, but also by the variability and non-specificity of the biological tests
resulting in a failure to detect slight changes in the biological availability of lysine. In spite of the
uncertainty of the significance of the FDNB-available lysine test, some of the most recently reported
values for fish meals are given in Table 5. Part of the variation in these values can be attributed to
differences in analytical techniques in various laboratories, but sufficient data are available from
"within laboratories" to suggest a coefficient of variation within each type of meal of about 9%.
Incomplete digestion is only one of four possible causes of unavailability. However, it is
likely to be the most important cause. Certainly, availability cannot be any better than the
digestibility. Values for amino acid digestibility, therefore, set an upper limit to possible availability
figures. Amino acid digestibility is determined by analysing the food and the faeces for amino
acids. Amino acids measured in the faeces have to be corrected for metabolic contributions (e.g.
digestive enzymes) in order to calculate "true digestibility". The determination of the metabolic
contribution may be done by feeding a nitrogen-free diet, or by feeding a low level of egg protein,
which is assumed to be completely digested, or by regression analysis of amino acid excretion
against amino acid intake. A more important source of error is brought about by the activities
of bacteria in the intestinal tract, which may ferment undigested feed proteins with the liberation of
ammonia and the synthesis of bacterial proteins and nucleic acids. Thus, there are less amino acid
residues in the faeces of normal animals than there would be with germ-free animals, and consequently
the amino acid digestibility values are greater with the former. Therefore, digestibility values obtained
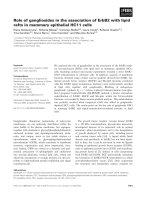
with animals supporting a normal bacterial flora must be regarded as maximal values. Estimates of
"true digestibility" of amino acids obtained with rats or with birds, colostomised to facilitate separate
collection of faeces, are given in table 6 in which the data suggest that the amino acids of fish meal
are 91 % digestible. This is the same as the estimate of digestibility for the amino acids of soyabean
meal, and better than the estimate of 71 % for the amino acids of meat and bone meal. The bioassays indicate that values for the percent availability of amino acids are similar to those for
digestibility; this suggests that indigestibility is the major, if not the only, cause of incomplete
availability.
The evidence does not support the suggestion of Combs that the amino acids of normal commercial fish meals are 10% less available than those of soyabean meal. Rather, the evidence indicates
that there is no difference in availability of amino acids between fish meal and soyabean meal;
furthermore, fish meal protein contains a higher content of lysine and sulphur-amino acids than
soyabean protein~ The evidence also indicates that the amino acids In fish meal are more available
than those in meat meal.
8
)
TABLE 5
•
THE FDNB-AVAILABLE LYSINE CONTENT (g/16gN) OF FISH MEALS
Number
of
Samples
Mean
Standard
Deviation
Herring Denmark
32
7,4
-
Herring Norway
15
6,2
Herring Iceland
23
6,8
6
6,5
Herring U.K.
11
7,1
Herring Canada
21
6,4
Herring Norway
12
Herring Canada
Herring Canada
Meal
Range
References
5,6~-8,1
Pritchard et aI.(1964). J.ScLFd Agric. 15,690
5,5-7,0
Pritchard et al. (1964). J.ScLFd Agric. 15, 690
-
6,0-7,7
Pritchard et aI.(1964). J.ScLFd Agric. 15,690
-
6,1-7,2
Pritchard et aI.(1964). J.ScLFd Agric. 15,690
6,6-7,7
Pritchard et aI.(1964). J.ScLFd Agric. 15,690
± 0,37
5,9-7,5
March et aI.( 1966). J.Fish.Res.Bd Can. 23, 395
6,8
± 0,49
5,
8-~ 7,4
Combs & Kifer (1970). Personal communication
9
6,4
± 1,06
4,4-7,3
Combs & Kifer (1970). Personal communication
7
7,8
± 0,50
7,3-8,6
Power et al. (1969). Fish.Res.Bd Can.Technical Rept.No.114
Anchovy
25
6,4
4,7-7,3
Pritchard et al. (1964). J.ScLFd Agric. 15,690
Anchovy
5
6,3
± 0,55
5,8-6,9
6,2
± 0,26
5,8-6,7
6,85
± 0,71
5,3-7,8
March et al. (1966). J.Fish.Res.Bd Can. 23, 395
Bruggemann
..
. I Tiererniihr
et a/ .(1969) .Tlerp h YSIO.
F uttermlt
. t'e.
Ik 25 , 128 .
Combs & Kifer (1970). Personal communication
6,2
± 0,70
5,3-7,1
Combs & Kifer (1970). Personal communication
6,2
5,0-8,3
Pritchard et al. (1964).
J.ScLFd Agric. 15,690
,
7
7,3
6,95--7,6
Amoraal (1964). Rep.Fishg.lnd.Res.Inst.Cape Tn. 18, 73
Fish Meal S.Africa
17
6,9
6,7-7,2
Amoraal (1964). Rep.Fishg.lnd.Res.Inst.Cape Tn. 18, 73
Fish Meal S.W. Africa
17
7,0
6,8-7,4
Amoraal (1964). Rep.Fishg.Ind.Res.Inst.Cape Tn. 18, 73
Fish Meal S. Africa
52
7,1
5,8-7,7
Fish Meal S. Africa
25
7,1
5,1-7,7
Pritchard et al. (1964). J.ScLFd.Agric./5. 690
1
.
Cape Tn.,
Brookes & Atkinson.( 966).Rep.Flshg.lnd.Res.Inst. 20, 62.
Fish Meal S. Africa
8
6,9
6.2 7,6
Reid.( I968).Rep.Fishg.Ind.Res.Inst., Cape Tn., 22, 75.
Fish Meal S. Africa
8
7,1
6,5--7,6
Reid & Marshall (1969). Rep.Fishg.Ind.Res.Inst.,Cape Tn., 23,72
19
6,4
± 0,49
5,0--7,0
Combs & Kifer.( I970). Personal communication
7
5,8
± 0,84
4,8-7,4
Combs & Kifer.(1970). Personal communication
Herring Germany
-
\0
Anchovy,Peru, Chile
Anchovy Peru
31
Anchovy Chile
8
White Fish U.K.
White Fish S. Africa
Menhaden U.S.A.
Tuna U.S.A.
. .d
-
-
In the long term, total amino acid data should be reduced by an availability factor. However,
this should only be done when the appropriate factors are known for all feed ingredients. It
'·vould be wrong to propose adjusted values for fish meals if similar adjustments were not made for
all other feedstuffs, since it is the relative values of one feedstuff to another that really matter.
Also, where nutrient requirements for livestock have been calculated from the total amino acid
levels in diets based on practical feeds, the requirement values will also need adjustment.
References
I.
F.A.O. (1970), Available Amino Acid Content of Fish Meals. F.A.O. Fish. Rep., (92).
2.
Combs G.F. (1968). Proc. Maryland Nutrition Conference for Feed Manufacturers. P.86.
3.
F.A.O. (1970). Amino Acid Content of Food and Biological Data on Proteins.
F.A.O. Nutritional Studies, No.24.
-
-
10
)
)
TABLE 6
TRUE DIGESTIBILITY (%) OF AMINO ACIDS
U.K.
White fish meal
Meat and
Bone meal
Soyabean
meal
Soyabean
meal
Soyabean
meal
Animal
Colostomised
Hen
Colostomised
Hen
Colostomised
Hen
Rat
Rat
Lysine
93,5
73,4
90,9
87,2
Methionine
91,7
73,6
87,6
Cystine
83,0
58,7
94,9
Histidine
95,5
73,2
94,2
Arginine
93,3
77,7
93,5
Threonine
94,0
68,7
91,6
Valine
92,9
74,9
91,9
Isoleucine
93,2
75,2
91,3
Leucine
93,5
75,4
90,8
Phenylalanine
92,9
77,7
92,7
Tyrosine
95,4
76,8
92,8
Aspartic acid
86,1
52,4
91,0
Serine
91,8
67,5
92,7
Glutamic acid
90,9
70,7
92,9
Glycine
87,3
70,9
91,4
Alanine
87,8
70,7
87,4
Tryptophan
Proline
91,-I
-
rlW!JDJ!JQ f&IiJ8J _
_
91 The Maltings. Sta1\Stead Abbotts.
Nr. Ware. Berts. SOl2 SBG
Telephone: (0920) 870333