The pituitary gland of the european eel reveals massive expression of genes involved in the melanocortin system
Bạn đang xem bản rút gọn của tài liệu. Xem và tải ngay bản đầy đủ của tài liệu tại đây (471.9 KB, 13 trang )
5/2/2018
The Pituitary Gland of the European Eel Reveals Massive Expression of Genes Involved in the Melanocortin System
The Pituitary Gland of the European Eel Reveals Massive
Expression of Genes Involved in the Melanocortin System
Eirill AgerWick, Ron P. Dirks, Erik Burgerhout, Rasoul NourizadehLillabadi, Daniëlle L. de Wijze, Herman P. Spaink,
Guido E. E. J. M. van den Thillart, Katsumi Tsukamoto, Sylvie Dufour, FinnArne Weltzien, Christiaan V. Henkel
Published: October 10, 2013
/>
Abstract
Hormones secreted from the pituitary gland regulate important processes such as development, growth and metabolism,
reproduction, water balance, and body pigmentation. Synthesis and secretion of pituitary hormones are regulated by different
factors from the hypothalamus, but also through feedback mechanisms from peripheral organs, and from the pituitary itself. In the
European eel extensive attention has been directed towards understanding the different components of the brainpituitarygonad
axis, but little is known about the regulation of upstream processes in the pituitary gland. In order to gain a broader mechanistic
understanding of the eel pituitary gland, we have performed RNAseq transcriptome profiling of the pituitary of prepubertal female
silver eels. RNAseq reads generated on the Illumina platform were mapped to the recently assembled European eel genome. The
most abundant transcript in the eel pituitary codes for proopiomelanocortin, the precursor for hormones of the melanocortin
system. Several genes putatively involved in downstream processing of proopiomelanocortin were manually annotated, and were
found to be highly expressed, both by RNAseq and by qPCR. The melanocortin system, which affects skin color, energy
homeostasis and in other teleosts interacts with the reproductive system, has so far received limited attention in eels. However,
since up to one third of the silver eel pituitary’s mRNA pool encodes proopiomelanocortin, our results indicate that control of the
melanocortin system is a major function of the eel pituitary.
Citation: AgerWick E, Dirks RP, Burgerhout E, NourizadehLillabadi R, de Wijze DL, Spaink HP, et al. (2013) The Pituitary
Gland of the European Eel Reveals Massive Expression of Genes Involved in the Melanocortin System. PLoS ONE 8(10):
e77396. />Editor: Juan Fuentes, Centre of Marine Sciences & University of Algarve, Portugal
Received: April 3, 2013; Accepted: September 2, 2013; Published: October 10, 2013
Copyright: © 2013 AgerWick et al. This is an openaccess article distributed under the terms of the Creative Commons
Attribution License, which permits unrestricted use, distribution, and reproduction in any medium, provided the original author
and source are credited.
Funding: This work was supported by the Norwegian School of Veterinary Science and the Research Council of Norway
(184851), by Centre National de la Recherche Scientifique and L’Agence Nationale de la Recherche (08BLAN0173), and by
private resources from ZFscreens B.V., Leiden University and The University of Tokyo. The funders had no role in study
design, data collection and analysis, decision to publish, or preparation of the manuscript.
Competing interests: We have the following interests. HPS and GEEJMvdT are founders and shareholders of ZFscreens
B.V. CVH, RPD, and DLdW are (or have been) employees of ZFscreens B.V. ZFscreens B.V. supported this study. Passie
voor Vis BV and NijvisHolding BV provided farmed eels. There are no patents, products in development or marketed
products to declare. This does not alter our adherence to all the PLOS ONE policies on sharing data and materials, as
detailed online in the guide for authors.
Introduction
The European eel (Anguilla anguilla) has a long and complex life cycle. It is now listed as a critically endangered species [1],
leading to an urgent need to learn more about its biology and reproduction. Spawning of the European eel occurs in unknown areas
of the Sargasso Sea [2]. Larvae drift to the European coasts following oceanic currents, where they metamorphose into glass eels
and migrate into continental habitats. They can stay in brackish water or in rivers for years as juvenile yellow eels before they
develop into prepubertal silver eels [3]. Silver eels are still sexually immature when they leave the continental habitats and migrate
back to the sea. They remain blocked at the prepubertal stage as long as the reproductive migration is prevented [4]. Therefore,
maturation needs to occur during the oceanic migration or at their spawning grounds [5]. The prepubertal silver eels are the last
known stage of the eel life cycle in natural conditions. Although spawning European eels have never been caught in the wild, the
spawning site of the Japanese eel (Anguilla japonica) was recently discovered close to the West Mariana Ridge [6]. Adults and
newly hatched larvae were found in close proximity to the first collection of Japanese eel eggs.
/>
1/13
5/2/2018
The Pituitary Gland of the European Eel Reveals Massive Expression of Genes Involved in the Melanocortin System
Attempts to promote spontaneous maturation, gametogenesis and spawning of eels in aquaculture have so far been unsuccessful.
In order to accomplish successful artificial reproduction, there is a need for development of strategies to control the secretion of
hormones from the pituitary gland. To achieve this goal the endocrinological changes in the pituitary should be studied during
maturation both at the transcriptome and proteome level. The pituitary comprises the neurohypophysis (posterior pituitary) and the
adenohypophysis (anterior pituitary), both regulated by the hypothalamus. The adenohypophysis of teleosts is a major endocrine
organ and is organized into different compartments, i.e. rostral and proximal pars distalis and pars intermedia, where different
hormones are produced in their respective cell types [7–9]. The two gonadotropins, folliclestimulating hormone and luteinizing
hormone, directly control gonadal development. Other pituitary hormones, such as growth hormone and thyroidstimulating
hormone, regulate other physiological systems, but also play a role in reproduction. Adrenocorticotropic hormone, α and β
melanocyte stimulating hormone and βendorphin derive from a common precursor hormone, proopiomelanocortin. These
hormones are important components of the melanocortin system, which is involved in the regulation of different physiological
processes, and, in teleosts, possibly also in reproduction [10].
In order to get closer to understanding important molecular mechanisms at work in the European eel pituitary we have utilized high
throughput RNA sequencing (RNAseq) to profile the global gene expression in the pituitary of prepubertal silver eels. RNAseq
provides the opportunity to study the transcriptome in a specific organism, tissue or cell type by sequencing millions of short
fragments simultaneously. The number of reads produced is a function of the abundance of a transcript, and thus the read density
is used to quantify gene expression [11–13]. In addition to providing information about gene expression levels, RNAseq also
enables the discovery of new genes and transcripts and can reveal alternative splice isoforms [11,12,14].
The draft genomes of the European and the Japanese eel have recently been published [15,16], enabling for the first time reliable
gene expression profiling using RNAseq. However, curated gene annotations and expression data are still scarce for eels, and
therefore the included gene predictions for the eel genome are primarily based on generic gene models [15–17]. In this study, we
have therefore used RNAseq evidence to manually improve the annotations of the most abundantly expressed genes in the eel
pituitary.
Materials and Methods
Animals and experimental design
Female European eels (Anguilla anguilla) obtained in the Netherlands were used in this study. Four prepubertal eels (one wild and
three farmed) in the silvering transition period were sampled for RNAseq. To get closer to a complete picture of the European eel
transcriptome we included one sample from two other developmental stages: a farmed immature yellow eel and a wild artificially
matured eel. For qPCR validation of key findings we used pituitary material from five farmed silver eels, of which three were the
same samples used for RNAseq. Permission for capturing eels during the migration season was obtained from the Netherlands'
Ministry of Agriculture and Fisheries. Experiments were approved by the animal ethical commission of Leiden University (DEC
#08112 and #11093). The farmed animals (one yellow and three silver eels, samples 2–4) were transported from the farms to the
University (1.5–2 h) in buckets with some water, and the pituitaries were sampled immediately upon arrival. The wild silver eel
(sample 1) was kept for one week at the University in a seawater recirculation system prior to sampling. The artificially matured eel
received weekly injections of salmon pituitary extract (20 mg) for 17 weeks and ovulation was induced by injection with 17, 20β
dihydroxy4pregnen3one (DHP) (2 mg kg1) as recently published [18]. The matured eel was sampled just after ovulation. As an
estimate of the reproductive status the gonadosomatic index (GSI) was calculated. Calculation of silver index, eye index and other
morphological and physiological measurements were performed as previously described [19,20], and the detailed information about
the animals is given in table 1. Prior to dissection of the pituitary gland, eels were euthanized using an overdose of anesthetic
(clove oil), followed by decapitation. Eel pituitaries were sampled and stored in RNAlater (Ambion) at 80 °C until RNA extraction.
Silver eel
1
Sample
Silver eel 2
Silver eel 3
Silver eel 4
Silver eel 5
Silver eel 6
Mature
eel
Yellow eel
RNAseq
yes
yes
yes
yes
no
no
yes
yes
qPCR
no
yes
yes
yes
yes
yes
no
no
Sampling date
07.12.2008
18.05.2011
18.05.2011
18.05.2011
18.05.2011
18.05.2011
27.08.2010
26.05.2010
Sampling
location
Lake
Grevelingen
Passie voor Vis
BV
Passie voor Vis
BV
Passie voor Vis
BV
Passie voor Vis
BV
Passie voor Vis
BV
Nijvis Holding BV
Lake Veerse
Country
The
Netherlands
The Netherlands
The Netherlands
The Netherlands
The Netherlands
The Netherlands
The Netherlands
The
Netherlands
Origin
Wild (seawater)
Farmed
(freshwater)
Farmed
(freshwater)
Farmed
(freshwater)
Farmed
(freshwater)
Farmed
(freshwater)
Farmed
(freshwater)
Wild (seawater)
Sex
Female
Female
Female
Female
Female
Female
Female
Female
BW
1317.3
719.2
872.7
686.6
874.3
880.8
272.0
573.7
BL
88.4
67.2
69.9
70.2
72.6
71.6
50.2
77.9
CF
0.22
0.24
0.26
0.20
0.23
0.24
0.20
0.12
EdH
10.8
9.0
10.1
8.8
8.0
9.9
6.4
11.8
EdV
11.0
8.7
9.7
8.7
8.1
9.6
6.1
10.5
EI
10.6
9.2
11.0
8.6
7.0
10.4
6.1
12.5
PFL
42.4
24.3
24.4
27.7
27.8
28.4
17.5
35.6
SI
4
3
4
3
3
4
2
5
LW
13.2
4.1
8.0
4.2
8.1
8.0
4.2
9.9
HSI
1.00
0.57
0.92
0.61
0.93
0.91
1.54
1.73
GW
28.4
6.1
10.6
4.7
8.5
10.2
1.8
95.0
GSI
2.1
0.8
1.2
0.7
1.0
1.2
0.7
16.6
/>
2/13
5/2/2018
The Pituitary Gland of the European Eel Reveals Massive Expression of Genes Involved in the Melanocortin System
Table 1. Sample information.
BW = body weight (g), BL = body length (cm), CF = condition factor, EdH = eye diameter horizontal (mm), EdV = eye diameter vertical (mm), EI = eye index (according to [19]), PFL = pectoral fin length
(mm), SI = silver index (according to [20]), LW = liver weight (g), HSI= hepatosomatic index, GW = gonad weight (g), GSI = gonadosomatic index
RNA extraction, Illumina library preparation and sequencing
Total RNA was isolated using the Qiagen miRNeasy kit according to the manufacturer’s instructions (Qiagen). RNA integrity was
assessed by Agilent Bioanalyzer 2100 on a total RNA Nano series II chip (Agilent). All RNAseq libraries were prepared with the
Illumina mRNAseq Sample Preparation Kit from 10 µg total RNA, according to the manufacturer’s instructions (Illumina Inc.). RNA
seq paired end libraries for silver eel 1, yellow eel, and mature eel were sequenced with a read length of 2×55 nucleotides on an
Illumina GAIIx instrument, while the other silver eel samples (silver eel 2, 3 and 4) were sequenced with a read length of 2×51
nucleotides on a HiSeq2000 according to the manufacturer’s protocol. The Illumina pipeline was utilized for image analysis and
base calling.
Quantitative PCR
Quantitative PCR (qPCR) was carried out on a LightCycler 480 RealTime PCR system (Roche, Mannheim, Germany), using the
LightCycler 480 Master with SYBR Green (Roche). cDNA was prepared from 1 µg of DNase treated total RNA using Superscript III
reverse transcriptase (Invitrogen) and oligo(dT) primers according to product specifications. To avoid amplification of contaminating
genomic DNA, the primers were designed to span exonexon boundaries, such that part of the primer hybridizes to the 3′ end of
one exon and the rest of the primer hybridizes to the 5′ end of the adjacent exon. A standard dilution curve was set up for each
primer pair and the pair that showed the best efficiency was chosen. These primer sequences are given in table S1. Acidic
ribosomal phosphoprotein P0 (arp) shows stable expression during different experimental treatments in eel and was used as a
reference gene to normalize the expression analysis [21], using an efficiencycorrected relative quantification method [22]. Each
sample was analyzed in duplicate and comprised 5 µl mastermix, 2 µl primer mix (5 µM of each or forward and reverse), and 3 µl of
each 10× diluted cDNA sample in a total volume of 10 µl. The cycling parameters were 10 min preincubation at 95 °C, followed by
42 cycles of amplification at 95 °C for 10 sec, 60 °C for 10 sec and 72 °C for 6 sec, followed by a melting curve analysis from 65 °C
to 95 °C. A no template control was included on every plate to rule out nonspecific contamination, while the melting curve analysis
was included to verify that a single specific product was measured in each run.
Data analysis
Reads were aligned to the draft genome of European eel [15] using TopHat (version 2.0.5) [23]. The resulting files were filtered
using SAMtools (version 0.1.18) [24] to exclude secondary alignment of reads. Aligned fragments per predicted gene were counted
from SAM alignment files using the Python package HTSeq (version 0.5.3p9) [25]. We only considered gene predictions which
have been provisionally functionally annotated by Blast2GO (i.e. known eel genes or gene predictions with homologs in other
species). In order to make comparisons across samples possible, these fragment counts need to be corrected for the total amount
of sequencing performed for each sample. As a correction scaling factor, we employed library size estimates determined using the
R/Bioconductor (release 2.11) package DESeq [26]. Read counts were normalized by dividing the raw counts obtained from HTSeq
by its scale factor and by transcript length in kilobases. Detailed read coverage for individual genes was extracted from the TopHat
alignments using SAMtools. New alignments were generated for reannotated genes, which were then quantified and normalized
as before, using the scaling factors determined for the initial alignments. For each Gene Ontology category, total expression was
calculated by summing the normalized expression of all genes annotated with that GO term (based on Blast2GO annotations, [27]).
Results
Gene expression profiling
RNAseq reads were mapped to the European eel genome [15] using TopHat [23]. From the total number of reads that was
obtained from the silver eel samples, 90–97% successfully aligned, yielding expression values for 33649 genes with provisional
functional annotations. Details about the number of reads and mapping for all samples are given in table S2. Gene expression
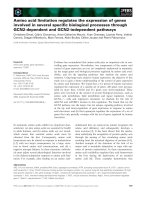
values for the different silver eel samples are plotted against each other in Figure 1A, and correlate well across all four samples
(Spearman rank correlation 0.87–0.93). One particular gene, pomc, encoding proopiomelanocortin, the precursor for the peptide
hormones of the melanocortin system, stands out from the overall expression in all samples as it is expressed at least one order of
magnitude higher than any other gene. Further highly expressed genes predominantly encode other hormones and ribosomal
proteins (Figure 1B). Figure 1C shows the top genes by expression annotated with the Gene Ontology category ‘hormone activity’
(GO:0005184). All silver eel gene expression values are available as table S3. Several of the genes found to be highly expressed
were manually annotated and their sequences submitted to GenBank (see table S4 for details).
/>
3/13
5/2/2018
The Pituitary Gland of the European Eel Reveals Massive Expression of Genes Involved in the Melanocortin System
Figure 1. Gene expression in silver eels.
(A): Pairwise comparisons of normalized expression values for all genes between the four silver eel samples (for details, see
Materials and methods). The red dot indicates the expression level of proopiomelanocortin. Spearman rank correlations (ρ)
for the different comparisons show a good correspondence between the expression values for the different silver eel samples.
(B): Top 15 expressed genes in silver eel samples, displayed as means of normalized expression ± standard deviations (SD)
on a log scale. (C): Top 15 expressed genes in GO category Molecular Function ‘hormone activity’ (GO:0005184), displayed
as means of normalized expression ± SD on a log scale.
/>Massive expression of pomc
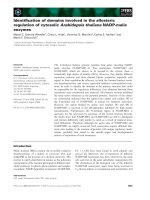
Due to the striking expression of pomc we manually improved the annotation of this gene using the RNAseq alignments and the
gene prediction (Figure 2A). Based on the new annotation we also recalculated the expression values, and these are plotted on top
of the new annotation in Figure 2A. In the silver eels pomc exhibits massive gene expression levels, such that it constitutes up to
30% of the total number of aligned RNAseq reads mapping to the genome (table S2). Comparison between the gene expression
values for the average of the four silver eel samples and yellow eel and mature eel are shown in Figure S1, displaying that the
pomc gene also exhibits high expression in the two other stages. The amino acid sequences of pomc between different Anguilla
species were compared (Figure 2B), where A. anguilla and A. japonica display a greater similarity than A. anguilla and A. rostrata.
This is unexpected, given the evolutionary relationships between Anguilla species [28]. Figure 2C illustrates the posttranslational
processing of the prohormone Pomc to its bioactive hormone components, including adrenocorticotropic hormone (ACTH), β
lipotropic hormone (βLPH), αmelanocyte stimulating hormone (αMSH), corticotropin intermediate peptide (CLIP), βendorphin (β
END) and βmelanocyte stimulating hormone (βMSH). The amino acid sequences of these six bioactive hormones are 100%
identical in all three Anguilla species (Figure 2B).
/>
4/13
5/2/2018
The Pituitary Gland of the European Eel Reveals Massive Expression of Genes Involved in the Melanocortin System
Figure 2. Massive expression of proopiomelanocortin in silver eels.
(A): The gene encoding proopiomelanocortin (pomc) was manually annotated based on coverage by RNAseq reads. pomc
is located on scaffold 861 of the European eel genome assembly, and contains three exons. The first exon contains the 5′
UTR (white), the second exon contains the last part of the 5′ UTR and the coding sequence (black), while the third exon
contains coding sequence and the 3′ UTR (white). The plot indicates the total local read coverage scaled by the normalization
factor for each sample and each nucleotide position along the gene. Details about the annotation are given in table S4. A
substantial fraction (15–30%) of the total number of aligned reads maps to the pomc gene (see table S2 for details). (B):
Amino acid sequence comparison of pomc between different Anguilla species. The comparison shows greater similarity
between A. anguilla (JX441983) and A. japonica (AY158010) (99.1%) than between A. anguilla and A. rostrata (AF194969)
(92.3%). (C): Posttranslational processing of the prohormone Pomc to its bioactive hormone components. In the
corticotropes situated in the rostral pars distalis prohormone convertase 1 (PC1) is known to cleave the prohormone to
generate adrenocorticotropic hormone (ACTH) and βlipotropic hormone (βLPH), while in the melanotropes in the pars
intermedia these hormones are subsequently cleaved by prohormone convertase 2 (PC2) to generate, respectively, α
melanocyte stimulating hormone (αMSH) and corticotropin intermediate peptide (CLIP), and βendorphin (βEND) and γ
lipotropin (γLPH, further processed into βMSH) [42,43,65]. The γMSH sequence that derives from the Nterminal part of
pomc in higher vertebrates is absent from the pomc genes of teleosts [66]. The granin neuroendocrine protein 7b2 (7B2) is an
endogenous inhibitor protein that is required for active PC2 enzyme. The generation of mature αMSH is catalysed by
carboxypeptidase e (CPE). Figure adapted from [42,67]. The same markings are used for the pomc derived peptides in both
panel B and C: signal sequence (purple), αMSH (yellow), CLIP (pink), βMSH (green) and βEND (blue).
/>Gene Ontology categorization
In order to investigate the possible involvement of other genes in downstream processing of Pomc, we attempted to look for
overrepresentation of certain classes of genes using gene ontology (GO) categories. Gene expression values were summarized for
each GO category (based on Blast2GO annotations [27]) of the provisional annotation of the European eel genome [15] (Figure
S2). pomc is included in all of the top 15 highly expressed categories, stressing the dominance of this gene in the transcriptome.
Genes that belong to the GOcategory ‘peptide hormone processing’ (GO:00016486) were investigated to look for potential
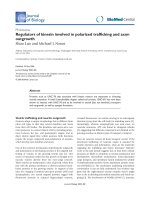
important players of downstream processing of prohormones (like Pomc) into bioactive peptide hormones. This analysis revealed
high expression of different players involved in the posttranslational processing of Pomc [29–32], including carboxypeptidase e,
prohormone convertase 2 and neuroendocrine protein 7b2 (Figure 3). Note that the different convertases and catalysts involved in
the processing of the prohormone are included in Figure 2C.
Figure 3. Expression of genes in Gene Ontology category ‘peptide hormone processing’.
Expression of genes belonging to the Gene Ontology term ‘peptide hormone processing’ (GO:0016486). The four silver eel
samples are grouped together to the left (silver eel 1–4 from left to right), while the gene expression for the yellow eel and the
mature eel is placed to the right and displays an expression pattern similar to the silver eel samples. Genes involved in the
processing of proopiomelanocortin are highly expressed (red), and include carboxypeptidase e, prohormone convertase 2
and neuroendocrine protein 7b2.
/>
5/13
5/2/2018
The Pituitary Gland of the European Eel Reveals Massive Expression of Genes Involved in the Melanocortin System
/>High expression of Pomcprocessing genes
Due to the high expression of the gene encoding neuroendocrine protein 7b2 (also called secretogranin V), we decided to
investigate if other secretogranins also exhibited high expression. Among the genes of the granin family proteins, known to be
associated with neuroendocrine secretion, secretogranin II and secretogranin III coding genes were found to be highly expressed.
In particular, one secretogranin III paralogue exhibited substantial gene expression levels (approximately 3% of total reads, see
table S2 for details). Based on alignments and gene predictions, the highly expressed genes known to be involved in Pomc
processing were manually annotated and requantified (Figure 4 and table S4). In nearly all cases, the improved annotation
resulted in higher gene expression values (Figure S3). This increase is an effect of both updated gene structure leading to more
reads aligning, and of better UTR definition leading to shorter transcript annotations (see the definition of normalized expression in
Materials and methods). The high expression of pomc and the genes involved in the processing of the prohormone that were found
to exhibit high expression by RNAseq were validated by qPCR (Figure 4), showing a good correlation in relative expression levels
between the two different methods.
Figure 4. Comparison between RNAseq and qPCR experiments of genes involved in the melanocortin system.
Quantitative PCR validation of proopiomelanocortin and other highly expressed genes involved in the processing of the
prohormone found by RNAseq in the silver eel samples: proopiomelanocortin (pomc), prohormone convertase 2 copy 1
(pc2a), prohormone convertase 2 copy 2 (pc2b), secretogranin II copy 1 (scg2a), secretogranin II copy 2 (scg2b),
secretogranin III copy 1(scg3a), secretogranin III copy 2 (scg3b), neuroendocrine protein 7b2 copy 1(7b2a), neuroendocrine
protein 7b2 copy 2 (7b2b) and carboxypeptidase e (cpe). Note that pc2b and scg2a were studied by RNAseq only, and not
investigated by qPCR due to limitations for designing primers from these genes where we only obtained partial sequences.
Primer sequences are given in table S1 and details about the annotation of the genes are provided in table S4. Results are
presented as means ± standard deviations (SD) on log scales for both methods, where the left yaxis represent the re
quantified RNAseq normalized gene expression (n=4) and the right yaxis represent the expression by qPCR (n=5).
/>
Discussion
This study serves as a first exploration of the complete pituitary transcriptome of prepubertal female European silver eel. Using the
draft genome and the RNAseq read coverage we have improved the annotation of the most highly expressed genes expressed in
the eel pituitary.
pomc was found to be by far the most abundant transcript in the European eel pituitary (figures 1 and 4), eclipsing the expression of
all other genes in the pituitary gland (figures 1B, C and figure S2). In teleosts, the pituitary gland consists of multiple hormone
producing cell types, including lactotropes, corticotropes, somatotropes, thyrotropes, two types of gonadotropes, melanotropes and
somatolactotropes [33]; however, the pomc gene is expected to be expressed only in corticotropes and melanotropes. Since the
RNAseq analysis was performed on complete pituitary glands, in some eels the amount of pomc mRNA in these two cell types
may very well exceed 50% of total mRNA content. Alternatively, pomc could be expressed in other cell types as well. It is worth
noting that the very high expression level of pomc observed may also be a consequence of the technology employed. Using RNA
seq, the pomc transcript was determined to be almost five hundredfold more abundant than the transcripts of several
housekeeping genes (e.g. bactin). Until recently, full transcriptome profiling was performed using microarrays, which generally
detect a much more limited range in expression levels (approximately a 1000fold change between ‘low’ and ‘high’ expression
values). If we had used microarrays, we would have been unable to detect the difference in expression level between pomc and a
housekeeping gene like bactin: both transcripts would probably have saturated the available probes, and would have received the
maximum ‘high’ expression value. Strikingly, the top 15 of the GO categories by gene expression all include pomc, again
emphasizing the total dominance of this prohormone in the silver eel pituitary transcriptome with regards to gene expression.
The eels employed in this study were obtained from several different sources (table 1), resulting in a range of external conditions
(salinity, photoperiod, season, animal handling etc.). Nevertheless, all samples show a consistent gene expression profile (Figure 1
and Figure S1). When examined in detail, the expression profile for the pomc gene is similar in all four silver eel samples (Figure
2A). The only silver eel (sample 1) that was not obtained from a farm exhibits the highest expression of pomc, with a slightly
different coverage profile near the 5′ UTR (Figure 2A). We observed the same profile in the (nonreplicated) yellow and mature eel
samples (sequenced at the same time as silver eel 1), suggesting that the biased coverage profile is an artifact of different
sequencing technology generations rather than a biological difference. Because of limited availability of high quality samples from
nonsilver eels, we were unable to study ontogenetic changes in gene expression completely throughout maturation. In addition,
the very high expression of just a single gene can make exact comparisons of RNAseq results for all other genes less robust [34].
However, in the four silver eel replicates, the levels of pomc itself correlate positively with body weight and gonadal development
(GSI) (table 1).
/>
6/13
5/2/2018
The Pituitary Gland of the European Eel Reveals Massive Expression of Genes Involved in the Melanocortin System
The animals could have been stressed by handling, transport, or experimental procedures prior to the pituitary dissection, which
conceivably could affect downstream gene expression results, particularly of pomc. ACTH (corticotropin) produced downstream of
proopiomelanocortin is an important player in the neuroendocrine stress response which activates cells in the interrenal tissue to
produce and release cortisol [35]. However, the abundance of pomc was high for all the samples regardless of the different sources
they came from. Farmed animals are more used to handling than wild animals, which possibly could influence how well they cope
with stress. The transport of these animals (see Materials and methods) may have induced additional stress, although the kinetics
of mRNA synthesis imply that by itself this interval is too brief to result in the levels of pomc expression observed [36]. The silver eel
that was caught in the wild exhibited the highest pomc expression compared to the farmed silver eels, while the artificially matured
eel that received injections every seven days for 17 weeks was the sample that exhibited the lowest pomc expression levels of all
the samples. These observations suggest that it is unlikely that the high abundance of pomc can be explained by induction of stress
during animal handling only. Nevertheless, a previous stressed state (either induced by handling or by biological factors) cannot be
excluded, and the possibility should be kept in mind when interpreting the results. It would be difficult to obtain demonstrably non
stressed eels, which would be needed to create a baseline for a stress marker (i.e. cortisol) that would make it possible to compare
with the levels of other animals. In fact, in the few studies in which cortisol levels were determined in eels, these were found to be
strongly elevated, yet highly variable, in migrating silver eels [37,38].
The activity of the Pomcproducing cells is regulated by expression and cleavage of the precursor protein, posttranslational
processing of cleavage products, and release of the end products (Figure 2C). In mammals posttranslational processing of Pomc
is dependent on the proteolytic cleavage by prohormone convertases (PC1 and PC2; for review see 39), which are most likely also
involved in the processing of fish Pomc [40]. PC1 mediates the initial processing of Pomc into ACTH, βLPH and Nterminal peptide
in the corticotropes of the pituitary rostral pars distalis, while in the melanotropes located in the pituitary pars intermedia, PC2
processes ACTH further into αMSH and corticotropinlike intermediate peptide (CLIP), and converts βLPH into βMSH (processed
via γLPH) and βendorphin [30,41,42]. Carboxypeptidase e (CPE) catalyzes the generation of mature αMSH from ACTH by
trimming the Cterminal, and also works as a sorting receptor of the regulated secretory pathway by binding secretory proteins,
including Pomc [29,43]. In our data, pc1, pc2 and cpe were among the highly expressed genes, with pc2 showing higher
expression than pc1 (Figure 3). The high expression of these genes implies an important role for the processing of Pomc and
emphasizes that the dramatically high expression of pomc is likely to be biologically relevant (Figure 3).
PC2 has a specific endogenous inhibitor called granin neuroendocrine protein 7b2 (7B2), which functions as a chaperone protein
and is required for production of active PC2 enzyme [31,44]. The catalytic activity of 7B2 is regulated by inhibiting PC2 unfolding
and aggregation in the secretory vesicle [32]. 7B2 is a member of the granin family, which includes biologically active peptides that
are responsible for delivery of peptides, hormones, neurotransmitters and growth factors. These proteins are expressed in
endocrine cells and peptidergic neurons and have both constitutive and regulated secretory pathways [45]. Secretogranin II (Scg2)
can be proteolytically processed to generate secretoneurin [46,47]. In goldfish gonadotropes secretoneurin has been shown to
stimulate luteinizing hormone synthesis and release [48]. Scg3 can be cleaved to peptides in secretory vesicles [49]. Scg3 and
CPE have been found to interact and facilitate prohormone sorting within secretory granules [50]. Pomc and Scg3 have been found
to coordinately increase upon stimulation of Xenopus pituitary pars intermedia cells in vivo [51]. In the silver eel pituitary, several
members of the granin family show high expression levels (figures 3 and 4). In contrast to other studied teleosts, the European eel
has likely retained two scg3 paralogues after the teleost specific genome duplication. These differ markedly in expression in the eel
pituitary, indicative of possible subfunction partitioning [52]. One scg3 paralogue exhibits very high expression in the silver eel
pituitary (Figure 4), suggesting an important role for this granin in the secretory pathway in eel.
The biologically active peptide hormones derived from pomc exert a variety of physiological functions in fish, including effects on
stress, vasoregulation, thermoregulation, growth, metabolism, metamorphosis and reproduction (for review see 53). Several studies
have indicated involvement of the melanocortin system in the regulation of energy metabolism and food intake in fish [53–56]. It has
been suggested to control the energy balance by decreasing food intake and enhancing energy costs. αMSH has been shown to
stimulate lipase activity and increase the circulating levels of fatty acids in rainbow trout, while trout with defective αMSH show
increased appetite, enlarged livers and accumulation of fat in the abdominal cavity [57]. Synchronous changes in gonadal
development and morphological characteristics (e.g. skin coloration), have been demonstrated in European and Japanese eel and
are suggested to be hormonally regulated [20,58]. Degeneration of the gut takes place during gonadal maturation in European eel
[59]. Eels have an exceptionally high fat content prior to migration [60], which suggests a role for Pomcderived peptides in fat
metabolism. Adaptation to background color is an important function found to be regulated by αMSH (reviewed in 54), where
regulation of skin pigmentation mediated by αMSH exerts actions opposing those of melaninconcentrating hormone (MCH)
[55,61]. The high pomc expression levels might reflect an important role for αMSH in the changes in skin coloration occurring
during silvering in eel.
In light of these physiological adaptations mediated by the melanocortin system, an alternative explanation of potential stress (see
discussion above) can develop, in which silver eels naturally exhibit the characteristics of a stressed state and therefore experience
a chronic activation of the Pomcdependent stress response. For example, the high levels of cortisol observed in silver eels have
been interpreted as being involved in the mobilization of energy (fat stores) and the adaptation to seawater [62]. In addition, cortisol
stimulates the expression of the luteinizing hormone βsubunit in European eel [63], thus providing a more complex picture of
cortisol regulation, in which cortisol does not only negatively affect reproduction due to stress, but can also be beneficial for the
induction of sexual maturation.
From this initial survey of the eel pituitary transcriptome it is not possible to precisely disentangle the relative contributions of prior
biological stresslike processes and stress induced by the experiment. This would require much more comprehensive sampling,
including additional biological states, points in time, and welldefined stressors. Considering the dominance of comparatively few
genes in the reported trancriptomes, the lack of detailed physiological clues in the single pomc transcript species, and the relatively
high cost of full transcriptome sequencing, targeted proteomics techniques would be well suited for such an experiment. A recent
study utilized mass spectrometry analyses to reveal the posttranslational processing of pomc in the pituitary of medaka (Oryzias
latipes) [64]. The availability of the draft genome of European eel and the detailed annotation of the central genes we supply in the
current paper makes it possible to predict the molecular weights of all protein products, which facilitates the use of mass
spectrometry.
/>
7/13
5/2/2018
The Pituitary Gland of the European Eel Reveals Massive Expression of Genes Involved in the Melanocortin System
Although more investigation is required to reveal the mechanisms by which the melanocortin system is involved in processes such
as growth and metabolism, reproduction, water balance, and body pigmentation in teleosts, the results presented here support the
idea that the control of this system is a major function of the eel pituitary.
Supporting Information
Figure S1.
Gene expression in all samples. Differences in normalized gene expression between the average expression values for the four
silver eel samples compared to the yellow eel and mature eel samples. The red dot indicates the expression level of pro
opiomelanocortin. Spearman rank correlations (ρ) for the different comparisons show a good correspondence between the
expression values for the different samples.
/>(TIF)
Figure S2.
Gene Ontology characterization. For each GO category the total expression for the average of the silver eel samples was
calculated by summing the normalized expression of all genes annotated with that GO category. The 25 most highly expressed GO
categories based on expression values in the silver eel samples are displayed (for details, see Materials and methods), of which
the top 15 categories include pomc, underlining the dominance of this gene. The red line corresponds to pomc gene expression
alone (based on the original annotation). The first category by expression that does not include pomc is ‘protein binding’.
/>(TIF)
Figure S3.
The importance of reannotation of genes for gene expression in silver eel samples. Differences in gene expression values
for the four silver eel samples, highlighting the genes involved in the melanocortin system that were reannotated in this study. The
original gene expression values (before reannotation) are shown in red and the new gene expression values (after reannotation)
are displayed in green. The figure illustrates the high expression of the genes involved in the melanocortin system as compared to
the overall gene expression (grey), and that recalculation of gene expression values after reannotation of these genes increases
their relative gene expression in all silver eel samples.
/>(TIF)
Table S1.
Primer sequences used for qPCR in this study.
/>(DOCX)
Table S2.
Alignment of RNASeq reads.
/>(DOCX)
Table S3.
Expression values.
/>(XLSX)
Table S4.
Annotation of highly expressed genes.
/>(DOCX)
Acknowledgments
We are grateful to Mieke and John van Dooren (Passie voor Vis BV) and William Swinkels (NijvisHolding BV) for providing farmed
eels, Bas Brittijn and Hans Jansen for animal handling and sample preparation and Yuki Minegishi, Daniel Vodák and Christian
Tudorache for discussions.
Author Contributions
Conceived and designed the experiments: EAW RPD EB RNL HPS GEEJMdT KT SD FAW CVH. Performed the experiments: EAW
EB RNL DLdW CVH. Analyzed the data: EAW CVH. Wrote the manuscript: EAW RPD EB FAW CVH.
/>
8/13
5/2/2018
The Pituitary Gland of the European Eel Reveals Massive Expression of Genes Involved in the Melanocortin System
References
1. Freyhof J, Kottelat M (2010) Anguilla anguilla. IUCN Red List of Threatened Species. Available: . Accessed 15 March 2013.
2. Schmidt J (1923) Breeding places and migration of the eel. Nature 111: 51–54. doi:10.1038/111051a0.
View Article
PubMed/NCBI
Google Scholar
3. Tesch FW (2003) The Eel. Blackwell Publishing House Science. 418 pp.
4. Dufour S, Lopez E, Le Men MF, Le Belle N, Baloche S et al. (1988) Stimulation of gonadotropin release and of ovarian development, by the
administration of a gonadoliberin agonist and of dopamine antagonists, in female silver eel pretreated with estradiol. Gen Comp Endocrinol 70: 20–30.
doi:10.1016/00166480(88)900901. PubMed: 3286369.
View Article
PubMed/NCBI
Google Scholar
5. Sbaihi M, FouchereauPeron M, Meunier F, Elie P, Mayer I et al. (2001) Reproductive biology of the conger eel from the south coast of Brittany, France
and comparison with the European eel. J Fish Biol 59: 302–318. doi:10.1006/jfbi.2001.1642.
View Article
PubMed/NCBI
Google Scholar
6. Tsukamoto K, Chow S, Otake T, Kurogi H, Mochioka N et al. (2011) Oceanic spawning ecology of freshwater eels in the western North Pacific. Nat
Commun 2: 179. doi:10.1038/ncomms1174. PubMed: 21285957.
View Article
PubMed/NCBI
Google Scholar
7. Kanda S, Okubo K, Oka Y (2011) Differential regulation of the luteinizing hormone genes in teleosts and tetrapods due to their distinct genomic
environments – Insights into gonadotropin beta subunit evolution. Gen Comp Endocrinol 173: 253–258. doi:10.1016/j.ygcen.2011.05.015. PubMed:
21663743.
View Article
PubMed/NCBI
Google Scholar
8. Nozaki M, Naito N, Swanson P, Miyata K, Nakai Y et al. (1990) Salmonid pituitary gonadotrophs. I. Distinct cellular distributions of 2 gonadotropins, GTH
I and GTH II. Gen Comp Endocrinol 77: 348–357. doi:10.1016/00166480(90)90224A. PubMed: 2186958.
View Article
PubMed/NCBI
Google Scholar
9. Weltzien FA, Kobayashi T, Andersson E, Norberg B, Andersen O (2003) Molecular characterization and expression of FSH beta, LH beta, and common
alphasubunit in male Atlantic halibut (Hippoglossus hippoglossus). Gen Comp Endocrinol 131: 87–96. doi:10.1016/S00166480(02)006068. PubMed:
12679085.
View Article
PubMed/NCBI
Google Scholar
10. Zhang C, Forlano PM, Cone RD (2012) AgRP and POMC neurons are hypophysiotropic and coordinately regulate multiple endocrine axes in a larval
teleost. Cell Metab 15: 256–264. doi:10.1016/j.cmet.2011.12.014. PubMed: 22245570.
View Article
PubMed/NCBI
Google Scholar
11. Cloonan N, Forrest AR, Kolle G, Gardiner BB, Faulkner GJ et al. (2008) Stem cell transcriptome profiling via massivescale mRNA sequencing. Nat
Methods 5: 613–619. doi:10.1038/nmeth.1223. PubMed: 18516046.
View Article
PubMed/NCBI
Google Scholar
12. Nagalakshmi U, Wang Z, Waern K, Shou C, Raha D et al. (2008) The transcriptional landscape of the yeast genome defined by RNA sequencing.
Science 320: 1344–1349. doi:10.1126/science.1158441. PubMed: 18451266.
View Article
PubMed/NCBI
Google Scholar
13. Li B, Ruotti V, Stewart RM, Thomson JA, Dewey CN (2010) RNASeq gene expression estimation with read mapping uncertainty. Bioinformatics 26: 493–
500. doi:10.1093/bioinformatics/btp692. PubMed: 20022975.
View Article
PubMed/NCBI
Google Scholar
14. Mortazavi A, Williams BA, Mccue K, Schaeffer L, Wold B (2008) Mapping and quantifying mammalian transcriptomes by RNASeq. Nat Methods 5: 621–
628. doi:10.1038/nmeth.1226. PubMed: 18516045.
View Article
PubMed/NCBI
Google Scholar
15. Henkel CV, Burgerhout E, de Wijze DL, Dirks RP, Minegishi Y et al. (2012) Primitive duplicate Hox clusters in the European eel’s genome. PLOS ONE 7:
e32231. doi:10.1371/journal.pone.0032231. PubMed: 22384188.
View Article
PubMed/NCBI
Google Scholar
16. Henkel CV, Dirks RP, de Wijze DL, Minegishi Y, Aoyama J et al. (2012) First draft genome sequence of the Japanese eel, Anguilla japonica. Gene 511:
195–201. doi:10.1016/j.gene.2012.09.064. PubMed: 23026207.
View Article
PubMed/NCBI
Google Scholar
/>
9/13
5/2/2018
The Pituitary Gland of the European Eel Reveals Massive Expression of Genes Involved in the Melanocortin System
17. Stanke M, Diekhans M, Baertsch R, Haussler D (2008) Using native and syntenically mapped cDNA alignments to improve de novo gene finding.
Bioinformatics 24: 637–644. doi:10.1093/bioinformatics/btn013. PubMed: 18218656.
View Article
PubMed/NCBI
Google Scholar
18. Burgerhout E, Brittijn SA, Kurwie T, Decker P, Dirks RP et al. (2011) First artificial hybrid of the eel species Anguilla australis and Anguilla anguilla. BMC
Dev Biol 11: 16. doi:10.1186/1471213X1116. PubMed: 21396126.
View Article
PubMed/NCBI
Google Scholar
19. Pankhurst NW (1982) Relation of visual changes to the onset of sexual maturation in the European eel Anguilla anguilla. J Fish Biol 21: 127–140.
doi:10.1111/j.10958649.1982.tb03994.x.
View Article
PubMed/NCBI
Google Scholar
20. Durif C, Dufour S, Elie P (2005) The silvering process of Anguilla anguilla: a new classification from the yellow resident to the silver migrating stage. J
Fish Biol 66: 1025–1043. doi:10.1111/j.00221112.2005.00662.x.
View Article
PubMed/NCBI
Google Scholar
21. Aroua S, Weltzien FA, Le Belle N, Dufour S (2007) Development of realtime RTPCR assays for eel gonadotropins and their application to the
comparison of in vivo and in vitro effects of sex steroids. Gen Comp Endocrinol 153: 333–343. doi:10.1016/j.ygcen.2007.02.027. PubMed: 17418843.
View Article
PubMed/NCBI
Google Scholar
22. Weltzien FA, Pasqualini C, Vernier P, Dufour S (2005) A quantitative realtime RTPCR assay for European eel tyrosine hydroxylase. Gen Comp
Endocrinol 142: 134–142. doi:10.1016/j.ygcen.2004.12.019. PubMed: 15862557.
View Article
PubMed/NCBI
Google Scholar
23. Trapnell C, Pachter L, Salzberg SL (2009) TopHat: discovering splice junctions with RNASeq. Bioinformatics 25: 1105–1111.
doi:10.1093/bioinformatics/btp120. PubMed: 19289445.
View Article
PubMed/NCBI
Google Scholar
24. Li H, Handsaker B, Wysoker A, Fennell T, Ruan J et al. (2009) The Sequence Alignment/Map format and SAMtools. Bioinformatics 25: 2078–2079.
doi:10.1093/bioinformatics/btp352. PubMed: 19505943.
View Article
PubMed/NCBI
Google Scholar
25. Anders S (2012) HTSeq, version 0.5.3p Genome Biology Unit9; Heidelberg EMBL. Available: http://www
huber.embl.de/users/anders/HTSeq/doc/overview.html. Accessed 15 March 2013.
26. Anders S, Huber W (2010) Differential expression analysis for sequence count data. Genome Biol 11: R106. PubMed: 20979621.
View Article
PubMed/NCBI
Google Scholar
27. Conesa A, Gotz S, GarciaGomez JM, Terol J, Talon M et al. (2005) Blast2GO: a universal tool for annotation, visualization and analysis in functional
genomics research. Bioinformatics 21: 3674–3676. doi:10.1093/bioinformatics/bti610. PubMed: 16081474.
View Article
PubMed/NCBI
Google Scholar
28. Minegishi Y, Aoyama J, Inoue JG, Miya M, Nishida M et al. (2005) Molecular phylogeny and evolution of the freshwater eels genus Anguilla based on the
whole mitochondrial genome sequences. Mol Phylogenet Evol 34: 134–146. doi:10.1016/j.ympev.2004.09.003. PubMed: 15579387.
View Article
PubMed/NCBI
Google Scholar
29. Cool DR, Loh YP (1998) Carboxypeptidase E is a sorting receptor for prohormones: binding and kinetic studies. Mol Cell Endocrinol 139: 7–13.
doi:10.1016/S03037207(98)000811. PubMed: 9705069.
View Article
PubMed/NCBI
Google Scholar
30. Benjannet S, Rondeau N, Day R, Chrétien M, Seidah NG (1991) PC1 and PC2 are proprotein convertases capable of cleaving proopiomelanocortin at
distinct pairs of basic residues. Proc Natl Acad Sci U S A 88: 3564–3568. doi:10.1073/pnas.88.9.3564. PubMed: 2023902.
View Article
PubMed/NCBI
Google Scholar
31. Mbikay M, Seidah NG, Chrétien M (2001) Neuroendocrine secretory protein 7B2: structure, expression and functions. Biochem J 357: 329–342.
doi:10.1042/02646021:3570329. PubMed: 11439082.
View Article
PubMed/NCBI
Google Scholar
32. Lee SN, Lindberg I (2008) 7B2 prevents unfolding and aggregation of prohormone convertase 2. Endocrinology 149: 4116–4127. doi:10.1210/en.2008
0064. PubMed: 18467442.
View Article
PubMed/NCBI
Google Scholar
33. Weltzien FA, Andersson E, Andersen O, ShalchianTabrizi K, Norberg B (2004) The brainpituitarygonad axis in male teleosts, with special emphasis on
flatfish (Pleuronectiformes). Comp Biochem Physiol A Mol Integr Physiol 137: 447–477. doi:10.1016/j.cbpb.2003.11.007. PubMed: 15123185.
View Article
PubMed/NCBI
Google Scholar
/>
10/13
5/2/2018
The Pituitary Gland of the European Eel Reveals Massive Expression of Genes Involved in the Melanocortin System
34. Bullard JH, Purdom E, Hansen KD, Dudoit S (2010) Evaluation of statistical methods for normalization and differential expression in mRNASeq
experiments. BMC Bioinformatics 11: 94. doi:10.1186/147121051194. PubMed: 20167110.
View Article
PubMed/NCBI
Google Scholar
35. Wendelaar Bonga SE (1997) The stress response in fish. Physiol Rev 77: 591–625. PubMed: 9234959.
View Article
PubMed/NCBI
Google Scholar
36. Ardehali MB, Lis JT (2009) Tracking rates of transcription and splicing in vivo. Nat Struct Mol Biol 16: 1123–1124. doi:10.1038/nsmb11091123. PubMed:
19888309.
View Article
PubMed/NCBI
Google Scholar
37. Van Ginneken V, Durif C, Balm SP, Boot R, Verstegen MWA et al. (2007) Silvering of European eel (Anguilla anguilla L.): seasonal changes of
morphological and metabolic parameters. Anim Biol 57: 63–77. doi:10.1163/157075607780002014.
View Article
PubMed/NCBI
Google Scholar
38. Palstra A, Van Ginneken V, Van den Thillart G (2009) Effects of swimming on silvering and maturation of the European eel, Anguilla anguilla L. In: G.
Van den ThillartS. DufourJC Rankin. Spawning migration of the European eel. Springer Verlag. pp. 229–251.
39. Seidah NG, Chrétien M (1997) Eukaryotic protein processing: endoproteolysis of precursor proteins. Curr Opin Biotechnol 8: 602–607.
doi:10.1016/S09581669(97)800365. PubMed: 9353231.
View Article
PubMed/NCBI
Google Scholar
40. Lee J, Danielson H, Sollars C, Alrubaian J, Balm P et al. (1999) Cloning of a neoteleost (Oreochromis mossambicus) proopiomelanocortin (POMC) cDNA
reveals a deletion of the gammamelanotropin region and most of the joining peptide region: implications for POMC processing. Peptides 20: 1391–1399.
doi:10.1016/S01969781(99)001485. PubMed: 10698113.
View Article
PubMed/NCBI
Google Scholar
41. Pritchard LE, Turnbull AV, White A (2002) Proopiomelanocortin processing in the hypothalamus: impact on melanocortin signalling and obesity. J
Endocrinol 172: 411–421. doi:10.1677/joe.0.1720411. PubMed: 11874690.
View Article
PubMed/NCBI
Google Scholar
42. Tanaka S (2003) Comparative aspects of intracellular proteolytic processing of peptide hormone precursors: studies of proopiomelanocortin processing.
Zool Sci 20: 1183–1198. doi:10.2108/zsj.20.1183. PubMed: 14569141.
View Article
PubMed/NCBI
Google Scholar
43. Cool DR, Normant E, Shen FS, Chen HC, Pannell L et al. (1997) Carboxypeptidase E is a regulated secretory pathway sorting receptor: Genetic
obliteration leads to endocrine disorders in Cpe(fat) mice. Cell 88: 73–83. doi:10.1016/S00928674(00)818607. PubMed: 9019408.
View Article
PubMed/NCBI
Google Scholar
44. Lindberg I, Van den Hurk WH, Bui C, Batie CJ (1995) Enzymatic characterization of immunopurified prohormone convertase 2: potent inhibition by a 7B2
peptide fragment. Biochemistry 34: 5486–5493. doi:10.1021/bi00016a020. PubMed: 7727407.
View Article
PubMed/NCBI
Google Scholar
45. Arvan P, Kuliawat R, Prabakaran D, Zavacki AM, Elahi D et al. (1991) Protein discharge from immature secretory granules displays both regulated and
constitutive characteristics. J Biol Chem 266: 14171–14174. PubMed: 1860833.
View Article
PubMed/NCBI
Google Scholar
46. Kirchmair R, HogueAngeletti R, Gutierrez J, FischerColbrie R, Winkler H (1993) Secretoneurin – a neuropeptide generated in brain, adrenal medulla and
other endocrine tissues by proteolytic processing of secretogranin II (chromogranin C). Neuroscience 53: 359–365. doi:10.1016/03064522(93)90200Y.
PubMed: 8492910.
View Article
PubMed/NCBI
Google Scholar
47. FischerColbrie R, Laslop A, Kirchmair R (1995) SecretograninII – molecular properties, regulation of biosynthesis and processing to the neuropeptide
secretoneurin. Prog Neurobiol 46: 49–70. doi:10.1016/03010082(94)00060U. PubMed: 7568909.
View Article
PubMed/NCBI
Google Scholar
48. Zhao E, Basak A, Trudeau VL (2006) Secretoneurin stimulates goldfish pituitary luteinizing hormone production. Neuropeptides 40: 275–282.
doi:10.1016/j.npep.2006.05.002. PubMed: 16806466.
View Article
PubMed/NCBI
Google Scholar
49. Holthuis JCM, Jansen EJR, Martens GJM (1996) Secretogranin III is a sulfated protein undergoing proteolytic processing in the regulated secretory
pathway. J Biol Chem 271: 17755–17760. doi:10.1074/jbc.271.30.17755. PubMed: 8663421.
View Article
PubMed/NCBI
Google Scholar
/>
11/13
5/2/2018
The Pituitary Gland of the European Eel Reveals Massive Expression of Genes Involved in the Melanocortin System
50. Hosaka M, Watanabe T, Sakai Y, Kato T, Takeuchi T (2005) Interaction between secretogranin III and carboxypeptidase E facilitates prohormone sorting
within secretory granules. J Cell Sci 118: 4785–4795. doi:10.1242/jcs.02608. PubMed: 16219686.
View Article
PubMed/NCBI
Google Scholar
51. Holthuis JCM, Martens GJM (1996) The neuroendocrine proteins secretogranin II and III are regionally conserved and coordinately expressed with
proopiomelanocortin in Xenopus intermediate pituitary. J Neurochem 66: 2248–2256. PubMed: 8632145.
View Article
PubMed/NCBI
Google Scholar
52. Postlethwait J, Amores A, Cresko W, Singer A, Yan YL (2004) Subfunction partitioning, the teleost radiation and the annotation of the human genome.
Trends Genet 20: 481–490. doi:10.1016/j.tig.2004.08.001. PubMed: 15363902.
View Article
PubMed/NCBI
Google Scholar
53. Metz JR, Peters JJM, Flik G (2006) Molecular biology and physiology of the melanocortin system in fish: a review. Gen Comp Endocrinol 148: 150–162.
doi:10.1016/j.ygcen.2006.03.001. PubMed: 16620815.
View Article
PubMed/NCBI
Google Scholar
54. Volkoff H, Canosa LF, Unniappan S, CerdáReverter JM, Bernier NJ et al. (2005) Neuropeptides and the control of food intake in fish. Gen Comp
Endocrinol 142: 3–19. doi:10.1016/j.ygcen.2004.11.001. PubMed: 15862543.
View Article
PubMed/NCBI
Google Scholar
55. Takahashi A, Kawauchi H (2006) Evolution of melanocortin systems in fish. Gen Comp Endocrinol 148: 85–94. doi:10.1016/j.ygcen.2005.09.020.
PubMed: 16289182.
View Article
PubMed/NCBI
Google Scholar
56. Coll AP, Loraine Tung YC (2009) Proopiomelanocortin (POMC)derived peptides and the regulation of energy homeostasis. Mol Cell Endocrinol 300:
147–151. doi:10.1016/j.mce.2008.09.007. PubMed: 18840502.
View Article
PubMed/NCBI
Google Scholar
57. Yada T, Morlyania S, Moriyama S, Suzuki Y, Azuma T et al. (2002) Relationships between obesity and metabolic hormones in the ‘cobalt’ variant of
rainbow trout. Gen Comp Endocrinol 128: 3643.
View Article
PubMed/NCBI
Google Scholar
58. Han YS, Liao IC, Huang YS, He JT, Chang CW et al. (2003) Synchronous changes of morphology and gonadal development of silvering Japanese eel
Anguilla japonica. Aquaculture 219: 783–796. doi:10.1016/S00448486(02)005781.
View Article
PubMed/NCBI
Google Scholar
59. Pankhurst NW, Sorensen PW (1984) Degeneration of the alimentary tract in sexually maturing European Anguilla anguilla (L.) and American eels Anguilla
rostrata (LeSueur). Can J Zool 62: 1143–1149. doi:10.1139/z84165.
View Article
PubMed/NCBI
Google Scholar
60. Heinsbroek LTN, Van Hooff PLA, Swinkels W, Tanck MWT, Schrama JW et al. (2007) Effects of feed composition on life history developments in feed
intake, metabolism, growth and body composition of European eel, Anguilla anguilla. Aquaculture 267: 175–187. doi:10.1016/j.aquaculture.2007.03.028.
View Article
PubMed/NCBI
Google Scholar
61. Mizusawa K, Kobayashi Y, Sunuma T, Asahida T, Saito Y et al. (2011) Inhibiting roles of melaninconcentrating hormone for skin pigment dispersion in
barfin flounder, Verasper moseri. Gen Comp Endocrinol 171: 75–81. doi:10.1016/j.ygcen.2010.12.008. PubMed: 21185295.
View Article
PubMed/NCBI
Google Scholar
62. Rousseau K, Aroua S, Schmitz M, Elie P, Dufour S (2009) Silvering: metamorphosis or puberty? In: G. Van den ThillartS. DufourJC Rankin. Spawning
migration of the European eel. Springer Verlag. pp. 39–63.
63. Huang YS, Rousseau K, Sbaihi M, Le Belle N, Schmitz M et al. (1999) Cortisol selectively stimulates pituitary gonadotropin betasubunit in a primitive
teleost, Anguilla anguilla. Endocrinology 140: 1228–1235. doi:10.1210/en.140.3.1228. PubMed: 10067848.
View Article
PubMed/NCBI
Google Scholar
64. Yasuda A, Tatsu Y, Kawata Y, Akizawa T, Shigeri Y (2011) Posttranslational modifications of proopiomelanocrtin related hormones in medaka pituitary
based on mass spectrometric analyses. Peptides 32: 2127–2130. doi:10.1016/j.peptides.2011.08.016. PubMed: 21889556.
View Article
PubMed/NCBI
Google Scholar
65. Nakanishi S, Inoue A, Kita T, Nakamura M, Chang AC et al. (1979) Nucleotide sequence of cloned cDNA for bovine corticotropinbetalipotropin
precursor. Nature 278: 423–427. doi:10.1038/278423a0. PubMed: 221818.
View Article
PubMed/NCBI
Google Scholar
66. Alrubaian J, Sollars C, Danielson PB, Dores RM (2003) Evaluating the radiation of the POMC gene in teleosts: characterization of American eel POMC.
Gen Comp Endocrinol 132: 384–390. doi:10.1016/S00166480(03)001199. PubMed: 12849961.
/>
12/13
5/2/2018
The Pituitary Gland of the European Eel Reveals Massive Expression of Genes Involved in the Melanocortin System
View Article
PubMed/NCBI
Google Scholar
67. Cone RD (2006) Studies on the physiological functions of the melanocortin system. Endocr Rev 27: 736–749. PubMed: 17077189.
View Article
PubMed/NCBI
Google Scholar
/>
13/13