Nutrient flow and retention
Bạn đang xem bản rút gọn của tài liệu. Xem và tải ngay bản đầy đủ của tài liệu tại đây (198.71 KB, 16 trang )
14
Nutrient Flow and Retention
John E. Halver
School of Aquatic and Fishery Sciences, University of Washington, Seattle,
Washington 98195
Ronald W. Hardy
Hagerman Fish Culture Experiment Station, University of Idaho, Hagerman, Idaho 83332
14.1.
14.2.
14.3.
14.4.
14.5.
14.6.
14.7.
14.8.
14.9.
14.10.
14.11.
14.12.
14.13.
14.14.
14.15.
14.16.
Introduction
Carbohydrate Metabolism
Glycolysis
Carbohydrate Synthesis
Pentose Phosphate Pathway
Glycogenolysis
Diet and Carbohydrate Metabolism
Lipid Metabolism
Odd-Chain-Length Fatty Acid Oxidation
Electron Transfer Cascade
Amino Acid Metabolism
Effect of Diet on Intermediary Metabolism
Measuring Protein Accretion and Degradation
Intake and Metabolism
Sexual Maturity and Metabolism
Prospects for Improvement of Protein
Retention Efficiency
References
Fish Nutrition, Third Edition
Copyright 2002, Elsevier Science (USA).
All rights reserved.
755
756
Halver and Hardy
14.1
Introduction
Fish nutrient metabolism is the sum total of the biochemical reactions
in life processes. Nutrient metabolism pathways outlined in classical biochemistry texts such as those by Lehninger (1979), West et al. (1966), and
Kaneko (1989) for terrestrial animals also apply to poikilothermic animals
such as fish. Fish species vary from carnivores to omnivores to herbivores
living in a wide range of water temperatures, from near 0 to near 40◦ C, with
corresponding abilities to utilize carbohydrate, protein, and lipid sources
for energy and metabolites for anabolic tissue processes. The main nutritional difference between terrestrial and aquatic animals involves the ability
to exploit plants as food sources. Terrestrial animals exploit the ability of
plants to convert the sun’s energy into leaves and seeds, either directly or
indirectly through the food chain. Some fish utilize aquatic plants directly,
but most exploit plankton, both phytoplankton and zooplankton, again
either directly or indirectly through the food chain. There are no fish equivalents of ruminant animals. Thus, fish exhibit subtle differences in genetic
isozymes associated with their habitat, but in general, cellular metabolism
among fish species is similar. In this chapter, the major nutrient pathways
are outlined, and the emphasis is on differences among fish species and
between fish and terrestrial animals.
Most fish live in a heat sink and their metabolism rates are governed by
the water temperature. As a result, most fish have adapted enzyme systems
to poikilothermic environments and their “genetic isozymes,” while very
similar in structure, combine with the same general substrates to accomplish
the digestion, absorption, and subsequent biochemical reactions necessary
for energy generation and metabolite incorporation into cell functions.
Different groups of fish have different abilities to digest and use complex
polysaccharides as energy sources but are well adapted to use proteins and
lipids as a preferred energy source. Warmwater freshwater fish generally can
use more carbohydrate in the diet and herbivorous fish have well-developed
systems to utilize plant material. All fish still need to metabolize proteins for
amino acid sources for anabolism and growth. As a result, all fish studied
have well-developed proteolytic enzyme systems and some have both acidic
and basic tryptic enzymes, in contrast to terrestrial animals. Another feature is the presence of active chitinase in many species with the ability to
digest and utilize the 2-aminoglucose polymer present in the exoskeletons
of insects and crustaceans. Lipid utilization is well developed in most fish,
although certain cyprinids have a limited ability to use high-lipid diets
without generating liver toxicity and obesity. Fish, living in water, also have
the advantage of direct contact with a good solvent for absorption of
14. Nutrient Flow and Retention
757
excretions. Therefore, fish eliminate most of the nitrogen resulting from
amino acid catabolism and other nitrogenous metabolites into the water as
ammonia from the gills. This is an energy-sparing system that increases the
amount of metabolic energy that fish derive from protein metabolism. As
a result, fish are more efficient in protein utilization than are homeothermic terrestrial animals, which must eliminate nitrogenous waste as urea or
uric acid. More specific information on the above principles can be found
in the chapters on bioenergetics (Chapter 1), proteins (Chapter 3), lipids
(Chapter 4), and digestive physiology (Chapter 7) in this book.
14.2
Carbohydrate Metabolism
Digestibility of polysaccharides is poorly developed, although present, in
carnivorous fish. Salmonids and most marine species use protein and lipid
as the major energy and anabolic intermediates for growth. Cowey (1989)
summarized the amylase, pepsin, and trypsin activities in carp and yellowtail,
showing a 10-fold increase in amylase activity in the warmwater carp versus
the marine yellowtail, little, if any, pepsin activity in the neutral stomach of
the carp, but comparable tryptic activity in both species.
Glycogen is still the major carbohydrate storage form in the liver and
muscle of fish, and even during long periods of starvation or migration of
salmonids, little loss of liver or muscle glycogen occurs (French et al., 1983).
This is evidence for gluconeogenesis from amino acids catabolized during
the starvation period.
14.3
Glycolysis
The classical Emden–Meyerhof pathway of glucose metabolism after the
formation of glucose 1-phosphate exists in fish. After glucose 6-phosphate
is formed, it is converted into fructose 1,6-diphosphate, which is split into
two molecules of glyceraldehyde 3-phosphate and then condensed into two
molecules of pyruvate which can enter the tricaboxylic acid cycle (TCA) as
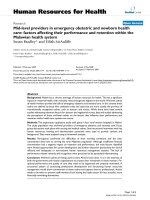
acetyl-coenzyme A (acetyl-CoA). All enzymes of the cycle have been identified in fish tissues (Tarr, 1972)(Fig. 14.1).
This pathway allows conversion of glucose into acetyl-CoA and subsequent
generation of the high-energy bonds in adenosine triphosphate (ATP) from
adenosine diphosphate (ADP). The net result from 1 mol of glucose is
36 mol of ATP. Each mole of ATP hydrolyzed in the cell yields 7 kcal of
energy for anabolic and catabolic reactions. The biological efficiency of the
758
Halver and Hardy
FIG. 14.1
Major enzymes in glycolysis.
aerobic metabolism of glucose can be calculated from the bond energies
involved.
C6 H12 O3 + 6O2 −→ 6CO2 + 6H2 O + 686 kcal
Enzymatic glycolysis −→ 36 ATP × 7 kcal −→ 252 kcal
Theoretical biological efficiency −→ 38%
14. Nutrient Flow and Retention
759
Under anaerobic conditions in the muscle of fish, the glucose is converted into lactate and only 2 mol of ATP per mole is available. The lactate
also requires considerable time to be eliminated from the muscle with adequate oxygen in the water environment. Tarr (1972) listed each of the
enzymes involved in glycolysis and the references for each demonstrated in
fish tissues. Cowey and Walton (1989) discussed the irreversible reactions
and probable regulatory factors in glycolysis and gluconeogenesis and, also,
the range of glycolytic enzymes in trout (Walton and Cowey, 1982). Other
specific enzymes in different fish tissues were more recently identified and
are included in the discussions in Chapters 1 through 5 of this book.
14.4
Carbohydrate Synthesis
Carbohydrate synthesis is a very energy-expensive process in fish tissue.
Two moles of pyruvate are needed for the synthesis of 1 mol of glucose. This
uses six high-energy phosphate bonds, but anaerobic conversion of glucose
into pyruvate yields only 2 mol of ATP. Gluconeogenesis does occur in fish,
however, especially during extended periods of starvation or migration when
muscle and liver glycogen must supply the necessary blood glucose for life
processes.
14.5
Pentose Phosphate Pathway
The pentose phosphate pathway is a minor path for synthesis of ribose
molecules and niacin adenine diphosphate (NADP). The pathway in fish
has been described by Walton and Cowey (1982):
d-Glucose 6-phosphate + 2 NADP + H2 O
−→ d-ribose 5-phosphate + CO2 + 2 NADPH + 2 H+
The reducing equivalents may be used for lipid synthesis. High-carbohydrate
diets in catfish induced increased levels of glucose-6-phosphate dehydrogenase in the liver, indicating stimulated lipogenesis (Likimandi and Wilson,
1982). For more information on lipogenesis see Chapter 4.
14.6
Glycogenolysis
Glycogen in liver and muscle is the available glucose storage unit in fish as
in terrestrial animals. Glycogenolysis is one source of glucose, but glycogen
760
Halver and Hardy
maintenance and hydrolysis to meet metabolic needs are critical to fish
health. Glycogenolysis does not appear to be the major source of liver or
muscle glucose when adequate dietary levels of precursors are present, but it
may be temperature dependent and an emergency strategy before glucose
is made available from the diet or by gluconeogensis from amino acids
from digested protein (Renaud and Moon, 1980; Siebert, 1985; Cowey and
Walton, 1989).
14.7
Diet and Carbohydrate Metabolism
Dietary balances may affect carbohydrate metabolism. Cowey et al. (1977)
showed that trout with a 60% protein diet and no digestible carbohydrate
had significantly higher gluconeogenesis than trout fed a low-protein diet
with 50% carbohydrate present. Fasting fish also had a high gluconeogenesis
rate, comparable to that of fish on a high-protein diet. Two other glycolytic
enzymes measured also showed an elevated activity, similar to that in fish fed
the high-protein diet. Buhler and Halver (1961) showed that salmon would
utilize simple hexoses readily and disaccharides well, but polysaccharides
were poorly used in the cold waters that salmon occupy. Digestible energy
values were calculated to be as follows.
Raw starch:
Cooked starch:
Dextrin:
Glucose:
Sucrose:
Cellulose:
1.5–2 kcal/g
2.5–3 kcal
3–3.5 kcal
4.0 kcal
4.0 kcal
0.1 kcal
Digestible energy values for protein and lipids were calculated by Smith
(1989) to be as follows.
Digested protein:
Digested lipid:
5.0 kcal/g
8.0 kcal/g
14.8
Lipid Metabolism
An extensive discussion on lipid metabolism can be found in Chapter 4.
Simple fats are digested by lipases, releasing fatty acids and glycerol. The
fatty acids are degraded 2 carbon units at a time in classical β-oxidation steps,
14. Nutrient Flow and Retention
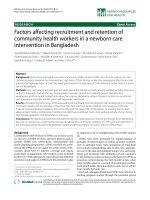
FIG. 14.2
Nutrient flow and ATP production.
761
762
Halver and Hardy
yielding acetyl-CoA for transport into the TCA cycle to generate high-energy
phosphate bonds in ATP. The primary oxidation sequence is as follows:
(1)
(2)
(3)
(4)
(5)
Fatty acid plus ATP and S–CoA forms fatty acid–S–CoA.
Dehydration forms β-dehydro fatty acid–CoA.
Hydration forms β-hydroxy fatty acid–CoA.
Oxidation forms β-keto fatty acid–CoA.
The lysis by CoA–SH forms new fatty acid–CoA and acetyl–CoA.
Then further β-oxidation in the steps above is needed to yield more acetylCoA. Each cycle reduces the carbon chain of the fatty acid by two carbons.
As an example, palmitic acid (C16 ) forms palmityl-CoA and yields eight
acetyl-CoA molecules. In the process, seven reduced flavin adenine dinucleotide (FADH) and seven reduced diphosphopyridine nucleotide
(DPNH) molecules are generated. The net energy gain is then as follows.
(a) Palmitic acid to palmityl-CoA - - - - - - - - - - - - - - - - - - - - - - - - - - - - - - - - - - → −2 ATP
(b) 7 Palmityl-CA yields 8 acetyl-CoA
(i) 7 FADH to 7 FP (7 × 2) - - - - - - - - - - - - - - - - - - - - - - - - - - - - - - - - - - - → +14 ATP
(ii) 7 DPNH to 7 DPN (7 × 3) - - - - - - - - - - - - - - - - - - - - - - - - - - - - - - - - → +21 ATP
(c) 8 Acetyl-CoA to 16 CO2 + 8 HOH
+ 8 CoASH (8 × 12) - - - - - - - - - - - - - - - - - - - - - - - - - - - - - - - - - - - - - - - - - → +96 ATP
Estimated biological yield:
129 ATP × 7 kcal = 903 kcal
But complete oxidation of palmitic acid to CO2 and H2 O is 2340 kcal.
Hence the biological efficiency is 903/2340, or 39%. The biological efficiency of fatty acid cellular oxidation is thus approximately the same as that
for digestible carbohydrates or lipids and, as shown later, for proteins as well.
Several vitamins are involved in the various steps of oxidation: pantothenic acid in CoA in step (1); riboflavin as flavin adenine diphosphate in step
(2); biotin and ascorbic acid in step (3); riboflavin, niacin, and pyridoxine
in step (4); pantothenic acid again in step (5); and lipoic acid during the
TCA cycle that follows utilization of the “active acetate” to generate ATP for
cell metabolic energy demands (see Fig. 14.2).
14.9
Odd-Chain-Length Fatty Acid Oxidation
Odd-Chain-Length fatty acids are present in small amounts in fish skin
slime and on exoskeleton surfaces of insects and crustaceans. These serve as
bactericidal agents when degraded by β-oxidation to three-carbon propionic
acid, which cannot be degraded by most bacteria. Metabolism of these fatty
acids involves removing one carbon atom from the fatty acid and thus generating an even-chain-length fatty acid that can then be used by β-oxidation
for energy production. Specific enzymes for demethylation similar to those
14. Nutrient Flow and Retention
763
found in terrestrial animals have been identified in fish (Nicolaides and
Laves, 1958; Gurr and Harwood, 1991).
14.10
Electron Transfer Cascade
In oxidation–reduction reactions electrons are transferred from the electron donor to an oxidant or electron acceptor. There are four main classes
of these enzymes.
(1) Pyridine dehydrogenases catalyze reversible transfer of electrons from the
substrate to niacin adenine dinucleotide (NAD) or NAD phosphate to form
NADH or NADPH.
(2) The flavin dehydrogenases contain flavin mononucleotide (FMN) or
dinucleotide (FAD). The most important flavin oxidases are succinic
dehydrogenase and NADH dehydrogenases.
(3) Iron–sulfur proteins have from two to eight atoms of iron and a comparable
number of acid-labile sulfur atoms where the iron atoms undergo Fe2+ to
Fe3+ changes as electrons are transferred.
(4) Cytochromes in series transfer electrons from the flavoproteins to oxygen.
These contain iron–porphyrin complexes and can undergo reversible Fe2+
to Fe3+ reactions. Electron transport from NADH to oxygen involves a
decrease in free energy, which can be conserved by phosphorylation of ADP
to ATP to yield the high-energy bonds readily available as an energy source
for anabolism and catabolism in tissues. Copper-containing cytochromes
also occur in the pathway, with the copper available for electron transfer
from the Cu+ to the Cu2+ state. Molecular oxygen can be used in the system
also to hydroxylate organic compounds. Dioxygenases insert two oxygen
atoms into the substrate and monooxygenases insert only one atom of
oxygen. Cytochrome P450 is a common active cofactor in enzymatic
hydroxylations. The schematic cascade of oxidative phosphorylation was
succinctly illustrated by West et al. (1966) in their textbook of biochemistry
for medical students.
14.11
Amino Acid Metabolism
Fish and all animals need a constant source of amino acids for tissue
protein synthesis and for synthesis of other compounds associated with
metabolism, including hormones, neurotransmitters, purines, and metabolic enzymes. Amino acids are also catabolized to supply metabolic energy.
Amino acids for these purposes are supplied by the diet and, also, by turnover
of amino acids in tissue proteins, which occurs constantly. Free amino acid
levels in tissues are relatively low; most amino acids in the body are
764
Halver and Hardy
components of tissue proteins. Thus, the need for a constant supply of
amino acids for metabolic needs is a reality of life. Compared to rats, fish
appear to be more dependent on dietary amino acids to supply metabolic
needs. Cowey and Luquet (1983) estimated that catabolism of tissue proteins supplies about 50% of the amino acids used in metabolism; whereas
in rats this figure approaches 70% (Millward et al., 1976). Additional details
are reported in Chapter 6.
As mentioned earlier, fish excrete nitrogen from amino acid catabolism
mainly as ammonia, rather than as urea or uric acid, as is the case in mammals or birds, respectively. Synthesis of urea and uric acid from ammonia
consumes energy, thus mammals and birds derive less metabolic energy
from amino acid catabolism than do fish. This special facility of fish to
utilize amino acids as energy sources may explain why it is difficult to feed
diets under laboratory conditions that yield much more than 55% protein
(nitrogen) retention, whereas in other animals, nitrogen retention under
ideal conditions is higher (National Research Council, 1974). Ammonia
represents 70–90% of the total nitrogenous wastes in fish (Mommsen and
Walsh, 1992), with 5–15% excreted as urea, depending on the species of
fish (Dosdat et al., 1996). Between 80 and 90% of all nitrogen excretion in
fish occurs through the gills.
Amino acid catabolism occurs mainly in the liver as a part of nutrient
metabolism via deamination reactions, i.e., aminotranferase and deaminase
reactions in the cytosol and mitochondria, respectively. Each amino acid has
a specific route of catabolism involving enzyme-catalyzed reactions with specific end products. This subject has not been studied extensively in fish; it is
assumed that pathways and reactions identified in animals also exist in fish.
Cowey and Walton (1989) summarized the enzymes and catabolic pathways
of amino acid degradation for each amino acid, and this information still
holds today. The first step in the catabolism of amino acids is the removal
of the amino group (transdeamination) to intermediate compounds that
can be further metabolized in the TCA cycle to yield energy or used as
substrates for synthesis of other compounds. The amino group, containing nitrogen, is transferred to α-ketoglutarate to form glutamic acid. This
reaction involves cytoplasmic transaminases. The deaminated product can
then be metabolized through oxidative pathways to yield energy. The net
biological efficiency of converting protein to energy is about 40%.
Glutamic acid is then transported into mitochondria, is deaminated by
glutamate dehydrogenase, and the resulting NH4 + leaves the mitochondria
(Walsh, 1997). It is hypothesized that NH4 + participates in an ammonia
“shuttle” involving cytoplasmic glutamine synthetase to produce glutamine,
which is then transported into the mitochondria, where it is converted to
NH3 . This proposed mechanism exists in the kidney of elasmobranches
and aids in the establishment of a chemiosmotic gradient needed for ATP
14. Nutrient Flow and Retention
765
production. More detailed descriptions of specific amino acid metabolism
can be found in Chapter 6.
Nearly all nitrogen excretion in fish occurs in the gills. The amino group
(NH2 ) removed from glutamic acid in the liver yields α-ketoglutarate and
NH3 , which is then carried by the circulatory system to the gills, where it is
excreted by direct diffusion from blood to water, direct diffusion of NH3 ,
and/or functional Na+ /NH4 + exchange. Which mechanism is dominant
depends on whether the fish involved is a marine or a freshwater species. In
freshwater species, NH3 diffusion is the main mechanism of excretion. Most
teleost fish are ammoniotelic, yet a portion of their nitrogen excretion is in
the form of urea. Elasmobranchs, coelacanths, and several other teleost fish
living in specialized environments are ureotelic, and the majority of their
nitrogen excretion is as urea (Walsh, 1997). Elasmobranchs and coelacanths
are ureosmotic fish and can maintain osmoregulatory balance by maintaining a high level of urea in their tissues. In spiny dogfish (Squalus acanthias)
more than 90% of nitrogen excretion is as urea excreted by the gills (Wood
et al., 1995). Urea is much less toxic than ammonia, but at the levels found
in some ureosmotic fish, urea can precipitate proteins. Fish counteract this
by having high concentrations of trimethylamine oxide (TMAO), which
counteracts the effects of urea and stabilizes proteins (Somero, 1986).
Because ammonia is toxic, it must be excreted relatively rapidly to prevent tissue accumulation. The plasma ammonia concentration is related
to the protein intake (Kaushik, 1980; Jobling, 1981; Kikuchi et al., 1991)
and begins to rise 3–8 hr following a meal, depending on the species of fish,
protein intake, and quality of protein in the meal (Dosdat et al., 1996). Freshwater species (trout) had higher levels of plasma nitrogen following a meal
(6.5 mg/liter) compared to marine species (sea bass, sea bream, and turbot),
which were uniformily lower (3.5 mg/liter). In contrast, plasma urea concentrations in marine species were not related to dietary protein intake
and were seven to eight times higher in marine species than in freshwater
species (44–59 vs 6.5–7 mg/liter, respectively). Maximum nitrogen excretion occurred 3–5 hr following a meal in small fish (ca. 10 g), compared to
5–8 hr following a meal in large fish (100 g). Dosdat et al. (1996) reported
that between 30 and 38% of ingested nitrogen was excreted within 24 hr
in trout, sea bass, and sea bream, but for turbot, the value was only 21% of
ingested nitrogen.
14.12
Effect of Diet on Intermediary Metabolism
The dietary lysine intake influences the fractional rates of protein synthesis and degradation in liver and muscle of rainbow trout (Garzon et al.,
1994). Fish fed lysine-deficient diets exhibited increased rates of protein
766
Halver and Hardy
degradation without significant changes in protein synthesis rates in the
liver, while in the muscle lysine deficiency caused significant increases in
both the protein degradation and the protein synthesis rates. Other published studies confirm that various amino acid transferases exhibit a higher
activity in fish fed high-protein diets compared to fish fed low-protein diets
but this effect is not uniform (summarized by Cowey and Walton, 1989).
There is little effect of dietary protein intake on the activities of amino
acid-catabolizing enzymes.
14.13
Measuring Protein Accretion and Degradation
New and sensitive methods have been developed to measure protein synthesis and degradation rates in tissues using a flooding dose of [3 H]phenylalanine, administered by injection (Garlick et al., 1980). Using this approach,
researchers have developed a number of insights into the metabolic processes associated with protein accretion in tissues. As summarized by
Houlihan (1991), “It is well established that the amount of protein synthesized exceeds the amount retained as growth.” This amount varies with
feed (protein) intake, fish size, and species and also varies among tissues.
Carter et al. (1993a) found a relationship among protein intake, protein synthesis, and protein retention efficiency (protein gain/protein intake rate)
in grass carp, but the efficiency of protein growth was determined by the
rate of protein degradation. Faster-growing fish had lower rates of protein
degradation, higher retention of synthesized protein, higher RNA activity,
and a lower capacity for synthesis and variable rates of protein synthesis.
Houlihan et al. (1988) reported that fractional rates of protein synthesis
differed among tissues, with liver > gills > intestine > spleen > ventricle
> stomach > gonads > white muscle in cod. White muscle in cod had the
highest protein retention efficiency and accounted for 40% of the total body
protein accretion per day, an observation also reported by Facuconneau et al.
(1995) for rainbow trout. Houlihan et al. (1986) ranked rainbow trout tissues
in terms of fractional protein synthesis and degradation rates as follows: gills
> ventricle > red muscle > white muscle. However, the ranking based upon
total amounts of protein synthesized per day was as follows: white muscle =
gills > red muscle > ventricle. They reported that 76% of the protein synthesized in white muscle appeared as growth, compared to only 4% for
gills. Recently, the possibility of estimating protein (muscle) synthesis rates
in fish by measuring tissue levels of mRNA associated with myosin synthesis has been introduced (Overturf and Hardy, 2001). If a similar method
can be developed to measure protein (muscle) degradation rates, this may
14. Nutrient Flow and Retention
767
lead to a deeper understanding of the factors that control protein accretion
efficiency and provide a tool on which to base diet formulation, genetic
selection of fish for more rapid and efficiency growth, and other beneficial
applications.
14.14
Intake and Metabolism
Feed intake also determines protein synthesis rates, with fractional rates
of protein synthesis increasing from 5 to 11 times in larval herring when feeding was restored after a period of fasting (Houlihan et al., 1995). Carter et al.
(1993b) found that differences in growth of individual Atlantic salmon were
not correlated with the feed intake, digestive capacity, or feeding hierarchy
rank but, rather, with the efficiency of protein retention, i. e., differences
among fish in synthesis retention of protein, again related to lower rates
of protein degradation. These authors concluded that greater use of recycled amino acids for protein synthesis and growth, rather than for oxidation
and excretion, enabled some salmon to retain protein more efficiently. In
flounder, individual differences in growth efficiency were related to differences in protein turnover, and fast-growing fish had lower rates of both
protein synthesis and protein degradation (Carter et al., 1998).
14.15
Sexual Maturity and Metabolism
Protein metabolism in fish differs during sexual maturation compared to
that during growth stages of life history. Martin et al. (1993) found that there
is considerable protein turnover and repartitioning of amino acids during
starvation and sexual maturity in Atlantic salmon. The ovary obviously makes
the largest contribution to the energy and amino acid demands of the fish
during this period. Most of the amino acids needed for maturation of the
ovary originate in white muscle and are made available as a result of protein
degradation.
Recently, the technique used to determine the information reported
above has been extended to the use of stable isotopes, mainly 15 N, using
the same flooding dose technique used with radioactive isotopes of amino
acids (Owen et al., 1999). The advantage of this approach is that it can be
used in the field or in situations where the use of radioactive isotopes is
limited.
An outline of nutrient flow, retention, and metabolism in fish is shown
in Fig. 14.3.
768
Halver and Hardy
FIG. 14.3
Nutrient flow in fish.
14.16
Prospects for Improvement of Protein
Retention Efficiency
As discussed above, protein retention efficiency is determined by a
number of endogenous and exogenous factors, including the feed intake, dietary protein and energy levels, dietary amino acid leves, dietary amino acid
bioavailability, life history stage, and genetically controlled rate of protein
turnover (degradation). Protein (nitrogen) retention in farmed fish has
improved greatly over the past decade in species that tolerate high dietary
14. Nutrient Flow and Retention
769
lipid levels, such as Atlantic salmon. In the late 1980s, the average protein retention in farmed Atlantic salmon was 22–25%, with 75% or more
of ingested nitrogen excreted. By 2000, protein retention had increased
to 45% or more, the result of changes in dietary energy levels (up to 35%
lipid) and improvements in protein quality. Further increases are possible
in Atlantic salmon, but such increases are limited by metabolic reality. In
other farmed fish species, considerable opportunities for improvement of
protein (nitrogen) retention exist, but not all species tolerate high lipid
diets as well as do Atlantic salmon.
Improvements of the protein retention efficiency in farmed fish are
needed to reduce the environmental impacts of aquaculture and, also, to
make more efficient use of dietary protein, the most expensive component
of diet formulations for fish. Perhaps the greatest potential for improving
protein retention lies in the selection of broodstock having higher protein
retention rates due to lower rates of protein degradation, but opportunities
to improve protein retention through the formulation of “ideal proteins”
and by increasing dietary energy levels also need to be explored.
References
Carter, C. G., Houlihan, D. F., Buchanan, B., and Mitchell, A. I. (1993a). Fish Physiol. Biochem.
12(4), 305–312.
Carter, C. G., Houlihan, D. F., Brechin, J., and McCarthy, I. D. (1993b). Can. J. Zool. 71,
392–400.
Carter, C. G., Houlihan, D. F., and Owen, S. F. (1998). J. Fish Biol. 53, 272–284.
Cowey, C. B., and Luquet, P. (1983). In “IV International Symposium on Protein Metabolism
and Nutrition.” INRA, Clermont-Ferrand, France.
Cowey, C. B., and Walton, M. J. (1989). In “Fish Nutrition,” 2nd ed. ( J. E. Halver, ed),
pp. 259–329. Academic Press, New York.
Cowey, C. B., Knox, D., Walton, M. J., and Adron, J. W. (1977). Br. J. Nutr. 38, 463.
Dosdat, A., Servais, F., Metailler, R., Heulvan, C., and Desbruyeres, E. (1996). Aquaculture 141,
107–127.
Fauconneau, B., Gray, C., and Houlihan, D. F. (1995). Comp. Biochem. Physiol. 111B, 45–51.
French, C., Hochachka, P. W., and Mommsen, T. P. (1983). Am. J. Physiol. 245, R827.
Garlick, P. J., McMillen, M. A., and Preedy, V. R. (1980). Biochem. J. 192, 719–723.
Garzon, A., Peragon, J., Hidalgo, M. C., Cardenete, G., Lupianez, J. A., and de la Higuera, M.
(1994). Aquaculture 124, 64 (abstr).
Gurr, M. I., and Harwood, J. L. (1991). In “Lipid Biochemistry,” vol. 93, p. 375. Chapman and
Hall, London.
Houlihan, D. F. (1991). Adv. Comp. Env. Physiol. 7, 1–43.
Houlihan, D. F., McMillan, D. N., and Laurent, P. (1986). Physiol. Zool. 59(4), 482–493.
Houlihan, D. F., Hall, S. J., Gray, C., and Noble, B. S. (1988). Can. J. Fish. Aquat. Sci. 45, 951–964.
Houlihan, D. F., Petersen, B. H., Steffensen, J. F., and Brechin, J. (1995). Fish Physiol. Biochem.
14(3), 195–208.
Jobling, M. (1981). J. Fish. Biol. 18, 87–96.
Kaushik, S. J. (1980). Reprod. Nutr. Dev. 20, 1751–1765.
770
Halver and Hardy
Kikuchi, K., Takeda, S., Honda, H., and Kiyono, M. (1991). Nippon Suisan Gakkaishi 57,
2059–2064.
Martin, N. B., Houlihan, D. F., Talbot, C., and Palmer, R. M. (1993). Fish Physiol. Biochem. 12(2),
131–141.
Millward, D. J., Garlick, P. J., Nnanyelugo, D. O., and Waterlow, J. C. (1976). Biochem. J. 156,
185–188.
Mommsen, T., and Walsh, P. J. (1992). Experientia 48, 583–593.
National Research Council (NRC) (1974). “Improvement of Protein Nutriture.” National
Academy Press, Washington, DC.
Overturf, K., and Hardy, R. W. (2001). Aquacult. Res. 32(4), 315–322.
Owen, S. F., McCarthy, I. D., Watt, P. D., Ledero, V., Sanchez, J. A., Houlihan, D. F., and Rennie,
M. J. (1999). Fish Physiol. Biochem. 20, 87–94.
Smith, R. R. (1989). In “Fish Nutrition,” 2nd ed., J. E. Halver, ed. pp. 1–29. Academic Press,
New York.
Somero, G. N. (1986). Am. J. Physiol. 251, R197–R213.
Walton, M. J., and Cowey, C. B. (1982). Comp. Biochem. Physiol. 73B, 59.
Walsh, P. J. (1997). In “The Physiology of Fishes,” 2nd edition. (D. H. Evans, ed.), pp. 199–214.
CRC Press, Boca Raton, FL.
Wood, C. M., Part, P., and Wright, P. A. (1995). J. Exp. Biol. 198, 1545–1558.