An engineering analysis of the stoichiometry of autotrophic, heterotrophic bacterial control of ammonia nitrogen in zero exchange marine shrimp
Bạn đang xem bản rút gọn của tài liệu. Xem và tải ngay bản đầy đủ của tài liệu tại đây (788.87 KB, 27 trang )
Analysis of bacterial control of ammonia-nitrogen in shrimp production systems
An Engineering Analysis of the Stoichiometry of
Autotrophic, Heterotrophic Bacterial Control of
Ammonia-Nitrogen in Zero-Exchange Marine Shrimp
Production Systems
J. M. Ebeling 1*, M. B. Timmons 2, J.J. Bisogni 3
Aquaculture Systems Technologies, LLC
New Orleans, LA 70121, USA
1
2
Department of Biological and Environmental Engineering
Cornell University
Ithaca, NY 14853 USA
3
School of Civil and Environmental Engineering
Cornell University
Ithaca, NY 14853 USA
* Corresponding author:
Keywords: zero-exchange systems, autotrophic system,
heterotrophic system, C/N ratio
Abstract
After dissolved oxygen, ammonia-nitrogen buildup from the metabolism
of feed is usually the limiting factor to increasing production levels in
intensive aquaculture systems. Currently, large fixed-cell bioreactors
are the primary strategy used to control inorganic nitrogen in intensive
recirculating systems. This option utilizes chemosynthetic autotrophic
bacteria, ammonia-oxidizing bacteria (AOB), and nitrite-oxidizing
bacteria (NOB). Zero-exchange nitrification management systems have
been developed based on heterotrophic bacteria and promoted for the
intensive production of marine shrimp and tilapia. In these systems,
the heterotrophic bacterial growth is stimulated through the addition
International Journal of Recirculating Aquaculture 10 (2009) 63-90. All Rights
Reserved, © Copyright 2009 by Virginia Tech, Blacksburg, VA USA
International Journal of Recirculating Aquaculture, Volume 10, June 2009
63
Analysis of bacterial control of ammonia-nitrogen in shrimp production systems
of an organic labile carbonaceous substrate. At high organic carbon to
nitrogen (C/N) feed ratios, heterotrophic bacteria assimilate ammonianitrogen directly from the water, replacing the need for an external fixed
film biofilter. As a result, build-up of suspended solids may become the
second limiting factor after dissolved oxygen. This paper reviews two
nitrogen conversion pathways used for the removal of ammonia-nitrogen
in aquaculture systems; autotrophic bacterial conversion of ammonianitrogen to nitrate nitrogen, and heterotrophic bacterial conversion of
ammonia-nitrogen directly to microbial biomass. The first part of this
study reviews these two ammonia removal pathways, presents a set of
balanced stoichiometric relationships, and discusses their impact on water
quality. In addition, microbial growth energetics are used to characterize
production of volatile and total suspended solids for autotrophic and
heterotrophic systems. A critical verification of this work was that only
a small fraction of the feed’s carbon content is readily available to the
heterotrophic bacteria. For example, feed containing 35% protein (350 g/
kg feed) has only 109 g/kg feed of labile carbon. In the paper’s second
part, the results of a study on the impact C/N ratio on water quality is
presented. In this experimental trial sufficient labile organic carbon
in the form of sucrose (sugar) was added daily at 0%, 50%, and 100%
of the system feeding rate to three prototype zero-exchange systems.
The system was stocked with marine shrimp (Litopenaeus vannamei)
at modest density (150 /m2) and water quality was measured daily.
Significant differences were seen between the three strategies in the key
water quality parameters of ammonia-nitrogen, nitrite-nitrogen, nitratenitrogen, pH, and alkalinity. The control (0%) system exhibited water
quality characteristics of a mixed autotrophic/heterotrophic system while
the other two systems receiving supplemental organic carbon (50% and
100%) showed water quality characteristics of pure heterotrophic systems.
Introduction
The three pathways for the removal of ammonia-nitrogen in traditional
aquaculture systems are: photoautotrophic (algae), autotrophic bacterial
conversion from ammonia-nitrogen to nitrate nitrogen, and heterotrophic
bacterial conversion from ammonia-nitrogen directly to microbial
biomass, a more recent management method. Traditionally, pond
aquaculture has used photoautotrophic algae-based systems (greenwater
systems) to control inorganic nitrogen buildup. In intensive recirculating
64
International Journal of Recirculating Aquaculture, Volume 10, June 2009
Analysis of bacterial control of ammonia-nitrogen in shrimp production systems
aquaculture production systems, large fixed-cell bioreactors are routinely
used that rely on the nitrification of ammonia-nitrogen to nitratenitrogen by ammonia oxidizing bacteria (AOB) and nitrite oxidizing
bacteria (NOB) (Timmons and Ebeling 2007). In intensive recirculating
systems, the growth of heterotrophic bacteria and the accumulation of
organic carbon and nitrate are minimized intentionally through the rapid
removal of solids from the system and through water exchange. It has
been demonstrated that for zero-exchange pond production systems, the
inorganic nitrogen build-up can be controlled by the manipulation of
the organic carbon/nitrogen (C/N) ratio in such a way to promote the
growth of heterotrophic bacteria (Avnimelech 1999, 2009). McIntosh
(2001) demonstrated that heterotrophic bacteria assimilated the ammonianitrogen directly from the water column, producing cellular protein
in a marine shrimp pond system. As an additional benefit, for some
aquaculture species (marine shrimp and tilapia), this bacterial biomass
can be an important source of feed protein, thus reducing the cost of
production and improving the overall production economics (McIntosh
1999, Moss 2002).
In the last few years, research has demonstrated that low water exchange
marine shrimp production systems can be technically feasible (Ebeling
and LaFranchi 1990, Santos and Ebeling 1990). Large-scale pond
production systems for marine shrimp have been demonstrated that are
zero-exchange and are dominated by photoautotrophic algae (Hopkins et
al. 1996, Avnimelech et al. 1994). Management of these systems has been
improved by supplementing the shrimp feed with additional feeding of
organic labile carbonaceous substrate to support and enhance microbial
metabolism (Avnimelech 1999, 2009; McIntosh 1999). Several attempts
have been made to develop technology for recirculating marine shrimp
production systems at high densities (Weirich 2002, Otoshi 2003, Davis
and Arnold 1998, Van Wyk 1999), although it should be noted that in
addition to algae and bacterial biomass each of these also incorporated
some form of fixed-film biofiltration.
In reviewing the literature on zero-exchange systems, there was usually
no description of the pathways employed for ammonia removal and
whether the removal was fundamentally photoautotrophic, autotrophic, or
heterotrophic bacterial based, or in reality some mixture of the three. One
exception was work done by Brune et al. (2003) who examined simplified
International Journal of Recirculating Aquaculture, Volume 10, June 2009
65
Analysis of bacterial control of ammonia-nitrogen in shrimp production systems
microbial growth fundamentals to analyze and compare conventional and
heterotrophic techniques to the use of high rate photosynthetic systems.
That paper presents a short review of two of these three pathways for the
removal of ammonia-nitrogen and the results of a study conducted on
the impact of C/N ratio on water quality. In these trials, supplemental
carbon beyond that found in the feed in the form of sucrose (sugar) was
added daily at 0%, 50%, and 100% of the shrimp feeding rate to three
prototype zero-exchange systems. Every attempt was made to minimize
photoautotrophic processes by shading the three systems with two layers
of shade cloth (blocking 90% of the sunlight) and by high concentrations
of total suspended solids (TSS). Although not measured at the time due to
a limitation on resources, it was assumed that the role of photoautotrophic
bacteria was minor in comparison to the heterotrophic and autotrophic
bacteria populations. Thus, only the autotrophic and heterotrophic
bacterial pathways were considered in the analysis.
Background: metabolic pathway for 1 kg feed (35% protein)
What follows is a short description of the metabolic pathway options for
1 kg of 35% protein feed and their impacts on water quality parameters.
Ebeling et al. (2006) developed a set of stoichiometric relationships for
the three pathways and discussed their impact on water quality. Based on
these relationships, the fate of nitrogen can be determined for aquaculture
systems without organic carbon supplementation and with varying
degrees of added organic carbon.
Autotrophic/Heterotrophic bacteria – no carbon supplementation
If we examine a simple zero-exchange system with no supplemental
organic carbon addition, the solids remain in the production tank and all
of the organic carbon from decomposing feed and fecal matter is available
to the heterotrophic bacteria (Figure 1). Normally in recirculating
systems, uneaten feed and fecal matter containing organic carbon is
quickly removed from the production system to prevent growth and build
up of heterotrophic bacteria. In recirculating systems, heterotrophic
bacteria are detrimental; in zero-exchange systems heterotrophic
bacteria can be beneficial. Since the growth rate of heterotrophic
bacteria is significantly higher than that of autotrophic bacteria (Table
1) it is assumed that the heterotrophic bacteria will initially dominate
the metabolism of ammonia-nitrogen until the organic carbon source
66
International Journal of Recirculating Aquaculture, Volume 10, June 2009
Analysis of bacterial control of ammonia-nitrogen in shrimp production systems
Given: 1 kg of feed @ 35% protein
Ammonia-nitrogen production:
1 kgfeed * [0.35 g protein/g feed * 0.16 g nitrogen/g protein * 0.90 excreted]
= 50.4 g NH3-N
______________________________________________________________________
Heterotrophic System: Organic Carbon from Feed
1 kg
* 0.36 kg BOD/kg feed * 0.40 kg VSSH/ kg BOD =
feed
= 144 g VSSH
0.124 g NH/g VSSH
0.531 g CH/g VSSH
17.9 g NVSS
76.5 g CVSS
+ 47.1 g CCO2 = 123.6 g Clabile
108.2 g Cfeed 15.3 g Calk
______________________________________________________________________
Excess Ammonia-nitrogen:
50.4 g NH3-N - 17.9 g NVSS = 32.5 g NA
______________________________________________________________________
Autotrophic System: Inorganic Carbon from Alkalinity
32.5 g N * 0.20 g VSS/ g N
= 6.5g VSSA
0.124 g NA/g VSSA
0.80 g NVSS
0.531 g CA/g VSSA
3.45 g CVSS
+ 55.8 g Calk
Figure 1. Zero-exchange system with no carbon supplementation, organic
carbon for the heterotrophs from the feed and inorganic carbon for the
autotrophs from alkalinity.
International Journal of Recirculating Aquaculture, Volume 10, June 2009
67
Analysis of bacterial control of ammonia-nitrogen in shrimp production systems
becomes the limiting factor. The remaining ammonia-nitrogen not
assimilated by the heterotrophic bacteria will then be assimilated by the
autotrophic bacteria using alkalinity as an inorganic carbon source.
For this analysis, marine shrimp are being grown. For every kg of feed at
35% protein, approximately 50.4 g of ammonia-nitrogen will be generated
(Timmons and Ebeling 2007, Brune et al. 2003). This was estimated
based on the chemical composition of protein (0.16 g nitrogen per g of
protein) and that 90% of the nitrogen is being excreted by the shrimp,
(Brune et al. 2003) or:
1 kgfeed * [0.35 g protein/g feed * 0.16 g N/g protein * 0.90 excreted] =
50.4 g NH3-N
By comparison, for finfish only 60 to 70% of the nitrogen is excreted into
the water column. One of the difficulties in this analysis was determining
the fraction of the organic carbon that was available to the heterotrophic
bacteria. It is straightforward to measure the carbon content of feed
(approximately 40 to 50%), but as will be shown later, only a fraction
of the organic carbon not metabolized by the shrimp is available to the
bacteria. Thus, an estimate was made of the organic carbon utilized by
the bacteria by estimating the organic carbon sequestered in the volatile
suspended solids (VSS) generated by the bacteria and their known carbon
content. It has been shown that the biochemical oxygen demand (BOD)
content of typical aquaculture feeds is approximately 60% of the dry
weight and approximately 0.30 to 0.36 kg BOD per kg of feed is excreted
into the water column (Zhu and Chen 2001, Brune et al. 2003). Using
a yield fraction of 0.40 kg VSSH (Heterotrophic) per kg BOD (Avnimelech
1999, Brune et al. 2003) and a BODexcreted content of 0.36 kg per kg
feed, suggests that a kg of feed should generate approximately 144 g of
VSSH. Since bacterial biomass contains 53.1% C and 12.3% N based
on its stoichiometry (Ebeling et al. 2006), this heterotrophic microbial
biomass would assimilate approximately 17.9 g nitrogen and 76.5 g of
organic carbon. In addition in the research trials conducted by the author,
the long-term ratio of VSS to TSS for an autotrophic/heterotrophic
system was found to average about 0.72. Thus, approximately 200 g of
heterotrophic bacterial TSSH are produced for every kg of feed fed into a
system.
68
International Journal of Recirculating Aquaculture, Volume 10, June 2009
Analysis of bacterial control of ammonia-nitrogen in shrimp production systems
Note that since only 36% of the nitrogen is assimilated into cell mass
by the heterotrophic bacteria, the remaining nitrogen (32.5 g N) is thus
available to the autotrophic bacterial population. Using a yield fraction
of 0.20 g VSSA (Autotrophic)/g N (Table 1) produces 6.5 g VSSA from 1 kg
of feed. Using the same C/N ratios listed previously yields 0.80 g of
nitrogen and 3.45 g of carbon assimilated by the autotrophic microbial
biomass from 1 kg of feed @ 35% protein. Thus only 0.80 g of nitrogen is
incorporated into the autotrophic bacteria, and the remaining is excreted
as nitrate-nitrogen. Using the same ratio of TSS to VSS listed previously,
only 9.0 g of TSSA for every kg of feed is produced by the autotrophic
bacteria. Combining the two forms of TSS yields a total of 209 g TSS
produced per kg feed. It is interesting to note that only about 1.6% of
the available nitrogen is actually contained in the autotrophic microbial
biomass and about 36% in the heterotrophic microbial biomass. In
addition, the mass of heterotrophic bacteria is more than twenty times the
mass of the autotrophic bacteria produced.
It is somewhat more difficult to follow carbon consumption, since the
carbon source can be either organic carbon from the feed (heterotrophic)
or inorganic carbon from alkalinity (autotrophic). Using the stoichiometric
relationships developed in Ebeling et al. (2006), the total carbon
consumed by the heterotrophic process is 123.5 g C, divided between
organic carbon (108.2 g Cfeed) metabolized directly by the heterotrophic
bacteria and the depletion of alkalinity, which provides the source of
the remaining inorganic carbon consumed (15.3 g Calkalinity). All of the
inorganic carbon consumed by the autotrophic bacteria (55.8 g Calkalinity)
comes from alkalinity. Thus a total of 179.3 g of C per kg of feed is
consumed by this pathway. This is divided between organic carbon (108.2
g Cfeed) and alkalinity carbon (71.1 g Calkalinity) or 293 g of alkalinity as
CaCO3. Thus, if feed contains on average approximately 40% to 50%
carbon, then only about 25% of that organic carbon is available to the
heterotrophic bacteria as labile carbon. In addition, 220 g of oxygen are
consumed and 363 g of carbon dioxide are produced.
The percent protein content of feed determines the ratio of autotrophic
versus heterotrophic removal of ammonia-nitrogen. This is because of
the direct relationship between protein content and quantity of ammonianitrogen that is generated and that only a fixed quantity of labile carbon is
available from the feed. Using the same procedure as outlined previously,
the ratio of autotrophic and heterotrophic removal was calculated for a
International Journal of Recirculating Aquaculture, Volume 10, June 2009
69
Analysis of bacterial control of ammonia-nitrogen in shrimp production systems
Heterotrophic Bacteria
100%
Autotrophic Bacteria
83%
Removal of Ammonia-Nitrogen
80%
77%
75%
72%
69%
64%
62%
59%
60%
50%
50%
41%
38%
40%
36%
31%
28%
25%
23%
17%
20%
0%
12.4%
15%
20%
25%
30%
35%
40%
45%
50%
55%
Protein
Figure 2. Percent removal of ammonia-nitrogen by heterotrophic or
autotrophic processes as a function of % protein.
range of protein content in the feed (Figure 2). This figure shows that as
the protein content of the feed increases, the percent removal of ammonianitrogen by the autotrophic pathway increases from complete removal
by heterotrophic bacteria at 12.4% protein content to 75% removal of
ammonia-nitrogen by the autotrophic pathway at 50% protein content.
Heterotrophic bacteria – carbon supplementation
Consider next a zero-exchange system where organic carbon is added
to make up the difference between what is available from the feed and
the total demand by the heterotrophic bacteria for complete conversion
of all available nitrogen (Figure 3). From the above analysis, 32.5 g of
nitrogen needs to be consumed by the additional heterotrophic bacteria
from the supplemental organic carbon source. From Table 1, 8.07 g VSSH
per g of N are produced, thus an additional 262 g VSSH are generated
by the supplemental carbon. This additional VSSH requires 225 g of
carbon, divided between organic carbon (197 g CS (Substrate)) metabolized
by the heterotrophic bacteria and the depletion of inorganic carbon (28
g Calkalinity). Thus the total VSSH generated is 406 g per kg feed. The
research described later in this paper found a TSS to VSS ratio of 81%,
70
International Journal of Recirculating Aquaculture, Volume 10, June 2009
Analysis of bacterial control of ammonia-nitrogen in shrimp production systems
which then suggests a total TSSH production of 500 g for every kg of feed.
Thus a total of 349 g of C per kg of feed is consumed by this pathway,
with the heterotrophic bacteria metabolizing all available organic carbon
from the feed (109 g Cfeed) and the supplemental organic carbon (197 g
CS) added to the system. In this case sucrose (C12H22O11) at 42% carbon
was used requiring 470 g sucrose per kg feed. Concurrently, inorganic
carbon as alkalinity was depleted (43.3 g Calkalinity) or 180 g of alkalinity
as CaCO3. In addition 220 g of oxygen are consumed and 486 g of carbon
______________________________________________________________________
Heterotrophic System: Organic Carbon from Feed
1 kg
* 0.36 kg BOD/kg feed * 0.40 kg VSSH/ kg BOD =
feed
= 144 g VSSH
0.124 g NH/g VSSH
17.9 g NVSS
0.531 g CH/g VSSH
76.5 g CVSS
+ 47.1 g CCO2 = 123.6 g Clabile
108.2 g Cfeed 15.3 g Calk
______________________________________________________________________
Excess Ammonia-nitrogen:
50.4 g NH3-N - 17.9 g NVSS = 32.5 g NA
______________________________________________________________________
Heterotrophic System: Supplemental Organic Carbon
32.5 g N * 8.07 g VSSH / g N
= 262 g VSSH
0.124 g NH/g VSSH
0.531 g CH/g VSSH
32.5 g NVSS
139 g CVSS
+ 85.5 g CCO2 = 224.5 g Clabile
196.7 g Cs
27.8 g Calkalinity
Carbohydrate is 40% Carbon ⇒ 492 g carbs
______________________________________________________________________
Figure 3. Zero-exchange system with supplemental carbon addition of
approximately 50% carbohydrate addition for 35% protein feed yielding a C/N
ratio of approximately 13.0.
International Journal of Recirculating Aquaculture, Volume 10, June 2009
71
Analysis of bacterial control of ammonia-nitrogen in shrimp production systems
Autotrophic
Heterotrophic
4.28 g C/g N
4.28 g C/g N
0.16 g VSSA / g BOD
0.4 g VSSH / g BOD
g VSS/g N:
0.20 g VSSA /g N
8.07 g VSSH / g N
g VSS/g C:
0.12 g VSSA /g C
1.33 g VSSH / g Cs
----
0.56 g VSSH / g sucrose
4.18 g O2 / g N
1.69 g C/ g N
7.05 g Alk/ g N
4.71 g O2 / g N
6.07 g CS/ g N
3.57 g Alk/ g N
5.85 g CO2/ g N
9.65 g CO2/ g N
0.976 g NO3-N/g N
----------
1 day -1
5 day -1
0.05 day -1
0.05 day -1
C/N Ratio:
Yield (Y)
g VSS/g BOD*:
(range)
g VSS/g sucrose:
(0.1 – 0.3)
(0.4 – 0.8)
Consumption
g O2/g N:
g C/g N:
g Alk (CaCO3)/g N:
Production
g CO2/g N:
g NO3-N/g N:
Kinetic Rates*
µ, specific growth rate
(range)
kd, endogenous
respiration (range)
(0.4 – 2.0)
(0.03 – 0.06)
(2 – 10)
(0.025 – 0.075)
Cs is carbon in substrate, i.e. carbohydrates or labile carbon in feed
*Metcalf and Eddy 2003.
Table 1. Comparison of autotrophic and heterotrophic bacterial in terms of
production and consumption based on the stoichiometry (modified from Ebeling
et al. 2006).
72
International Journal of Recirculating Aquaculture, Volume 10, June 2009
Analysis of bacterial control of ammonia-nitrogen in shrimp production systems
dioxide are produced, while 237 g of oxygen (50.4 g NH3-N x 4.71 g
oxygen per g of nitrogen produced) are consumed and 486 g of carbon
dioxide are produced.
MaterialS and methods
The two pathways for nitrogen removal are very different in terms
of substrate utilization, bacterial biomass generated, and by-products
produced. The difficulty in practical application is that both may be
present to some degree depending upon the availability of inorganic and
organic carbon. The ability to control the C/N ratio by feed formulation,
solids removal, or addition of organic carbon allows the aquaculture
producer to manage what type of system is used. To examine this
potential, a study was conducted where supplemental organic carbon
in the form of the carbohydrate (sucrose) was added daily at 0%, 50%
and 100% of the shrimp feed rate to three prototype zero-exchange
systems. These systems had been operated for several months as marine
shrimp juvenile production systems and all had well-developed and
stable bacterial communities. The three systems were stocked with 675
Litopenaeus vannamei marine shrimp at a density of 150/m2 with an
initial average weight of 3.60 g.
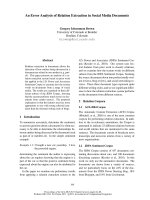
Juvenile Production System
The juvenile production system (Figure 4) consisted of rectangular
fiberglass tanks, measuring 1.22 m x 3.66 m x 0.76 m (4 ft x 12 ft and
30 in). Water depth was maintained at 61 cm (24 in) with an outside
standpipe. Outside standpipes, 5 cm (2 in) in diameter were used to
manage water removal and control water depth. A 7.6 cm (3 in) PVC
drain line pipe was used to remove water or to harvest shrimp in bulk. In
addition, a 1/4 in PVC mesh screen was placed at the discharge from the
tanks. Tanks were initially covered with 1/4 in PVC mesh tops, but shade
cloth was added within the first week to help reduce stress on the juvenile
shrimp and limit growth of photoautotrophic algae.
Two titanium, 1.8 kW, 240 VAC bayonet style heaters were mounted in
each tank to maintain system temperature at approximately 30 ± 2ºC.
Aeration in the tanks was provided by four 5 x 30 cm (2x12 in) air stones
and two 3.66 m (12 ft) lengths of aeration hose on each side of the bottom
of each tank. The aeration hose provided good mixing by creating two
International Journal of Recirculating Aquaculture, Volume 10, June 2009
73
Analysis of bacterial control of ammonia-nitrogen in shrimp production systems
counter-rotating cells along the long axis of the tank. Additional air stones
were used when needed to maintain dissolved oxygen levels above target
levels of 4.0 mg/L. Two automatic vibratory feeders hung above the tanks
dispensed feed every 2 hours from 8 am to 10 pm. Fresh water was added
as needed to make up for evaporation and other minor losses. A clarifier
(Figure 4) was used to harvest suspended solids from the tank when the
TSS approached 450 mg/L. Figure 5 shows the weekly average weight of
a sample of approximately 50 to 100 animals. Over the first four weeks of
Figure 4. Three
juvenile shrimp
production
tanks showing
automatic
feeders and
solids
management
clarifier.
12.0
Grams
10.0
8.0
6.0
Control
50% C Demand
Mean Weight (gms) .
100% C Demand
4.0
2.0
0
10
20
30
Days
40
50
60
70
Figure 5. The mean weekly weights of the marine shrimp showing an average
growth rate of 0.90 g/week.
74
International Journal of Recirculating Aquaculture, Volume 10, June 2009
Analysis of bacterial control of ammonia-nitrogen in shrimp production systems
growout, survival averaged 90% in the three tanks with an average feed
conversion ratio (FCR) of 1.8. During this phase of research, the shrimp
were seen primarily as ‘food processors’ for conversion of the feed to
either small organic particles or fecal matter.
Water quality analysis
Dissolved oxygen, temperature, and salinity were measured daily between
the hours of 0800 to 0900 h. At the same time, grab samples were taken
and filtered through 8 - 12 µm filter paper (506-59 filter paper, Hach
Company, Loveland, CO, USA) with the filtrate then used to determine
dissolved constituent concentrations, TAN, nitrite-nitrogen, nitratenitrogen, pH, and alkalinity. In addition, daily samples were also analyzed
for TSS and VSS. Weekly samples were analyzed for total organic carbon
and total nitrogen. Standard methods were routinely used and, where
appropriate, primary standards were analyzed along with the samples for
quality assurance (Table 2).
Parameter
Method / Range
DO / Temperature
Salinity / Conductivity
Hach Model 58 Dissolved Oxygen Meter
Hach Model 33 S-C-T Meter
Hach Method 8038 Nessler Method
0 – 2.50 mg/L NH3-N
Hach Method 8507 Diazotization Method
0 – 0.300 mg/L NO2- -N
Hach Method 8039 Cadmium Reduction Method
0.0 – 30.0 mg/L NO3- - N
Nitrogen – Ammonia*
Nitrogen –Nitrite*
Nitrogen -Nitrate
Total Organic Carbon
Hach Method 10173 Direct Method 15 to 150 mg/L as C
Alkalinity+
Hach Method 10071 Persulfate Digestion Method
0 to 25.0 mg/L - N
Standard Methods 2320B as CaCO3
Total Suspended Solids
Standard Methods 2540D
Total Volatile Solids
Standard Methods 2540E
Total Nitrogen
*US-EPA approved for reporting, +Adapted from Standard Methods for the
Examination of Water and Wastewater (APHA, 1998)
Table 2. Laboratory methods used for analysis via titration and Hach DR/2500
colorimeter.
International Journal of Recirculating Aquaculture, Volume 10, June 2009
75
Analysis of bacterial control of ammonia-nitrogen in shrimp production systems
Results
Water quality
Water quality data for the three treatments over the research period
is presented in Table 3. Overall water quality in all three systems was
maintained within the range for optimal shrimp growth and survival.
Note the substantial difference in nitrate-nitrogen (54.7 versus 7.7 mg/L)
and alkalinity (183 versus 328 mg/L) between the control system and the
two systems receiving supplemental carbon. Figures 6 through 9 show the
impact of the three treatments (control, sucrose at 50% and 100% of feed
rate) on TAN, NO2-N, NO3-N, and alkalinity over the 10-week research
period.
There was a substantial difference in nitrate-nitrogen, alkalinity, and pH
for the three treatments. Since the control tank received no supplemental
organic carbon, it should exhibit water quality that is a combination of a
heterotrophic and autotrophic system. For example, Table 1 shows a lower
mean pH for the control versus the two other treatments, which would
be expected in an autotrophic system because of the alkalinity reduction
due to H+ production. The impact of the autotrophic bacteria is especially
apparent in Figures 8 and 9, with the increase of nitrate-nitrogen and the
rapid decline in alkalinity. The alkalinity became so low that sodium
bicarbonate was added on day 58 to increase it above the minimum
recommended level of 150 mg/L (Timmons and Ebeling 2007). In all
three systems, TAN increased slowly over the research trial, but was never
higher than 1.5 mg/L –N. For the control, nitrite-nitrogen was typically
less than 0.1 mg/L, although it reached a maximum of 0.2 mg/L near the
end of the 10 week research period.
Table 3. Average water quality for the three treatments over the study period.
Water
DO
parameter
76
Temp Salinity
pH
TAN
NO2-N NO3-N Alkalinity
(mg/L)
(Cº)
(ppt)
(mg/L) (mg/L) (mg/L)
Control
6.1
29.5
4.8
7.78
1.15
0.13
54.7
183
StDev:
0.4
0.5
0.4
0.20
1.06
0.16
29.0
49
50% of Feed
5.7
29.8
4.5
8.15
1.06
0.39
7.7
328
StDev:
0.9
0.9
0.4
0.14
0.26
1.02
3.3
22
100% of Feed:
5.3
29.4
4.7
8.19
1.36
0.61
1.9
360
StDev:
1.5
0.2
0.2
0.18
0.81
1.13
0.8
24
International Journal of Recirculating Aquaculture, Volume 10, June 2009
(mg/L)
Analysis of bacterial control of ammonia-nitrogen in shrimp production systems
Both treatments (50% and 100% of feed as carbohydrate) exhibited
similar pH values. The pH decreased slightly during the initial startup phase, then increased and finally remained constant throughout the
trial around a pH of 8.3. The direct conversion of ammonia-nitrogen to
bacterial biomass in these systems is demonstrated in Figure 8, where the
nitrate-nitrogen concentrations are either very low or at barely detectable
limits. The limited number of autotrophic bacteria implies that very
small quantities of nitrite-nitrogen or nitrate-nitrogen is produced. The
higher than expected nitrite-nitrogen concentrations in the 50% of feed
as sucrose (Figure 7) might be explained by a limited population of
autotrophic bacteria that are inhibited by the high carbon/nitrogen ratios
in the system from completing the conversion of TAN to nitrate (Zhu
and Chen 2001, Michaud et al. 2006). Near the end of the growout, the
concentration of nitrite-nitrogen was significantly reduced, although it
should be noted that at no time was the concentration high enough to
have any significant impact on the marine shrimp juveniles. The fact that
the alkalinity (Figure 9) increased and then remained constant during
the growout trial is unexplained. Theoretically, alkalinity should be
consumed by the heterotrophic bacteria, although at a much lower rate
than for an autotrophic system. One explanation might be the recovery
2.0
Control
50% of Feed
100% of Feed
TAN
1.5
1.0
TAN (mg/L)
0.5
0.0
0
10
20
30
40
Days
50
60
70
80
Figure 6. TAN for the three treatments (control, sucrose at 50% and 100% of
feed rate) over the 10 week research period.
International Journal of Recirculating Aquaculture, Volume 10, June 2009
77
Analysis of bacterial control of ammonia-nitrogen in shrimp production systems
0.50
Control
50%of Feed
100% of Feed
Nitrite-nitrogen
0.40
0.30
0.20
Nitrite-nitrogen (mg/L) .
0.10
0.00
0
10
20
30
40
Days
50
60
70
80
Figure 7. Nitrite-nitrogen for the three treatments (control, sucrose at 50% and
100% of feed rate) over the 10 week research period.
100
Control
50% of feed
Nitrite-nitrogen
80
100% of feed
60
40
Nitrogen
20 Concentration (mg/L) .
0
0
10
20
30
40
Days
50
60
70
80
Figure 8. Nitrate-nitrogen for the three treatments (control, sucrose at 50% and
100% of feed rate) over the 10 week research period.
78
International Journal of Recirculating Aquaculture, Volume 10, June 2009
Analysis of bacterial control of ammonia-nitrogen in shrimp production systems
400
350
)3 .
Alkalinity (CaCO3)
300
250
200
Alkalinity
(mg/L Control
CaCO
150
50% C Demand
100% C Demand
100
50
0
10
20
30
40
Days 50
60
70
80
Figure 9. Alkalinity as CaCO3 for the three treatments (control, sucrose at 50%
and 100% of feed rate) over the 10 week research period.
of alkalinity during some limited denitrification that may have occurred.
Denitrification might be occurring in the interior of the large floc
particles, where oxygen would be limited and anoxic conditions would
prevail, which would potentially cause denitrification.
Mathematical model
A simple model to predict VSS and TSS concentrations in the three
systems was written using an EXCEL® spreadsheet (Microsoft Office,
Redmond, WA, USA). The three systems were modeled as a mixed
autotrophic/heterotrophic system (control) and as a pure heterotrophic
system (50% and 100% of feed as sucrose). As was shown earlier, the
amount of sucrose required to fulfill the carbon requirement to consume
all of the ammonia-nitrogen produced by the feed is approximately 470
g sucrose / kg feed, or 47% of the feed as sucrose. As a result, the system
supplemented with 50% of feed as sucrose should be a pure heterotrophic
system, the system supplemented with 100% of feed as sucrose should be
overdosed, and the effect on resulting TSS is unknown.
International Journal of Recirculating Aquaculture, Volume 10, June 2009
79
Analysis of bacterial control of ammonia-nitrogen in shrimp production systems
In the case of the control, the model:
l allocated the daily feed organic carbon to heterotrophic bacterial
production,
l calculated VSSH
[VSSH = feed g/m3 day * 0.36 g BOD/g feed * 0.40 g VSSH / g BOD],
l calculated amount of ammonia-nitrogen assimilated in the VSSH
[TANH = 0.123 * VSSH],
l subtracted TANH from the daily TANfeed produced
[TANfeed = feed g/m3 day * (0.35 * 0.16 * 0.9)],
l allocated excess ammonia-nitrogen to autotrophic bacterial
consumption [TANA= TANfeed – TANH],
l
determined VSSA [VSSA = TANA * 0.20 g VSSA/g N],
l calculated total VSS and TSS.
In the case of 50% of feed as sucrose, the model:
l allocated the daily feed carbon to heterotrophic bacterial
production,
l calculated VSSH
[VSSH = feed g/m3 day * 0.36 g BOD/g feed * 0.40 g VSSH / g BOD],
l calculated amount of ammonia-nitrogen sequestered in the VSSH
[TANH = 0.123 * VSSH],
l
subtracted from the daily TANfeed produced
[TANfeed = feed g/m3 day * (0.35 * 0.16 * 0.9)],
l allocated excess ammonia-nitrogen to additional heterotrophic
bacterial production [TANH+= TANfeed – TANH],
l determined VSSH+ [VSSH+ = 8.07 g VSSH /g N * g N],
l calculated total VSS and TSS.
Finally in the case of 100% feed as sucrose, it was observed that
significant quantities of TSS were produced in excess of the available
nitrogen. Thus the assumption was made that somehow there was
sufficient nitrogen in the water column to react with all of the available
carbon from the sucrose.
80
International Journal of Recirculating Aquaculture, Volume 10, June 2009
Analysis of bacterial control of ammonia-nitrogen in shrimp production systems
In the case of 100% of feed as sucrose, the model:
l allocated the daily feed carbon to heterotrophic bacterial
production,
l calculated VSSH
[VSSH = feed g/m3 day * 0.36 g BOD/g feed * 0.40 g VSSH / g BOD],
l assumed all of the sucrose carbon was converted into bacterial
biomass [VSSH+ = g sucrose/m3 day * 0.56 g VSSH/g sucrose],
l calculated total VSS and TSS.
In each case, the TSS values were estimated based on the long term
average of the measured ratio of TSS to VSS determined during the
course of this research period for the heterotrophic system.
The results of these models are shown in Figures 10 through 12. Figure
10 shows excellent agreement between the model and the actual measured
TSS concentrations. The saw-tooth nature of the TSS data reflects the
periodic harvesting of bacterial biomass using a cone-bottom clarifier.
The model was restarted after each harvest of biomass from the tank
using the experimentally determined TSS value for the starting point.
The control tank required solids culling approximately every three weeks
in order to maintain tank TSS concentrations below 450 mg/L.
550
TSS concentration
450
350
TSS (mg/L)
250
150
Experimental TSS
Model TSS
50
0
10
20
30
40
50
60
70
Days
Figure 10. Predicted and measured TSS concentration for an autotrophic /
heterotrophic system without carbon supplementation with periodic harvesting
of excess bacterial biomass.
International Journal of Recirculating Aquaculture, Volume 10, June 2009
81
Analysis of bacterial control of ammonia-nitrogen in shrimp production systems
600
TSS concentration
500
400
300
TSS (mg/L)
200
Experimental TSS
100
Model TSS
0
0
10
20
30
Days
40
50
60
70
Figure 11. Predicted and measured TSS concentration for a heterotrophic
system with carbon supplementation at 50% of feed rate as sucrose and
periodic harvesting of excess bacterial biomass.
700
TSS concentration
600
500
400
TSS300
(mg/L)
200
Research TSS
100
Model TSS
0
0
10
20
30
Days
40
50
60
70
Figure 12. Predicted and measured TSS concentration for a heterotrophic
system with excess carbon supplementation at 100% of feed rate as sucrose and
periodic harvesting of excess bacterial biomass.
82
International Journal of Recirculating Aquaculture, Volume 10, June 2009
Analysis of bacterial control of ammonia-nitrogen in shrimp production systems
Figure 11 reflects what would occur if sufficient carbon supplementation
was available to completely convert all metabolic ammonia-nitrogen to
bacterial biomass. The model predictions and the observed data agree
quite closely, although in some cycles the model tended to over predict
TSS values as a solids harvesting event was about to occur. Due to the
rapid production of biomass, the production system was culled of excess
bacteria on average every ten days.
The results of excess carbon supplementation (100% of feed as
carbohydrate), in this case twice what is stoichiometrically required, is
shown in Figure 12. The assumption that there was sufficient nitrogen
to react with all of the available carbon from the sucrose appears to be
verified in this instance. The source of this nitrogen, which is beyond
that provided by the shrimp feed, is unknown. One of the problems with
excess carbon supplementation is the large quantity of bacterial biomass
that is generated, requiring frequent (every five days) harvesting of excess
biomass.
Dissolved organic carbon and total nitrogen
Figure 13 shows the dissolved organic carbon (DOC) concentration in
the three treatments over the ten week research trial. As can be seen,
there appears to be no major difference in the DOC between treatments
and there was a consistent increase in the DOC over the growout period.
This is probably the result of the gradual buildup in all the systems of
humic substances, the ‘tea’ color seen in intensive recirculation systems
that accumulates when ozone or UV is not used to remove it. Humic
substances correspond to the non-biodegradable part of the dissolved
organic carbon and are not available as a carbon source to the bacteria.
Humic substances are hydrophobic dissolved organic matter produced by
the auto-oxidation of polyunsaturated fatty acids released by fish feces,
uneaten feed, and the lysis of dead bacteria.
Figure 14 shows the results of a mass balance on nitrogen for the
autotrophic/heterotrophic system without carbon supplementation
and with periodic harvesting of excess bacterial biomass. The amount
of total nitrogen (Total Nitrogen - Model) was calculated using the
VSS concentrations predicted by the previously presented model and
assuming it contained 12.4% nitrogen based on the stoichiometry of
bacterial biomass. Total Nitrogen - Experimental Data represents the
International Journal of Recirculating Aquaculture, Volume 10, June 2009
83
Analysis of bacterial control of ammonia-nitrogen in shrimp production systems
140
Control
50% Feed
100% Feed
DOC concentration
120
100
80
60
DOC (mg/L-C) .
40
20
0
0
10
20
30
Days
40
50
60
70
Figure 13. Dissolved organic carbon (DOC) concentrations for the three
treatments (control, sucrose at 50% and 100% of feed rate) over the 10 week
research period.
300
Total Nitrogen - Model
Cumulative Total Nitrogen from Feed
Total Nitrogen - Experimental Data
Measured Total Nitrogen
Nitrogen (mg/L-N)
250
200
150
Nitrogen
100 (mg/L-N) .
50
0
0
10
20
30
Days
40
50
60
70
Figure 14. Mass balance on nitrogen for the autotrophic/heterotrophic system
without carbon supplementation and with periodic harvesting of excess
bacterial biomass.
84
International Journal of Recirculating Aquaculture, Volume 10, June 2009
Analysis of bacterial control of ammonia-nitrogen in shrimp production systems
250
Total Nitrogen - Model
Cumulative Total Nitrogen from feed
Total Nitrogen - Experimental Data
Measured Total Nitrogen
Nitrogen (mg/L-N) .
200
150
100
50
0
0
10
20
30
Days
40
50
60
70
Figure 15. Mass balance on nitrogen for the heterotrophic system with carbon
supplementation at 50% of feed rate as sucrose and periodic harvesting of
excess bacterial biomass.
sum of the nitrogen contained in the experimentally measured VSS plus
experimentally measured concentrations of TAN, NO2-N, and NO3-N.
The Measured Total Nitrogen is the sum of the nitrogen contained in the
experimentally-measured VSS plus the experimentally-measured Total
Nitrogen. Finally, the total nitrogen-feed is the estimated nitrogen content
of the feed (35% protein), 0.0504k g N/ kg feed.
In Figure 14, the stair step nature of total nitrogen can be seen as bacterial
biomass is removed from the system even as the cumulative total nitrogen
from the feed steadily increases. The experimentally measured value for
total nitrogen falls below the model for several possible reasons including
the difficulty in measuring nitrate-nitrogen accurately with the analysis
methods employed and the impact of denitrification, especially noticeable
near the end of the research period. The use of total nitrogen appears
to do a better estimation of the nitrogen and also shows a reduction
near the end of the research period, most likely due to denitrification.
Interestingly, over the growout period almost all the nitrogen remains in
the system.
International Journal of Recirculating Aquaculture, Volume 10, June 2009
85
Analysis of bacterial control of ammonia-nitrogen in shrimp production systems
Figure 15 shows the impact of carbon supplementation at 50% of the feed
as sucrose on the system with excess bacterial biomass and nitrogen being
periodically removed from the system. Since this is a pure heterotrophic
system, there is no nitrate-nitrogen created. Thus the system’s total
nitrogen remains at very low levels, fluctuating within a very narrow
range, even as the cumulative total nitrogen steadily increases. The system
supplemented at 100% of feed as sucrose showed similar characteristics,
except for a greater rate of increase in nitrogen per harvesting cycle and a
need for more frequent culling of biomass.
Conclusions
The pathways for nitrogen removal are very different in terms of substrate
utilization, bacterial biomass generated and by-products generated. Using
simple stoichiometry for autotrophic and heterotrophic bacteria, it is
possible to characterize and model the two pathways for nitrogen removal.
The difficulty in practice is that each bacterial pathway may be present
to some degree and the bacterial communities associated with each will
compete for the same substrate, possibly resulting in dominance by one
group over another. The ability to control the carbon to nitrogen ratio by
feed formulation, solids removal, or addition of organic carbon allows the
aquaculture producer to manage what type of system is created.
Acknowledgements
This work was supported by the United States Department of Agriculture,
Agricultural Research Service under Cooperative Agreement number
59-1930-1-130 and Magnolia Shrimp, LLC, Atlanta, GA, USA. Special
thanks to Carla Welsh and Kata Rishel for help with the water quality
analysis.
86
International Journal of Recirculating Aquaculture, Volume 10, June 2009
Analysis of bacterial control of ammonia-nitrogen in shrimp production systems
References
APHA 1998. Standard Methods for the Examination of Water and Wastewater, 18th ed. American Public Health Association, American Water
Works Association, Water Pollution and Control Federation: Washington, DC, USA.
Avnimelech, Y. Carbon/Nitrogen Ratio as a Control Element in Aquaculture Systems. Aquaculture 1999, 176:227-235.
Avnimelech, Y. 2004. Intensive Shrimp and Fish Ponds: Where We Are
and Where We are Heading. Proceedings of the Fifth International
Conference on Recirculating Aquaculture. Roanoke, VA, USA, 192200.
Avnimelech, Y. 2009. Biofloc Technology: A Practical Guide Book.
World Aquaculture Society, 182 p.
Avnimelech, Y., Kochva, M., and Diab, S. Development of Controlled
Intensive Aquaculture Systems with a Limited Water Exchange and
Adjusted C to N Ratio. Israel Journal of Aquaculture-Bamidgeh
1994, 46:119-131.
Brune, D.E., Schwartz, G., Eversole, A.G., Collier, J.A., and Schwedler,
T.E. Intensification of Pond Aquaculture and High Rate Photosynthetic Systems. Aquacultural Engineering 2003, 28:65-86.
Davis, D.A. and Arnold, C.R. The Design, Management and Production
of a Recirculating Raceway System for the Production of Marine
Shrimp. Aquacultural Engineering 1998, 17:193-211.
Ebeling, J.M. and LaFranchi, C. Results of Long-Term Weather and
Water Quality Monitoring at a Shrimp Pond Research Facility in
Hawaii. Presented at the World Aquaculture Society Meeting, June
1990, Halifax, Canada.
Ebeling, J.M., Timmons, M.B.. Bisogni, J.J., 2006. Engineering Analysis
of the Stoichiometry of Photoautotrophic, Autotrophic, and Heterotrophic Control of Ammonia-Nitrogen in Aquaculture Production
Systems. Aquaculture 257:346-358.
International Journal of Recirculating Aquaculture, Volume 10, June 2009
87