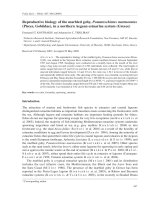
Denitrification processes in a zero discharge recirculating system
Bạn đang xem bản rút gọn của tài liệu. Xem và tải ngay bản đầy đủ của tài liệu tại đây (454.8 KB, 6 trang )
Aquacultural Engineering 39 (2008) 72–77
Contents lists available at ScienceDirect
Aquacultural Engineering
journal homepage: www.elsevier.com/locate/aqua-online
A novel approach to denitrification processes in a zero-discharge recirculating
system for small-scale urban aquaculture
Alon Singer a, Shmuel Parnes b, Amit Gross c, Amir Sagi b, Asher Brenner a,*
a
Department of Biotechnology Engineering and Unit of Environmental Engineering, Ben-Gurion University of the Negev, P.O. Box 653, Beer-Sheva 84105, Israel
Department of Life Sciences and the National Institute for Biotechnology in the Negev, Ben-Gurion University of the Negev, P.O. Box 653, Beer-Sheva 84105, Israel
c
Department of Environmental Hydrology & Microbiology, Zuckerberg Institute for Water Research, Jacob Blaustein Institutes for Desert Research,
Ben-Gurion University of the Negev, Sede Boqer Campus, Sede Boqer 84990, Israel
b
A R T I C L E I N F O
A B S T R A C T
Article history:
Received 6 December 2007
Accepted 28 July 2008
This paper presents an innovative process to solve the nitrate build-up problem in recirculating
aquaculture systems (RAS). The novel aspects of the process lie in a denitrification bioreactor system that
uses solid cotton wool as the primary carbon source and a unique degassing chamber. In the latter, the
water is physically stripped of dissolved gaseous O2 (by means of a Venturi vacuum tube), and the
subsequent denitrification becomes more efficient due to elimination of the problems of oxygen
inhibition of denitrification and aerobic consumption of cotton wool. The cotton wool medium also
serves as a physical barrier that traps organic particles, which, in turn, act as an additional carbon source
for denitrification. Operation in the proposed system gives an extremely low C/N ratio of 0.82 g of cotton
wool/g of nitrate N, which contributes to a significant reduction of biofilter volume. The additional
advantage of using solid cotton wool as the carbon source is that it does not release organic residuals into
the liquid to be recycled. Operation of the system over a long period consistently produced effluents with
low nitrate levels (below 10 mg N/l), and there was only a very small need to replace system water. The
overall treatment scheme, also incorporating an aerobic nitrification biofilter and a granular filtration
device, produced water of excellent quality, i.e., with near-zero levels of nitrite and ammonia, a
sufficiently high pH for aquaculture, and low turbidity. The proposed system thus provides a solution for
sustainable small-scale, urban aquaculture operation with a very high recovery of water (over 99%) and
minimal waste disposal.
ß 2008 Elsevier B.V. All rights reserved.
Keywords:
Urban
Backyard
Aquaculture
Sustainability
Zero-discharge
Recirculation
Denitrification
Nitrate
Bioreactor
Cotton wool
Degassing
1. Introduction
1.1. Recirculating aquaculture systems (RAS)
The aquaculture industry that began developing in the late
1960s has exploded into a major global industry of 60 million tons
a year, with huge annual revenues in excess of US$ 70 billion (FAO,
2006). With the current increase in environmental awareness and
the consequent stringency in environmental legislation, a new
approach to dealing with the ecological problems associated with
aquaculture has been developed—recirculating aquaculture systems . This approach was originally developed to provide a solution
to the environmental problems generated by the traditional pond
and flow-through aquaculture systems, since it enables the
treatment of polluted water within a closed loop, offers improved
* Corresponding author. Tel.: +972 8 6479029; fax: +972 8 6479030.
E-mail address: (A. Brenner).
0144-8609/$ – see front matter ß 2008 Elsevier B.V. All rights reserved.
doi:10.1016/j.aquaeng.2008.07.001
control of effluent discharge, and allows complete environmental
control (van Gorder, 1994; Shnel et al., 2002). Moreover, RAS
confers ecological and economic advantages in that it facilitates a
reduction in the amounts of water and energy required and
reduces land use. In addition, it provides growers with the
geographical freedom to set up aquaculture systems in ‘‘nontraditional’’ farming areas (Shnel et al., 2002); for example, small RAS,
such as the one presented in this study, producing lucrative
seafood species might be suitable for small-scale aquaculture for
food production in urban areas (Zohar et al., 2005). Thus, RAS could
contribute to meeting the demand for protein foods in highly
populated urban centers.
1.2. Biological nitrogen removal processes in aquaculture systems
Maintaining acceptable water quality currently constitutes the
main bottleneck in RAS (van Rijn, 1996; Menasveta et al., 2001).
The water quality parameters of greatest relevance in such systems
are ammonia, nitrite and nitrate. Although nitrate is considered the
A. Singer et al. / Aquacultural Engineering 39 (2008) 72–77
least toxic of the different inorganic nitrogen forms, various fishes
indigenous to soft water habitats and some commonly farmed
invertebrate species are susceptible to elevated nitrate levels (Tal
et al., 2003). While aerobic nitrification of ammonia and nitrite has
become a general standard in RAS, the resulting nitrate accumulation has not attracted sufficient attention, especially since the
build-up of nitrate necessitates the exchange of 10–20% of the
water each day to maintain adequate water quality. Currently used
designs to remove excess nitrate – although relatively effective –
are cumbersome, difficult to maintain, and hence expensive. Two
major problems characterize these systems: first, it is difficult to
control the exact amounts of soluble carbon compounds (such as
methanol) that have to be added to support bacterial growth (due
to fluctuations of water quantity and quality) and organic residuals
from these soluble carbon compounds may leach into and
contaminate the system water. Second, high levels of oxygen in
the process inflow (close to saturation due to intensive aeration of
the grow-out tanks) inhibit denitrification and cause excessive
consumption of the organic carbon applied, due to aerobic activity.
1.3. RAS denitrification biofilters
The problem of nitrate accumulation in RAS is not trivial, as
discussed above, and there is a need for currently used solutions to
be improved. The very few studies that have been conducted on
this problem have shown that there are a number of issues that
should be addressed. Asano et al. (2003) showed that it is possible
to decrease the amount of water used in the system simply by
providing the most basic biofilters. Menasveta et al. (2001)
employed methanol and ethanol as carbon sources and physical
oxygen removal from the anaerobic biofilter via gaseous N2. Suzuki
et al. (2003) did not employ any means to deoxygenate the water
and found that such technologies had to use an extremely large
denitrification biofilter. Vidal et al. (2002) drew attention to the
necessity to develop methods to reduce the dissolved oxygen on
the premise that they could be cost effective for achieving active
denitrification and higher removal efficiencies.
To date, cheap soluble substances, such as methanol, ethanol or
glucose, have usually been the materials of choice as the external
carbon source (Sauthier et al., 1998), but some studies have shown
certain residual concentrations of carbonaceous compounds in the
effluent, a finding that could be problematic for certain aquaculture species (Go´mez et al., 2000; Shnel et al., 2002). A number of
alternative materials have thus been tested. Soares et al. (2000), for
example, used solid cotton wool as the sole carbon source for the
treatment of well-water contaminated with high levels of nitrate.
Although almost total denitrification was obtained, the process
suffered operational problems, mainly due to clogging. The use of
an intrinsic source of carbon to support denitrification has been
considered in several studies. Abufayed and Schroeder (1986) for
example, used primary sludge from domestic wastewater as a
feedstock for separate stage denitrification. Arbiv and van Rijn
(1995) used organic debris accumulating in a culture unit to
support denitrification in a fluidized bed reactor. A similar
approach was tested by Klas et al. (2006), who used organic solid
waste of a typical RAS as an electron donor in a single-sludge
denitrification process for treating system effluents.
To solve some of the problems described above, we set out to
design a system based on an insoluble carbon source and a
degassing technique. The rationale for the design was that an
insoluble carbon source would prevent ‘‘leakage’’ of organics into
the water of the grow-out tank, while the degassing technique
would eliminate the problems of oxygen inhibition of denitrification and of the aerobic consumption of organic carbon. In the
present study, we thus tested whether a denitrification system
73
based on the combined technology of degassing followed by
passage through a cotton wool biofilter would lead to a reduction
in reactor volume and an improvement in overall efficiency and
sustainability.
2. Materials and methods
2.1. Experimental system
The experimental set-up included two replicate systems
(designated 1 and 2) placed in an aquaculture greenhouse on
the Bergmann Campus of Ben-Gurion University of the Negev,
Beer-Sheva, Israel. Each system comprised an aquaculture tank and
a water treatment facility (Fig. 1). The aquaculture tanks were
located inside a dark area (6 m  12 m) that occupied half of the
greenhouse. Water from the aquaculture tank was allowed to flow
out of the dark room into the water treatment equipment that was
placed in the light in the other half of the greenhouse. Each water
treatment facility comprised an aerobic nitrification biofilter, a
deep-bed sand filter (Astral 750, Astralpool, Spain), and a
denitrification biofilter that was connected in parallel to the main
water flow. A small aquarium pump fed the water from the
aquaculture tank to the denitrification system, and the outlet
water flowed to the aerobic biofilter (Fig. 1). The aerobic biofilter
comprised a polyethylene container ($100 l) filled with plastic
beads (surface area 860 m2 and 160 kg per cubic meter, Aridal BioBalls, Israel). CaCO3 in the form of quarry gravel was added to the
aerobic biofilter before the start of the experiment to compensate
for any extreme drop in alkalinity due to the nitrification. Each
aquaculture tank was filled with 13 m3 of synthetic brackish water
and was maintained at 29 Æ 1 8C. The synthetic brackish water
was prepared by adding Red Sea salt to local tap water to raise the
salinity to 4 ppt. The aquaculture tanks were stocked with a prawn
(Macrobrachium rosenbergii) broodstock at a biomass density of
590 g/m3. Dry feed was supplied three times a week at a rate of
approximately 2.5–3.5% of the total biomass per day. Before the start
of the experiment, ammonium chloride was added to both systems to
ensure proper initial function of the aerobic biofilter, and thereafter
ammonia and nitrite levels were monitored routinely.
2.2. Denitrification biofilter
The denitrification system is based on a novel two-stage
approach. The first stage comprises a small (10 1) plastic degassing
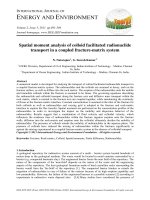
Fig. 1. Schematic representation of the system layout. (A) Aerobic nitrification
biofilter, (B) system pump (centrifugal), (C) sand filter, and (D) denitrification
system.
74
A. Singer et al. / Aquacultural Engineering 39 (2008) 72–77
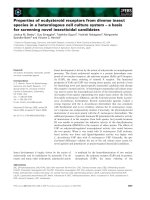
Fig. 2. Two-stage denitrification system (A). In stage 1, water enters a degassing chamber (B) where the dissolved oxygen is removed. Thereafter, it flows into a denitrification
biofilter (C), where cotton wool serves as the primary carbon source. The dark region in the cotton-bead packing regime (inside lower oval) depicts the region occupied by the
porous plastic beads. The lighter region represents the area filled with cotton.
chamber, where the dissolved oxygen is removed by means of a
Venturi vacuum tube (Vaccon JD-100M-STAA4). The influent pipe
of the degassing chamber terminates in a nozzle, containing a
number of small holes, thereby increasing the surface area to
volume ratio of the water to be deoxygenated. The second stage,
the denitrification biofilter, is placed below the degassing
chamber. The biofilter comprises a PVC pipe (0.3 m diameter,
$45 l in volume) filled with commercial cotton wool (the kind used
in first-aid kits) and plastic beads packed in the manner shown in
Fig. 2. The beads in the column occupied approximately 26 l, and
the total cotton wool content was approximately 1.1 kg.
2.3. Sampling regime and analytical procedures
Samples from the aquaculture tanks and from the denitrification unit outlet were collected over a 4-month period and analyzed
for the following parameters according to the APHA (1998), unless
otherwise specified, at the following time intervals: turbidity, pH
and temperature were analyzed three times a week; ammonia,
nitrite and alkalinity, once a week; and nitrate, twice a week. Total
suspended solids (TSS), volatile suspended solids (VSS), total
dissolved solids (TDS) and total organic carbon (TOC) were
analyzed periodically. Ammonia was determined by the Nesslerization method, nitrite by the azo dye colorimetric method, and
nitrate by the Szechrome NAS reagent (diphenylamine sulfonic
acid chromogene) method according to Gross and Boyd (1998).
TOC was determined with a Tekmar Dohrmann–Apollo 9000
analyzer (Cincinnati, OH, USA). Temperature and pH were
measured with a standard thermometer and a Cyberscan 510
meter (Euteoh Instruments, Singapore), respectively. Turbidity
was measured by Hach 2100P turbidometer (Hach Company,
Loveland, CO, USA).
2.4. Sludge management
The sludge that accumulated in the sand filter was flushed out
by backwashing the filter once or twice a week, with the system’s
water, into a separate sedimentation basin. The backwash
suspension (500 l) was allowed to settle for 30 min, the sludge
sediment was removed, and the remaining water was pumped
back into the system. This procedure meant, in practice, that very
little water was lost. Tap water was added to compensate for losses
due to evaporation.
3. Results and discussion
3.1. General water quality parameters
The results indicate that the two experimental systems behaved
almost identically, as demonstrated in Figs. 3–5, and Tables 1–3.
Throughout the entire study, ammonia and nitrite concentrations
in the aquaculture tanks remained at low levels suitable for most
aquatic life (Table 1). The pH in the system fluctuated between 7.5
and 8, a range that is considered by some as suitable for
aquaculture growth (Boyd and Tucker, 1998). This pH range is
also commonly cited as optimal for nitrifying biofilters (Hagopian
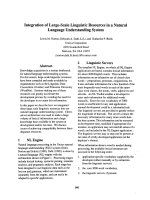
Fig. 3. Nitrate concentrations of systems 1 and 2 for the entire duration of the experiment. Black diamonds represent aquaculture tank (inlet) values, and open circles
represent the denitrification biofilter outlet values.
A. Singer et al. / Aquacultural Engineering 39 (2008) 72–77
75
Fig. 4. Nitrite concentrations of systems 1 and 2 for the entire duration of the experiment. Black diamonds represent aquaculture tank (inlet) values, and open circles represent
the denitrification biofilter outlet values.
Fig. 5. Nitrate delta concentration values (influent less effluent) for systems 1 and 2 for the entire duration of the experiment. Linear regression line depicts the nitrate delta
function (NDF).
Table 1
Summary of water quality parameters in the aquaculture tanks
Parameter
Tank 1
Tank 2
Temperature (8C)
pH
Alkalinity (mg/l as CaCO3)
Turbidity (NTU)
Ammonia (mgN/l)
Nitrate (mgN/l)
Nitrite (mgN/l)
27.2 Æ 2.1
7.79 Æ 0.14
120.6 Æ 16.9
1.4 Æ 1
0.13 Æ 0.11
8.6 Æ 1.1
0.03 Æ 0.03
27.2 Æ 2.1
7.74 Æ 0.09
111.1 Æ 19.4
1.1 Æ 0.5
0.13 Æ 0.11
7.9 Æ 1
0.03 Æ 0.03
and Riley, 1998). However, many studies have noted that the pH
acceptable for aquatic animals varies, depending on type of animal
and the salinity of the water, and that the pH is liable to drop
rapidly unless a buffering agent is used (Menasveta et al., 2001;
Shnel et al., 2002; Akunna et al., 1993; Skjølstrup et al., 1998; Vidal
et al., 2002). These studies usually applied a batch-wise approach
to solving the pH problem by periodically adding small amounts of
chemicals, such as sodium bicarbonate. Another option for
controlling the pH is the addition of lime, which is a common
practice to buffer natural acidity or the acidity that is incurred by
Table 2
Operation and performance parameters of the denitrification process
Parameter
System 1
System 2
Volume of denitrification biofilter (l)
Flow rate (l/h)
Days operated
Total water volume passing through
biofilter (m3)
Inlet alkalinity (mg/l as CaCO3)
Outlet alkalinity (mg/l as CaCO3)
Apparenta,b C/N ratio; based on the NDFc
(g cotton applied)/(g nitrate N removed)
Apparenta,b C/V ratio; based on the NDFc
(g cotton applied)/(m3 water treated)
Calculated C/N ratio; based on the RFCd
(g cotton applied)/(g nitrate N removed)
45
$20
115
55.2
45
$20
115
55.2
120.6 Æ 16.9
137.0 Æ 37.2
0.839
111.1 Æ 19.4
129.7 Æ 31.8
0.782
a
17.18
0.836
18.59
0.802
Based on weighing (cotton completely degraded).
Due to simultaneous oxidation of waste organic particles trapped in the
biofilter medium.
c
Nitrate delta function.
d
Relative feed contribution.
b
nitrification in earthen ponds for fish aquaculture or in RAS (Boyd
and Tucker, 1998). This option was applied here by incorporating a
small amount of CaCO3, in the form of quarry gravel, into the
aerobic biofilter. Water alkalinity in the tanks remained stable
throughout the experiment (Table 1), since the denitrification in
the anoxic biofilter increased the alkalinity (Table 2), as was to
have been expected (van Rijn, 1996).
3.2. Denitrification efficiency
In addition to the pilot trials in the greenhouse, laboratory batch
experiments were carried out with undigested cotton wool and
nitrate solution to evaluate the consumption of cotton wool in the
denitrification process. To this end, four Erlenmeyer flasks
containing various quantities of pure cotton wool (0, 0.25, 0.5,
and 1.0 g) and tap water supplemented with nitrate to a
concentration of 400 mg/l were placed in an anaerobic hood
(COY Laboratory Products Inc., MI, USA). After 10 days, the
remaining cotton wool was washed free of salts, and the nitrate
concentrations in the tested solutions were measured. The cotton
wool was dried at 105 8C and weighed. The C/N ratio obtained was
1.83 Æ 0.52 g of cotton wool/g of nitrate N.
In the experimental biofilters of the pilot system, nitrate levels
were initially very high (more than 200 mg N/l), probably due to
the addition of ammonium chloride before the start of the
experiment, as explained above. However, approximately 2 weeks
after the beginning of operation of the denitrification biofilter,
nitrate concentrations had fallen to very low levels (less than
10 mg N/l), as shown in Fig. 3. These findings were probably due to
the time required for biomass build-up in the denitrification
biofilter. While nitrate levels were consistently reduced in the
Table 3
Sludge balance and quality parameters
Parameter
System 1
System 2
Total sludge extracted (l)
Sludge per extraction (l)
Sludge TSS (g/l)
Sludge VSS (g/l)
(g TSS extracted)/(kg animal feed)
183.25
8.33 Æ 2.33
13.33 Æ 3.33
7.28 Æ 2.12
86.35
173.50
8.26 Æ 2.3
12.57 Æ 5.39
7.48 Æ 2.93
77.09
76
A. Singer et al. / Aquacultural Engineering 39 (2008) 72–77
denitrification unit, nitrite production was evident in the process,
as shown in Fig. 4. These residual levels of nitrite, a known
intermediate product of denitrification (van Rijn and Rivera, 1990),
were subsequently removed in the nitrification aerobic biofilter.
Thus, the unique design approach of the overall water treatment
system ensured dependable water quality with regard to
ammonia, nitrite and nitrate.
While both systems 1 and 2 reached a quasi-steady state with
low levels of nitrate (Table 1 and Fig. 3), the nitrate delta (inlet
concentration less outlet concentration) showed a steady decline
(Fig. 5). Linearization of the difference as a function of time (nitrate
delta function, NDF) enabled us to ascertain when, approximately,
the denitrification system became ineffective, probably due to the
limitation of organic carbon. This approximation was based on the
assumption that denitrification can be modeled as a zero-order
reaction with respect to nitrate concentrations down to very low
levels (Vidal et al., 2002). The NDF obtained from Fig. 5 can give us a
clearer definition of the anoxic biofilter capacity with regard to the
ultimate end point (point of near-zero effectiveness). NDF was
found to be À0.0641 Â t + 8.38 and À0.0607 Â t + 7.47 for systems
1 and 2, respectively, where t is the time in days. Calculations based
on the NDF figures showed that the anoxic biofilter would become
ineffective (NDF = 0) on day 130 for system 1 and on day 123 for
system 2. It was believed that the anoxic biofilter would remain
effective until those dates, even though system nitrate levels
would continue to increase slowly. On the basis of this assumption,
it was therefore possible to calculate the mass of cotton wool
required to treat a certain load of nitrate (Table 2). Our calculations
gave an average actual C/N value of 0.81 g of cotton wool/g of
nitrate N for the two systems. This extremely low ratio is below the
theoretical ratio (1.36) reported for cellulose (Rocca et al., 2005)
and below that obtained for pure undigested cotton wool in the
batch experiment described above (1.83). This discrepancy stems
from the simultaneous oxidation of waste organic particles flowing
out of the aquaculture tank and trapped in the cotton wool filter
medium. The suitability of such waste particles to serve as a carbon
source for denitrification has been shown elsewhere (Abufayed
and Schroeder, 1986; Arbiv and van Rijn, 1995; Klas et al., 2006).
Alternatively, the applied C/N ratio can be theoretically
calculated on the basis of the amount of feed and the amount of
nitrogen that was added to the system throughout the experiment.
In such a calculation, the initial and final nitrate levels in the
aquaculture tank must be taken into account. It is commonly held
that the total nitrate mass (mg N) contributed by the animal feed
and subsequently removed by the nitrification–denitrification
processes may be expressed as F  D  Pr  Np  Ns, where F is the
total amount [in mg] of feed added into the system for the entire
duration of the experiment, D is the dry weight of the feed
[estimated at 88%], Pr is the total protein content of the feed
[indicated at 45% by the manufacturer], Np is the average
percentage of nitrogen in the protein [estimated to be 16% by
the FAO, 2006], and Ns is the percentage of nitrogen secreted into
the system [estimated at 78% by Lupatsch and Kissil, 1998]. Using
this approach and taking into account the aquaculture tank water
volume and the difference between final and initial nitrate
concentrations, we calculated the average C/N ratio to be 0.82 g
of cotton wool/g of nitrate N (Table 2). Thus, it was found that the
actual measured C/N ratio and the theoretical calculation methods,
i.e., the NDF and the relative feed contribution (RFC) – although
employing different assumptions – all gave very similar values of
approximately 0.82 g of cotton wool/g of nitrate N.
A number of studies have been conducted to determine the C/N
ratio required for effective denitrification with different carbon
sources. The experiments of Akunna et al. (1993) showed that for a
batch type reactor, the C/N ratio was 5.4, 4.8, 4.8, 5.0 and 3.7 for
glucose, glycerol, acetic acid, lactic acid and methanol, respectively. In an attempt to reduce nitrate levels by using freeze-dried
starch as both the carbon source and the matrix for the denitrifying
bacteria, Tal et al. (2003) found a C/N ratio of approximately 3.2.
The studies of Sauthier et al. (1998), with ethanol as the carbon
source, showed that an optimal C/N ratio of 1 was needed to
maintain low nitrate levels. Go´mez et al., 2000 found C/N ratios
of 1.08 for ethanol, 1.1 for methanol, and 2.5 for sucrose.
Menasveta et al. (2001) showed that C/N ratios of 0.4 and 0.92 for
ethanol and methanol, respectively, were adequate to maintain
low nitrate concentrations. Rocca et al. (2005) found a ratio of
2.9 g of cotton/g N in treatment of nitrate-rich drinking water, a
value well above the ratio obtained in the present study for the
same carbon source.
Denitrification processes in RAS using soluble carbon sources
require sophisticated process controls and continuous monitoring
to prevent any spill into the recirculated water of residual organics
that might harm the animals. Go´mez et al., 2000 found, for
example, that even when using a C/N ratio well below the ratio
needed to effectively remove system nitrate, remaining concentrations of the soluble carbon source could be found in the effluent.
A system based on an insoluble solid carbon source would
therefore seem to be a good solution to these problems. We believe
cotton wool, being completely insoluble in water, to be the
material of choice, since it can serve both as a carbon source and as
a biomass growth bed. Its low cost, availability, and low toxicity are
added advantages. In addition, it can act as a physical barrier that
traps particles, some of which can serve as an additional carbon
source for denitrification (Abufayed and Schroeder, 1986; Arbiv
and van Rijn, 1995; Klas et al., 2006). In our system, an attempt was
made to reduce the overall compressibility of the cotton wool by
using plastic beads (identical to those used in the aerobic biofilter)
as spacers, and by arranging the biofilter in a horizontal flow
regime This set-up increased the active zone (zone where the
denitrification takes place) and prevented the clogging and
channeling problems reported elsewhere (Sauthier et al., 1998;
Soares et al., 2000). Periodic monitoring showed no increase of TOC
in the denitrification unit (data not shown).
Although vacuum degassing – like nitrogen stripping – has its
own intrinsic drawbacks (such as initial capital investment and
long-term maintenance costs), both methods are relatively
convenient and simple. Nitrogen stripping is probably more cost
effective in the short term, because vacuum degassing requires a
slightly greater initial capital investment. However, in the long
term, vacuum degassing should be more economical. Vacuum
degassing presents some unique engineering challenges, but once
a suitable system has been developed, it can produce an almost
inexhaustible supply of degassed water (Landman and van den
Heuvel, 2003). This concept may have an additional advantage in
intensive aquaculture systems for which the accumulation of
carbon dioxide has been reported (Summerfelt et al., 2000), since
the carbon dioxide can be stripped simultaneously with oxygen by
the same simple method.
3.3. Sludge balance
Turbidity levels remained low, at less than 2 NTU, and quite
constant throughout the entire experiment in both systems 1 and 2
(Table 1), suggesting that the sand filter was effective in removing
most of the suspended solids produced in the aquaculture tanks.
These suspended solids were filtered out and formed the sludge
that was then removed from the system. Generally, the tested
sludge parameters in the two systems proved to be similar
(Table 3). Overall, the total amount of sludge extracted over the
duration of the study was approximately 180 l for each system.
A. Singer et al. / Aquacultural Engineering 39 (2008) 72–77
Thus, the total amount of water that would have to be added to
each system to compensate for sludge loss was negligible. These
figures work out to more than 99.99% overall system recovery for
the duration of the study with regard to water reuse.
4. Summary and conclusions
Environmentally friendly RAS, which conform to strict environmental legislation, are needed for small-scale, urban aquaculture. For these purposes, the most important water quality
parameters are ammonia, nitrite and nitrate. While aerobic
nitrification of ammonia and nitrite has become a general standard
in such systems, the resulting nitrate accumulation has not
received the necessary attention. To address this oversight, we
have designed and tested an innovative denitrification bioreactor
system based on solid cotton wool as the primary carbon source
and a unique degassing device, which further increases the
biofilter’s efficiency and effectiveness. This design concept and the
above-described sludge management practice resulted in a very
high recovery of water and a negligible amount of waste for
disposal. Our results show that the process offers a number of
advantages: it provides highly efficient and controlled denitrification, it uses a cheap and renewable carbon source, and it has a low
maintenance, compact configuration.
The results of the two pilot systems, which proved to be almost
identical in most of the monitored parameters, showed that
effective operational capability of the denitrification biofilter could
be easily evaluated. Two alternative calculation methods, the NDF
and the RFC, yielded the same apparent C/N ratio for the two
experimental systems, averaging 0.82 g of cotton wool/g of nitrate
N. This extremely low ratio may be attributed to the simultaneous
oxidation of waste organic particles flowing out of the aquaculture
tanks and trapped in the cotton wool filter medium. Since the solid
cotton wool does not release organic residuals into the recirculating water, the new system is superior to systems that use a liquid
carbon source. The degassing chamber that physically stripped the
water of dissolved gaseous O2 by means of a Venturi vacuum tube,
prior to its passage through the denitrification biofilter, contributed to more efficient denitrification (no oxygen inhibition of
denitrification and no aerobic consumption of cotton) and to the
reduction of biofilter volume due to the increased process
efficiency. Since denitrification could result in the formation of
intermediate nitrite, the configuration places nitrification after
denitrification, to ensure a reliable water quality for aquaculture
systems. This design was shown to produce consistently good
results over a long period with hardly any need to compensate for
the loss of system water (except for evaporation losses), and with
effluents having low nitrate levels (below 10 mg N/l). The overall
treatment scheme, which also incorporates an aerobic nitrification
biofilter and a granular filtration device, produces excellent water
quality, having near-zero levels of ammonia and nitrite, low
turbidity and a suitable pH.
Acknowledgements
This study was supported in part by research grant award MB8707-04 from BARD, The US–Israel Binational Agricultural Research
and Development fund. The authors wish to express their thanks to
77
Ms. Larissa Shemtov for her expert technical support and to Mr. Liron
Friedman for husbandry and technical assistance.
References
Abufayed, A.A., Schroeder, E.D., 1986. Performance of SBR/denitrification with a
primary sludge carbon source. J. Water Pollut. Control 58, 387–397.
Akunna, C.J., Bizeau, C., Moletta, R., 1993. Nitrate and nitrite reductions with
anaerobic sludge using various carbon sources: glucose, glycerol, acetic acid,
lactic acid and methanol. Water Res. 23, 1303–1312.
APHA, 1998. Standard Methods for the Examination of Water and Wastewater, 20th
edn. American Public Health Association/American Water Works Association/
Water Pollution Control Federation, Washington, DC, USA.
Arbiv, R., van Rijn, 1995. Performance of a treatment system for inorganic nitrogen
removal in intensive aquaculture systems. Aquacult. Eng. 14, 189–203.
Asano, L., Ako, H., Shimizu, E., Tamaru, C., 2003. Limited water exchange production
systems for ornamental fish. Aquacult. Res. 34, 937–941.
Boyd, C.E., Tucker, C.S., 1998. Pond Aquaculture Water Quality Management. Kluwer
Academic Publishers, Boston, Massachusetts, USA, 700 pp.
FAO, 2006. Fisheries Technical Paper No. 500. State of World Aquaculture 2006.
Food and Agriculture Organization of the United Nations. .
Go´mez, M.A., Gonza´lez-Lo´pez, J., Hontoria-Garcı´a, E., 2000. Influence of carbon
source on nitrate removal of contaminated groundwater in a denitrifying
submerged filter. J. Hazard. Mater. 80, 69–80.
Gross, A., Boyd, C.E., 1998. A digestion procedure for the simultaneous determination of total nitrogen and total phosphorus in pond water. J. World Aquacult.
Soc. 29, 300–303.
Hagopian, D., Riley, G., 1998. A closer look at the bacteriology of nitrification.
Aquacult. Eng. 18, 223–244.
Klas, S., Mozes, N., Lahav, O., 2006. Development of a single-sludge denitrification
method for nitrate removal from RAS effluents: lab-scale results vs. model
prediction. Aquaculture 259, 342–353.
Landman, J.M., van den Heuvel, R.M., 2003. An improved system for the control of
dissolved oxygen in freshwater aquaria. Water Res. 37, 4337–4342.
Lupatsch, I., Kissil, G.M., 1998. Predicting aquaculture waste from gilthead seabream (Sparus aurata) culture using a nutritional approach. Aquat. Living Resour.
11, 265–268.
Menasveta, P., Panritdam, T., Sihanonth, P., Powtongsook, S., Chuntapa, B., Lee, P., 2001.
Design and function of a closed, recirculating seawater system with denitrification for the culture of black tiger shrimp broodstock. Aquacult. Eng. 25, 35–49.
Rocca, C.D., Belgiorno, V., Meric¸, S., 2005. Cotton-supported heterotrophic denitrification of nitrate-rich drinking water with a sand filtration post-treatment.
Water SA 31, 229–236.
Sauthier, N., Gasmick, A., Blancheton, J.P., 1998. Biological denitrification applied to
a marine closed aquaculture system. Water Res. 32, 1932–1938.
Shnel, N., Barak, Y., Ezer, T., Dafni, Z., van Rijn, J., 2002. Design and performance of a
zero-discharge tilapia recirculating system. Aquacult. Eng. 26, 191–203.
Skjølstrup, J., Nielsen, P.H., Frier, J.-O., McLean, E., 1998. Performance characteristics
of fluidised bed biofilters in a novel laboratory-scale recirculation system for
rainbow trout: nitrification rates, oxygen consumption and sludge collection.
Aquacult. Eng. 18, 265–276.
Soares, M.I.M., Brenner, A., Yevzori, A., Messalem, R., Leroux, Y., Abeliovich, A., 2000.
Denitrification of groundwater: pilot-plant testing of cotton-packed bioreactor
and post-microfiltration. Water Sci. Technol. 42, 353–359.
Summerfelt, S.T., Vinci, B.J., Piedrahita, R.H., 2000. Oxygenation and carbon dioxide
control in water reuse systems. Aquacult. Eng. 22, 87–108.
Suzuki, Y., Maruyama, T., Numata, H., Sato, H., Asakawa, H., 2003. Performance of a
closed recirculating system with foam separation, nitrification, and denitrification units for intensive culture of eels: towards zero emission. Aquacult. Eng. 29,
165–182.
Tal, Y., Nussinovitch, A., van Rijn, J., 2003. Nitrate removal in aquariums by
immobilized Pseudomonas. Biotechnol. Progr. 19, 1019–1021.
van Gorder, S.D., 1994. Operating and managing water reuse systems. In: Timmons,
M., Losordo, T. (Eds.), Aquaculture Water Reuse Systems: Engineering Design
and Management. Elsevier Science, Amsterdam, 333 pp.
van Rijn, J., 1996. The potential for integrated biological treatment systems in
recirculating fish culture—a review. Aquaculture 139, 181–201.
van Rijn, J., Rivera, G., 1990. Aerobic and anaerobic biofiltration in an aquaculture
unit—nitrite accumulation as a result of nitrification and denitrification. Aquacult. Eng. 9, 217–234.
Vidal, S., Rocha, C., Galvao, H., 2002. A comparison of organic and inorganic
carbon controls over biological denitrification in aquaria. Chemosphere 48,
445–451.
Zohar, Y., Tal, Y., Schreier, H.J., Steven, C., Stubblefield, J., Place, A., 2005. Commercially
feasible urban recirculated aquaculture: addressing the marine sector. In: CostaPierce, B. (Ed.),Urban Aquaculture. CABI Publishing, Cambridge, MA, pp. 159–171.