Effects of alkalinity on ammonia removal, carbon dioxide stripping, and system ph
Bạn đang xem bản rút gọn của tài liệu. Xem và tải ngay bản đầy đủ của tài liệu tại đây (744.63 KB, 9 trang )
Aquacultural Engineering 65 (2015) 46–54
Contents lists available at ScienceDirect
Aquacultural Engineering
journal homepage: www.elsevier.com/locate/aqua-online
Effects of alkalinity on ammonia removal, carbon dioxide stripping,
and system pH in semi-commercial scale water recirculating
aquaculture systems operated with moving bed bioreactors
Steven T. Summerfelt a,∗ , Anne Zühlke b,c , Jelena Kolarevic b , Britt Kristin Megård Reiten b ,
Roger Selset b , Xavier Gutierrez b,d , Bendik Fyhn Terjesen b
a
The Conservation Fund Freshwater Institute, 1098 Turner Road, Shepherdstown WV 25443, USA
Nofima, NO-6600 Sunndalsøra, Norway
c
Faculty for Agricultural and Environmental Sciences, University of Rostock, Jusus-von-Liebig-Weg 6, 18059 Rostock, Germany
d
AVS Chile SA, Imperial 0655, Of. 3A, Puerto Varas, Chile
b
a r t i c l e
i n f o
Article history:
Available online 24 November 2014
Keywords:
RAS
Salmon
Alkalinity
Nitrification
CO2
Biofilter
a b s t r a c t
When operating water recirculating systems (RAS) with high make-up water flushing rates in locations
that have low alkalinity in the raw water, such as Norway, knowledge about the required RAS alkalinity concentration is important. Flushing RAS with make-up water containing low alkalinity washes out
valuable base added to the RAS (as bicarbonate, hydroxide, or carbonate), which increases farm operating costs when high alkalinity concentrations are maintained; however, alkalinity must not be so low
that it interferes with nitrification or pH stability. For these reasons, a study was designed to evaluate
the effects of alkalinity on biofilter performance, and CO2 stripping during cascade aeration, within two
replicate semi-commercial scale Atlantic salmon smolt RAS operated with moving bed biological filters.
Alkalinity treatments of nominal 10, 70, and 200 mg/L as CaCO3 were maintained using a pH controller
and chemical dosing pumps supplying sodium bicarbonate (NaHCO3 ). Each of the three treatments was
replicated three times in each RAS. Both RAS were operated at each treatment level for 2 weeks; water
quality sampling was conducted at the end of the second week. A constant feeding of 23 kg/day/RAS was
provided every 1–2 h, and continuous lighting, which minimized diurnal fluctuations in water quality.
RAS hydraulic retention time and water temperature were 4.3 days and 12.5 ± 0.5 ◦ C, respectively, typical
of smolt production RAS in Norway.
It was found that a low nominal alkalinity (10 mg/L as CaCO3 ) led to a significantly higher steady-state
TAN concentration, compared to when 70 or 200 mg/L alkalinity was used. The mean areal nitrification
rate was higher at the lowest alkalinity; however, the mean TAN removal efficiency across the MBBR was
not significantly affected by alkalinity treatment. The CO2 stripping efficiency showed only a tendency
towards higher efficiency at the lowest alkalinity. In contrast, the relative fraction of total inorganic carbon
that was removed from the RAS during CO2 stripping was much higher at a low alkalinity (10 mg/L)
compared to the higher alkalinities (70 and 200 mg/L as CaCO3 ). Despite this, when calculating the total
loss of inorganic carbon from RAS, it was found that the daily loss was about equal at 10, and 70 mg/L,
whereas it was highest at 200 mg/L alkalinity. pH recordings demonstrated that the 10 mg/L alkalinity
treatment resulted in the lowest system pH, the largest increase in [H+ ] across the fish culture tanks, as
well as giving little response time in case of alkalinity dosing malfunction. Rapid pH changes under the
relatively acidic conditions at 10 mg/L alkalinity may ultimately create fish health issues due to e.g. CO2 or
if aluminium or other metals are present. In conclusion, Atlantic salmon smolt producers using soft water
make-up sources should aim for 70 mg/L alkalinity considering the relatively low loss of inorganic carbon
compared to 200 mg/L alkalinity, and the increased pH stability as well as reduced TAN concentration,
compared to lower alkalinity concentrations.
© 2014 The Authors. Published by Elsevier B.V. This is an open access article under the CC BY license
( />
Abbreviations: HRT, hydraulic retention time; MBBR, moving bed bioreactor; TSS, total suspended solids; TAN, total ammonia nitrogen; TIC, total inorganic carbon; RAS,
tecirculating aquaculture system.
∗ Corresponding author. Tel.: +1 304 870 2211; fax: +1 304 870 2208.
E-mail address: (S.T. Summerfelt).
/>0144-8609/© 2014 The Authors. Published by Elsevier B.V. This is an open access article under the CC BY license ( />
S.T. Summerfelt et al. / Aquacultural Engineering 65 (2015) 46–54
1. Introduction
Water recirculating aquaculture systems (RAS) are increasingly
used to produce Atlantic salmon smolt (Bergheim et al., 2009;
Dalsgaard et al., 2013; Kolarevic et al., 2014). These systems are
often intensive, operating with low system flushing rates, high
stocking densities, pure oxygen supplementation, biofiltration to
remove ammonia, and various forms of aeration to remove dissolved carbon dioxide (CO2 ). Pure oxygen supplementation is used
to support higher feed loads and increased fish production in a
given RAS, but this also create conditions where elevated levels of dissolved CO2 can accumulate if inadequate air-to-water
contacting is not provided (Summerfelt et al., 2000). Fish can
sense and will avoid areas of high dissolved CO2 (Clingerman
et al., 2007), when possible. However, chronic exposure to elevated concentrations of dissolved CO2 has been associated with
reduced growth (Danley et al., 2005; Fivelstad et al., 2007), reduced
condition factor (Fivelstad et al., 1998, 2003a, 2003b), and nephrocalcinosis (Landolt, 1975; Fivelstad et al., 1999; Hosfeld et al.,
2008) in salmonids. In addition, free acid produced during nitrification reacts with bicarbonate alkalinity in the water releasing
more carbon dioxide than the autotrophic nitrifying bacteria consume (U.S. EPA, 1975). The conversion of total ammonia nitrogen
(TAN) to nitrate nitrogen (NO3 –N) with nitrifying bacteria consumes approximately 0.15–0.19 kg sodium bicarbonate (NaHCO3 )
for every 1 kg of feed consumed by the fish (Davidson et al., 2011).
And, if this alkalinity loss is not compensated for by supplementation with a base (such as sodium hydroxide or NaHCO3 ), the
alkalinity and pH of the system will decrease (Loyless and Malone,
1997). The loss of alkalinity and the increase of dissolved CO2
are both conditions that reduce the pH of the recirculating water
according to acid–base equilibrium of the carbonate system (e.g.
Loyless and Malone, 1997; Colt, 2006). As stocking density and
system hydraulic retention time in RAS have increased in recent
years, application of technologies to control alkalinity, pH, and dissolved CO2 have become significantly more important. Preventing
large drops in pH can be critical to prevent solubilizing metals, such
as aluminium, because of their toxic effect on fish (Skogheim and
Rosseland, 1986; Fivelstad et al., 2003b).
Carbon dioxide is excreted (along with ammonia) through the
fish’s gills in proportion to its feed and oxygen consumption rate.
A considerable amount of dissolved CO2 is also produced in the
biofilter (Summerfelt and Sharrer, 2004). Controlling dissolved CO2
from accumulating to detrimental levels is particularly important
in fish farms that use intensive water recycling systems. These
systems use oxygenation units to create high levels of available dissolved oxygen in the culture tanks, but oxygenation units provide
insufficient gas exchange to strip much dissolved CO2 . In addition,
the concentration of dissolved CO2 produced within the culture
tank can be quite large when pure oxygenation is used, with up
8–12 mg/L of dissolved CO2 produced in a single pass at high
stocking densities. Dissolved CO2 is stripped from the recirculating water, typically after the biofilter and before the oxygenation
process (Summerfelt et al., 2000; Summerfelt and Sharrer, 2004).
Dissolved CO2 stripping is based on the principle that the partial
pressure of CO2 in air contacted with water is less than the partial
pressure of the CO2 dissolved in the water. The dissolved CO2 therefore comes out of solution and is stripped off as a gas. Increasing
the volume of air flow that is contacted with the water flow will
increase the dissolved CO2 that can be removed.
Maintaining adequate alkalinity concentrations has been
reported to be critical for sustaining nitrification, i.e., the wastewater literature reports that 40–80 mg/L (as CaCO3 ) is the minimum
alkalinity required to support nitrification (Paz, 1984; Biesterfeld
et al., 2003). Villaverde et al. (1997) reported a linear increase
in nitrification efficiency of 13% per unit pH increase from pH
47
5.0 to 8.5. Rusten et al. (2006) found that the nitrification rate
dropped to only half of the original rate when alkalinity dropped
from approximately 115 mg/L as CaCO3 (pH 7.3) to 57 mg/L (pH
6.7) in a bench-scale experiment performed using biofilm carriers collected from a turbot farm’s moving bed biological reactor
(MBBR). Moreover, Colt (2006) warns that the nitrification process
slows down at low pH and Chen et al. (2006) recommend maintaining an alkalinity of 200 mg/L as CaCO3 to support nitrification
when water exchange rate is minimal. RAS operated at suboptimal
alkalinity could theoretically encounter larger pH swings, higher
concentrations of TAN and NO2 –N if nitrification efficiency drops,
and microbial community instability (Mydland et al., 2010), which
may be harmful to the fish. However, the consequences of operating a RAS without adequate alkalinity have been little studied,
particularly for systems used to produce Atlantic salmon. This is
a species which is sensitive to elevated concentrations of nitrite
nitrogen without concurrent chloride adjustments (Gutierrez et al.,
2011), to relatively low levels of NH3 –N (Kolarevic et al., 2013), and
CO2 (Fivelstad, 2013). Research is needed to determine if maintaining an alkalinity of 80–200 mg/L as CaCO3 is really beneficial,
because operating at high alkalinity levels will increase the cost of
supplementation with base. Interestingly, high nitrification rates at
low pH and alkalinity have been reported previously in laboratory
scale reactor experiments (Tarre and Green, 2004). When operating RAS with high make-up water flushing rates in locations such as
Norway that have low alkalinity in the raw water (Kristensen et al.,
2009), knowledge about required RAS alkalinity will be particularly important. Furthermore, since it has recently been proposed
that larger tank scales increase performance in salmon (Espmark
et al., 2013), we wanted to study effects of alkalinity in larger scale
RAS. For these reasons, a study was designed to evaluate the effects
of alkalinity on CO2 stripping during cascade aeration, plus biofilter performance within salmon smolt semi-commercial scale RAS
operated with moving bed biological filters. The goal of the study
was to test the following hypotheses, that increasing alkalinity concentrations from 10 to 200 mg/L in a RAS will (1) stabilize system
pH, (2) decrease NO2 –N and TAN concentrations and variability,
and (3) increase TAN removal efficiency and removal rate across
the MBBR. Finally, we hypothesize that (4) a higher alkalinity will
decrease CO2 removal efficiency, and increase total inorganic carbon (TIC) removal, across forced-ventilation cascade degassers and
thus lead to elevated costs associated with bicarbonate dosing.
2. Materials and methods
The studies were conducted at the Nofima Centre for Recirculation in Aquaculture at Sunndalsøra, Norway, described in Terjesen
et al. (2013).
2.1. Experimental treatments
Alkalinity of the recirculating water was maintained at three
treatment levels, i.e., at nominal 10, 70, and 200 mg/L as CaCO3 ,
using an online pH electrode (Sensorex 8000CD-pH with solution
ground and amplifier, Golden Grove, USA) located in the sump at
the base of the CO2 stripping column. Each pH probe was equipped
with an automatic cleaning system; a water jet programmed to
flush the probe each tenth minute (Storvik Aqua, Sunndalsøra,
Norway). This automatic cleaning was found to be clearly necessary
to maintain stable pH during the 14 days of each treatment replicate
(Kolarevic´ et al., 2011). The pH probes were calibrated using Merck
two-point buffers (Merck, Darmnstadt, Germany), each week, right
after a treatment period ended, and after seven days into each
treatment. A dedicated pH controller (Model WPD 320, Walchem,
Holliston, MA) was used to control a chemical dosing pump (Model
48
S.T. Summerfelt et al. / Aquacultural Engineering 65 (2015) 46–54
EHE, Iwaki, Holliston, MA) supplying sodium bicarbonate (NaHCO3 )
to maintain a pH set-point in each RAS. Ground well water at
Nofima in Sunndalsøra contains around 6–20 mg/L as CaCO3 of
alkalinity, depending on season and the pump well in use (Terjesen
et al., 2013).
Thus, a pH control system was used to control the treatment
alkalinity because, according to acid–base equilibrium in freshwater with low ammonia levels, water pH is an approximate measure
of the alkalinity when the water temperature and dissolved CO2
concentration remain constant (Summerfelt et al., 2001). Changes
in dissolved CO2 do not affect alkalinity, per the definition, but do
affect the water pH. Thus, stripping dissolved CO2 increases the pH
of water as it decreases the total inorganic carbon concentration,
but it does not change the alkalinity concentration. Maintaining a
constant dissolved CO2 concentration required maintaining a constant CO2 production rate and removal rate for a given alkalinity
treatment. A relatively constant CO2 production rate was achieved
by maintaining a continuous photoperiod for the fish, constant daily
feed rate of 23 kg/day/RAS, and feeding every 1–2 h, 24 h a day.
Continuous lighting and feeding 24 h daily have been found to minimize diurnal fluctuations in water quality, i.e., the change in TAN,
CO2 , O2 , and TSS, concentrations across the culture tank (Davidson
et al., 2009; Kolarevic et al., 2009). Water temperature was logged
each fifth minute in the CO2 -degasser sump, and was maintained
at 12.8 ± 0.4 ◦ C (SD) (RAS1) and 12.7 ± 0.4 ◦ C (RAS2) throughout the
study.
Each treatment was replicated three times in two replicate RAS,
i.e., six quasi-replicates were provided for each treatment (Table 1).
Both RAS were operated at each treatment level for 2 weeks; water
quality sampling was conducted at the end of each second week.
The experimental design, both in terms of replicate systems, and
length of periods, was necessary to make this study at a semicommercial scale possible. The study lasted 20 weeks, because the
first treatment tested had to be repeated due to pH instabilities
during the start of the trial (Table 1).
2.2. Water recirculating systems
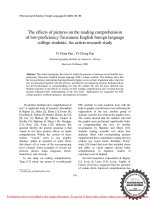
Two RAS were used in this study (Fig. 1). Each RAS contained
56.2 m3 of total water volume, including ten 3.3 m3 culture tanks,
a belt filter (Model SFK 400 with 60 m belt sieve opening, Salsnes, Namsos, Norway), three centrifugal pumps (1.5 kW/pump, ITT
Flygt, Trondheim, Norway) to lift 0.75 m3 /min each, at 6 m head,
from a sump following the belt filter, a moving bed bioreactor
(MBBR), a forced ventilated cascade aeration column for stripping CO2 from the water flowing by gravity out of the MBBR, a
pump sump below the degasser of 1.9 m3 volume, three centrifugal
pumps (3 kW/pump, ITT Flygt), to lift a nominal flow of 0.75 m3 /min
each against 12–13 m head from a sump at the base of the stripping
column, and a down flow bubble contactor (AquaOptima, Trondheim, Norway) to add pure oxygen gas to the water just before
it entered each culture tank. Each MBBR contained three 7.0 m3
chambers that each contained 3.5 m3 of media (Biofilm Chip P,
KrügerKaldnes, Sandefjord, Norway) with a specific surface area
of 900 m2 /m3 (manufacturers statement).
To ensure that the waste load on the MBBR approached maximal
capacity at a relevant culture tank water quality for Atlantic salmon
smolt (0.2–0.7 mg/L TAN) (Dalsgaard et al., 2013; Terjesen et al.,
2013), data from Terjesen et al. (2013) was used to calculate the
required media area in the present study. These authors found that
the capacity of all three chambers combined in the RAS1 (or RAS2)
MBBR was 61 kg feed/day, calculated to equal 2083 g TAN produced/day, at 50% feed protein, to maintain maximal 0.7 mg/L TAN
in the return flow from the culture tanks, at 14 ◦ C and 1.9 m3 /min
flow. In the present study a reduced feed load of 23 kg/day/RAS,
was used. Based on Terjesen et al. (2013) this feed load
(47% protein in feed, see below) should result in 700 g TAN/day/RAS
released to the culture tank water (nitrogen retention of 53% for
Atlantic salmon parr, Grisdale-Helland and Helland, 1997). At the
temperature of 12.8 ◦ C used in the present study, this TAN production would require one-third of the total MBBR area (i.e. 3140 m2 ),
giving a 68% TAN removal to 0.22 mg/L in the effluent, and require
a 1.1 m3 /min system flow rate. Thus, the recirculating water at
this flow rate was only pumped through one of the three MBBR
chambers (the last) per RAS during the present study (Fig. 1).
The CO2 stripping column used contained 1.6 m depth of random
packing (2.4 m3 of Nor-Pac rings 5 cm diam., Jaeger Environmental
Products, Houston, TX, USA) and used a fan to ventilate 10 volumes of air for every one volume of water passing counter-current
through the column. The down flow bubble contactors were connected to one control circuit and online O2 probe (Model DO6441,
Sensorex) per culture tank. The oxygen controller was used to maintain dissolved oxygen in the culture tanks at between 85% and 90%
of saturation. Although these RAS are equipped with systems for
ozonation, the recirculating water was not ozonated during the
study, to ensure that any nitrite accumulation due to the alkalinity
treatments could occur freely, without being oxidized by ozone.
Water flow rate through each MBBR and make-up water flow
rate were measured using magnetic flow meters (Sitrans FM
Magflo, Siemens, Munich, Germany) with continuous data logging (each fifth minute). Water flow through each MBBR (RAS1:
1147 ± 8 l/min, RAS2; 1148 ± 7 l/min) and make-up water flow
(RAS1: 9 ± 0 l/min, RAS2; 9 ± 0 l/min) were held constant throughout the study, and was similar between the RAS. Thus, 99.2% of
the flow was reused each pass through the RAS, and the daily system water exchange of each RAS was 23%, i.e. the mean hydraulic
retention time within each RAS was estimated to be 4.3 day. The
mean hydraulic retention time (HRT) through the 3.3 m3 fish culture tanks, 7 m3 MBBR chamber, and the 1.9 m3 sump below the
CO2 -degasser were 29 min, 5.3 min, and 1.9 min, respectively. Note,
pH was continuously monitored immediately after the cascade column in the sump for dosing sodium bicarbonate and controlling
pH/alkalinity. The approximately 1.9 min HRT within the sump
allowed the dehydration of carbonic acid, i.e., the rate limiting step
with a 22 s half-life, and reallocation of bicarbonate and carbonate (both nearly instantaneous) to return to acid–base equilibrium
(Kern, 1960; Grace and Piedrahita, 1994) and achieve a stable pH
immediately following CO2 stripping.
The biofilters had been connected to tanks with feeding salmon
parr for a least six months prior to the beginning of the study to
thoroughly establish the biofilters with bacteria. Ten weeks prior
to the experiment, all pipes were cleaned, and the CO2 degasser
media taken out and thoroughly cleaned. The biofilter media in
each RAS were taken out, mixed between RAS1/2 to ensure similar
biofilm and MBBR microbiota, and then returned in equal volume
(3.5 m3 ) to the RASs. Subsequently, each RAS was stocked with
similar biomass, and maintained on equal feed load (see below)
until start of the trial. All routine work on both RAS was conducted
equally, and at approximately the same time each day. In addition,
all daily flushing/scrubbing of sediments (i.e., the belt filter) and
flushing of tanks was done after water quality sampling had been
completed for the day.
2.3. Atlantic salmon
Atlantic salmon parr of SalmoBreed strain (SalmoBreed AS,
Bergen, Norway) was used. The fish were stocked into five 3.3 m3
culture tanks in each RAS seven weeks before initiating data collection, leaving five tanks with water circulating at same rate as
in the other tanks, but with no fish. To avoid too high fish density,
right after sampling period 8, half the number of fish of all five tanks
were moved into the five previously empty tanks. At the start of the
S.T. Summerfelt et al. / Aquacultural Engineering 65 (2015) 46–54
49
Table 1
Experimental treatment schedule. Both RAS were operated at each nominal treatment level for 2 weeks and each treatment was replicated three times in each of the two
replicate RAS.
Last treatment day
Treatment period
Nominal RAS#1 alkalinity (as CaCO3 )
Nominal RAS#2 alkalinity (as CaCO3 )
12/28/2010a
1/11/2011
1/25/2011
2/8/2011
2/22/2011
3/8/2011
3/22/2011
4/5/2011
4/19/2011
5/3/2011
1a
2
3
4
5
6
7
8
9
10
10
200
10
200
70
10
70
200
70
10
70
10
200
10
70
200
70
200
10
70
a
Treatment period 1 (10 and 70 mg/L alkalinity) was repeated after the final treatment, due to pH instabilities at the start of the study.
experiment (start of period 1) each of five tanks per RAS contained
3935 salmon parr of initial size of 61.1 ± 1.6 g (SD).
The salmon parr were fed commercial diets (EWOS Micro,
Bergen, Norway) with 3 mm pellet sizes throughout the study.
When changing feed lots (i.e. different shipments of same feed
type), samples were taken and analyzed for proximate composition, according to Terjesen et al. (2013), to ensure that minor feed
changes did not influence the system loads. The average proximal
chemical composition (% w/w of feed “as is”) was 94.0 ± 0.7 (SD) dry
matter, 46.9 ± 0.8 crude protein, 22.4 ± 0.5 fat, and 8.3 ± 0.1 ash.
Prediction of feed intake by the salmon smolt was estimated
according to fish size and water temperature using algorithms provided by the feed supplier. The day after beginning each treatment,
the average weight and number of individual fish per tank were
recorded in order to quantify the biomass of fish in each tank. Based
on these inputs, the number of fish that had to be removed from
WRAS
1 or 2
Legends:
NaHCO3
reservoir
Belt filter
w/sludge discharge
Pump sump
with alkalinity supply
pH
control
RAS flow
Make-up flow
MBBR inlet not in use
pH control data
Alkalinity flow
Make-up
water
Degasser
Moving bed bioreactor
Pump sump
with pH probe
Central
water
treatment
room
OxygenaƟon
Fish
tank
Fish
tank
Sidewall
drain
Fish
tank
Experimental
hall 1 or 2
Swirl
separator
w/sludge
discharge
Fig. 1. Process flow drawing of the two RAS used in this study. Only three fish tanks are shown, out of the 10 culture tanks that were used in each RAS during this study.
Refer to section 2.2 for description of components. Note that the moving bed bioreactor contains three chambers, but flow was only added at the head of the chamber closest
to the degasser during this study.
50
S.T. Summerfelt et al. / Aquacultural Engineering 65 (2015) 46–54
Table 2
Mean pH and alkalinity (±s.e.) measured in the sump below the CO2 stripping column for the three nominal alkalinity treatments, i.e., 10, 70, and 200 mg/L. Values represent
analyses of samples collected each 14th day of each treatment (n = 6 per treatment).
Nominal alkalinity (as CaCO3 )
RAS #1 alkalinity (as CaCO3 )
RAS #2 alkalinity (as CaCO3 )
RAS #1 pH
RAS #2 pH
10 mg/L
70 mg/L
200 mg/L
11 ± 1 mg/L
76 ± 5 mg/L
188 ± 17 mg/L
9 ± 1 mg/L
83 ± 6 mg/L
207 ± 29 mg/L
6.66 ± 0.13
7.73 ± 0.04
8.12 ± 0.03
6.43 ± 0.01
7.52 ± 0.04
7.90 ± 0.04
each system to maintain the 23 kg/day/RAS feed rate was calculated. The fish biomass was adjusted accordingly that same day.
2.4. Water quality monitoring
Water quality samples were collected after 14 days into each
treatment replicate. Each sampling event was done at the same
time each 14th day, starting at 08:00 and completed in two hours,
at 10:00 AM. Water samples for TAN (total ammonia nitrogen),
NO2 –N (nitrite nitrogen), NO3 –N (nitrate nitrogen), TSS (total suspended solids), CO2 , alkalinity, pH and TIC (total inorganic carbon)
were collected before and after the MBBR. In addition, CO2 , alkalinity, pH and TIC were also sampled after the CO2 stripping column,
i.e., in the sump below the CO2 stripping column. Handheld meters
were used for pH determination (Hach HQ40D with PHC10101
electrodes, Hach Lange, Düsseldorf, Germany), and these were twopoint calibrated using NBS buffers each day of use. In some cases,
dissolved CO2 was also estimated using an Oxyguard portable CO2
analyzer (Oxyguard, Birkerød, Denmark). Alkalinity was measured
by titration according to Standard Methods (APHA, 2005), using
a HACH Digital Titrator Model 16900 (Hach, Loveland, Colorado,
USA), and a Orion 720Aplus pH meter. TAN, NO2 –N, and NO3 –N
samples were analyzed using an autoanalyzer (Flow Solution IV, OI
Analytical, College Station, TX, USA), according to U.S. E.P.A Method
350.1 (U.S. EPA, 1983) for TAN and U.S. E.P.A Method 353.2 (U.S.
EPA, 1983) for NO3 –N and NO2 –N. TIC was analyzed on fresh samples kept on ice, collected with siphons and without air-bubbles
into glass flasks with tapered stoppers, according to method 6/93
Rev. B (Perstorp Analytical, Perstorp, Sweden); further details are
provided by Terjesen et al. (2013). TIC was also used to calculate
dissolved CO2 , using pH, and temperature measured at the same
time and location as when collecting water samples for TIC analysis. The carbonate system constants in Summerfelt et al. (2001)
were used in the calculations.
2.5. Statistical analyses
Data are presented as the treatment means ± s.e. unless otherwise noted. SPSS (Chigaco, IL, USA) syntax written for randomized
designs was used to assign alkalinity treatments randomly to
experimental period and to RAS #, with the constraint that no treatment was allowed to follow directly after a similar treatment, in
the same RAS (Table 1). Prior to statistical analyses all percentage
data were arcsine square root transformed. Analyses on the effects
of alkalinity were done using one-way ANOVAs in SPSS. If significant (p < 0.05), Tukey’s post hoc tests were subsequently applied to
determine between-treatment significant differences.
3. Results and discussion
The pH controller maintained relatively constant alkalinity for
each treatment replicate (i.e., for 10, 70, and 200 mg/L) throughout
the study (Table 2). For example, to maintain the low dose alkalinity treatment, the pH was controlled at 6.66 ± 0.13 and 6.43 ± 0.01
in the sump below the CO2 stripping column in RAS #1 and RAS
#2, respectively, while alkalinity in the same location averaged
11 ± 1 mg/L and 9 ± 1 mg/L as CaCO3 , respectively. The medium and
high dose alkalinity treatments were maintained similarly using pH
control (Table 2).
Significant differences were found between the quasi-steady
state TAN concentration measured between alkalinity concentrations at the MBBR inlet, MBBR outlet, and degasser sump (Table 3).
The mean TAN concentration entering the MBBR was reduced
from 0.65 ± 0.08 mg/L at the nominal 10 mg/L alkalinity treatment compared to 0.43 ± 0.04 mg/L and 0.39 ± 0.05 mg/L of TAN at
the nominal 70 mg/L and 200 mg/L alkalinity treatments, respectively. The mean TAN concentration exiting the MBBR dropped
from 0.39 ± 0.06 mg/L at the 10 mg/L as CaCO3 alkalinity treatment compared to 0.22 ± 0.03 mg/L and 0.23 ± 0.04 mg/L of TAN at
the 70 mg/L and 200 mg/L as CaCO3 alkalinity treatments. These
results suggest that the MBBR was able to maintain lower TAN
concentrations when alkalinity concentrations entering the MBBR
were maintained at nominal 70 or 200 mg/L as CaCO3 compared
to a sustained alkalinity of only 10 mg/L as CaCO3 alkalinity. No
differences in steady state TAN concentration were distinguished
between alkalinity treatments of 70 mg/L and 200 mg/L as CaCO3 .
Hence, our hypothesis that increased alkalinity reduces TAN concentrations in RAS for Atlantic salmon smolts was supported by the
results. In RAS for Atlantic salmon smolts, a relatively low TAN concentration is maintained, even as low as 0.2 mg/L (Dalsgaard et al.,
2013). Hence in such RAS, the TAN substrate concentration will not
be saturating. It must therefore be noted that in RAS operated for
other fish species, at higher intensities and much higher steadystate TAN levels, the alkalinity requirement may be different from
that found in the present study.
Regarding nitrite concentrations, unlike for TAN, no significant
differences were observed between treatments, which averaged
0.42–0.58 mg/L, and were quite variable (Table 3). In the same type
of RAS, we have earlier shown that although TAN and CO2 removal
capacity was higher than anticipated using common dimensioning
rules, nitrite removal did not meet specifications because higher
than 0.1 mg/L NO2 –N was observed. In a study comparing fixed bed
and moving bed reactors Suhr and Pedersen (2010) found no differences between the bioreactor systems in accumulation of NO2 –N.
The finding that the experimental treatments did not affect nitrite
in the present study, suggest that in this set-up, nitrite removal was
not limited by alkalinity. The mean NO3 –N concentration exiting
the MBBR ranged from 40 to 42 mg/L for the three treatments. No
significant change could be distinguished either in NO3 –N concentration across the MBBR, which indicates that equal TAN conversion
to NO3 –N occurred for the three treatments as was intended with
the use of equal fish feed loading throughout the study.
The mean areal nitrification rate across the MBBR ranged from
0.09 to 0.14 g/d/m2 (Table 4). There were significant differences
between the mean areal nitrification rates across the MBBR, i.e.,
0.14 ± 0.02 g/d/m2 and 0.09 ± 0.02 g/d/m2 , calculated at the alkalinity treatments of 10 mg/L and 200 mg/L as CaCO3 , respectively.
No differences were suggested in TAN removal efficiency across the
MBBR in a single pass, with removal efficiencies ranging from 41
to 50% removal for each treatment (Table 4). Interestingly, these
results suggest that the mean areal nitrification rates were significantly higher at a nominal alkalinity of 10 mg/L as CaCO3 compared
to 200 mg/L as CaCO3 , which is opposite of our hypothesis. Compared to previous studies, the areal nitrification rates reported here
S.T. Summerfelt et al. / Aquacultural Engineering 65 (2015) 46–54
51
Table 3
TAN concentration (±s.e.) measured at the MBBR inlet, MBBR outlet, and degasser sump, plus NO2 –N concentration measured at the MBBR outlet, at the low (10 mg/L),
medium (70 mg/L), and high (200 mg/L) alkalinity concentrations. Values represent analyses of samples collected each 14th day of each treatment (n = 6 per treatment).
Nominal alkalinity (as CaCO3 )
TAN MBBR inlet (mg/L)
TAN MBBR outlet (mg/L)
TAN Degasser sump (mg/L)
NO2 –N MBBR outlet (mg/L)
10 mg/L
70 mg/L
200 mg/L
0.65 ± 0.08b
0.43 ± 0.04ab
0.39 ± 0.05a
0.39 ± 0.06b
0.22 ± 0.03a
0.23 ± 0.04ab
0.37 ± 0.06b
0.19 ± 0.03a
0.20 ± 0.03a
0.42 ± 0.13a
0.58 ± 0.12a
0.52 ± 0.24a
Treatment means not sharing a common letter are significantly different (p < 0.05).
were similar to the areal rates measured across the same or larger
MBBRs in the same facility, except in this other study all three MBBR
chambers were utilized (Terjesen et al., 2013). Pfeiffer and Wills
(2011) reported an areal nitrification rate approximately twice that
measured in the present study; however, in that study the temperature was higher at 24–25 ◦ C. Two factors may explain the higher
areal removal rate at lower alkalinity. First, we should note that the
TAN production rate should be the same for all treatments because
the same amount of feed was consumed daily throughout the study.
Thus, the difference in the MBBR areal nitrification rates between
treatments could be explained by TAN removal on surfaces outside
of the MBBR, i.e., nitrification could have occurred in biofilms that
had formed on pipe, sump, tank and CO2 stripping column packing
surfaces. The higher alkalinity treatment (200 mg/L) may have supported more nitrification activity outside of the MBBR than the low
alkalinity treatment, which would explain the lower areal nitrification rate within the MBBR at the higher alkalinity. This hypothesis
tends to be supported by the higher TAN concentrations maintained
during the lower alkalinity conditions, possibly because less TAN
was removed on surfaces outside of the MBBR under low alkalinity
conditions. A second explanation is also based on the inlet TAN concentration that was higher at the 10 mg/L nominal alkalinity; earlier
nitrification kinetic studies demonstrates that increased substrate
concentration result in higher removal rates (Chen et al., 2006;
Rusten et al., 2006), as indeed found in the present study. However, at the lowest alkalinity treatment, 10 mg/L, the MBBR outlet
concentration was higher (Table 3), i.e. at this low alkalinity level
the same low outlet TAN concentration was not maintained. This is
indicated also by the unchanged removal efficiency (Table 4), and
the effect likely led to the higher steady-state TAN level at 10 mg/L,
as discussed above. The results invite to a more detailed investigation about the removal rates at different inlet concentrations,
at the three alkalinity levels. Possibly, at above 70 mg/L alkalinity,
the removal rate at lower inlet concentrations are higher, than at
low alkalinity, considering our findings of an unchanged efficiency
despite a significantly lower inlet TAN concentration. The present
areal nitrification rates were comparable to the rates reported by
Rusten et al. (2006). However, as shown in Fig. 8B of Terjesen et al.
(2013), the measured removal rates in the same type of RAS as
in the present study, were higher at the lowest effluent TAN concentrations, than could be predicted from Rusten et al. (2006). In
conclusion, future studies should investigate the hypothesis that
this MBBR is particularly efficient at very low inlet TAN concentrations, but that at such low substrate concentrations alkalinity
should be at or above 70 mg/L as CaCO3 .
The dissolved CO2 concentration entering the degasser did not
differ significantly between alkalinity treatments, and averaged
6.8 ± 0.7 mg/L (calculated from TIC), and 7 ± 0 mg/L (measured with
probe). The absolute removal of TIC (Table 5) was greater at the
highest alkalinity (1.65 mg/L TIC removed) than at the two lower
alkalinity treatments (0.97 and 0.93 mg/L TIC removed). This is supported by the findings of Colt et al. (2012), that the differences
between true CO2 removal (equal to the decrease in TIC) and the
apparent CO2 removal (equal to the decrease in CO2 concentration
after re-equilibration) are small for low alkalinities in freshwater but are larger in high alkalinities. A tendency (p = 0.11) was
Table 4
The mean areal nitrification rate (±s.e.), and mean TAN removal efficiency (±s.e.)
across the MBBR for the low (10 mg/L), medium (70 mg/L), and high (200 mg/L)
alkalinity treatments. Values represent analyses of samples collected each 14th day
of each treatment (n = 6 per treatment).
Nominal alkalinity
(as CaCO3 )
Areal nitrification ratea
(g/d/m2 )
TAN removal
efficiency (%)
10 mg/L
70 mg/L
200 mg/L
0.14 ± 0.02B
0.11 ± 0.01AB
0.09 ± 0.02A
41 ± 5
50 ± 3
43 ± 3
A,B
Treatment means not sharing a common letter are significantly different
(p < 0.05).
a
Areal nitrification rate was calculated by multiplying the flow rate of recirculating water passing through the biofilter with the change (i.e., inlet minus outlet) in
the combined TAN plus NO2 –N concentration across the biofilter; this product was
then divided by the total estimated surface area of media in the biofilter.
observed however, suggesting a higher CO2 stripping efficiency
at the 10 mg/L nominal alkalinity treatment when measured with
probe (Fig. 2), but this was not found when CO2 concentration was
calculated from the TIC concentration, pH, and temperature data.
The mean CO2 removal efficiencies ranged from 54 to 63% across the
1.6 m tall forced-ventilated aeration columns. This is quite effective considering that the mean CO2 inlet concentration was under
7 mg/L. In comparison, Moran (2010) reports that CO2 stripping
efficiency averaged 75–77% across a 1.65 m packing depth (similar
to the present study) at an inlet concentration of 10 mg/L (slightly
higher than the present study) in freshwater when measured with
a CO2 probe. The results on the mean removal efficiency are comparable to earlier studies in this RAS which was designed to avoid
70
CO2 from TIC
CO2 from probe
CO2 removal efficency (%)
a,b
65
60
55
50
45
40
10 mg/l
70 mg/l
200 mg/l
Nominal alkalinity
Fig. 2. Mean (± s.e.) CO2 stripping efficiency recorded across the forced ventilated
cascade aeration columns at the three alkalinity treatments, i.e., 10 mg/L, 70 mg/L,
and 200 mg/L as CaCO3 . Note that the white hatched bars and grey hatched bars
represent stripping efficiency where CO2 concentrations were calculated from TIC
measurements or probe measurements, respectively. Values represent analyses of
samples collected each 14th day of each treatment (n = 6 per treatment). Stripping efficiency was calculated from the difference in the column inlet and outlet
concentrations, divided by the inlet concentration, and multiplied by 100.
52
S.T. Summerfelt et al. / Aquacultural Engineering 65 (2015) 46–54
Table 5
Total inorganic carbon (TIC) loss at the three alkalinity treatments, divided into loss through nitrification, degasser, gain from make-up water, and loss through the overflow
in the degasser sump.
Component
Treatment (mg/L as CaCO3 )
a
TIC use in nitrification (C, g/min)
TIC inlet degasser (mg/L C)
TIC removal (%)
TIC removal (mg/L C)
System flow rate (l/min)
TIC loss degasser (C, g/min)
Make-up flow rate (l/min)
TIC make-up water (mg/L C)b
TIC from make-up (C, g/min)
TIC degasser sump (mg/L C)
TIC loss sump overflow (C, g/min)
Total TIC loss (C, g/min)
10
70
200
0.3
2.5
38.3
0.97
1150
1.1
9.0
4.1
0.0
1.6
0.0
0.2
21.0
4.4
0.93
1147
1.1
9.0
4.1
0.0
20.0
0.2
0.2
41.3
4.0
1.65
1146
1.9
9.0
4.1
0.0
39.7
0.4
1.4
1.4
2.4
a
Calculated using TAN removal for the three treatments (Table 3), system flow rate, and an alkalinity consumption of 7.07 g CaCO3 per g TAN removed in nitrification (Chen
et al., 2006).
b
The make-up water TIC concentration refers to measurements on samples collected after period 10.
concentration), would amount to only 0.02–0.03 g/min. Thus, loss
of TIC to nitrification in the CO2 stripping column is negligible in
practice compared to the loss due to CO2 stripping.
The RAS pH was significantly lower at an alkalinity of 10 mg/L
than at the two higher alkalinity treatments (Table 2). It was also
observed that pH oscillations were more pronounced at the lowest
alkalinity, since little buffer capacity existed and the dosing controller therefore produced more under- and overshooting of the
set-point. Furthermore, we found a significant inverse linear correlation (r2 = 0.96, p < 0.001, n = 20, data log10 transformed) between
alkalinity and the difference between degasser sump [H+ ] and
MBBR inlet [H+ ]. Thus, as expected the H+ concentration increased
more through the culture tanks at lower alkalinity. When switching
alkalinity treatments, the rate of the pH decline accelerated from
200 mg/L alkalinity, to 70 mg/L, and was especially rapid down to a
pH typical of the 10 mg/L treatment (Fig. 4). This trend is analogous
to the situation that will occur during alkalinity dosing malfunction.
Hence, in a RAS operated at very low alkalinity, the time available for replacing the dosing equipment, before adverse effects on
the fish occur from high CO2 , will be considerably less than when
operating at 70 or 200 mg/L alkalinity.
50
B
40
TIC
removal efficency (%)
CO2 levels above 10 mg/L (Terjesen et al., 2013), concentrations that
may have adverse effects on Atlantic salmon performance, health
and welfare (Fivelstad, 2013).
Results from the present study did not support our fourth
hypothesis, i.e., that increased alkalinity would decrease CO2
removal efficiency. We had assumed that dissolved CO2 removal
efficiency would decrease across the cascade column at high
alkalinities because the CO2 concentration at the outlet of the
column would be partly replenished by a shift in acid–base equilibrium from this large pool of carbonate. However, Colt et al.
(2012) suggests that in freshwater, there is no practical difference (i.e., <1% difference) between the apparent CO2 removal rate
and the true CO2 removal rate when the alkalinity is 100 mg/L as
CaCO3 (2 meq/L) or less. They note that the difference in apparent CO2 removal rate and the true CO2 removal rate would
be less than or equal to 5% when the alkalinity is 200 mg/L as
CaCO3 (4 meq/L). Thus, for practical purposes, CO2 stripping is not
impacted by acid–base equilibrium at the higher alkalinity concentrations tested. From the perspective of a steady-state mass
balance, this suggests that the concentration of CO2 accumulating in identical RAS that are receiving the same feed rate and are
operated at the same water flow rate would have the same steadystate CO2 concentration exiting the culture tank (and exiting the
biofilter), because CO2 production and removal are not impacted
by alkalinity under the alkalinity range typically used in RAS. Thus,
dissolved CO2 stripping efficiency is predicted to be a fixed property of a degassing unit, irrespective of alkalinity under freshwater
conditions, when alkalinity is ≤200 mg/L as CaCO3 .
The TIC concentration increased with alkalinity, and was significantly different (p < 0.001) between all treatments, as would
be expected. In the degasser inlet, TIC averaged 2.5 ± 0.8 mg/L at
10 mg/L nominal alkalinity, 21.0 ± 1.3 mg/L at 70 mg/L alkalinity,
and 41.3 ± 5.1 mg/L at 200 mg/L nominal alkalinity. At the lowest
alkalinity treatment, nominal 10 mg/L, the relative CO2 -fraction in
TIC increased because the pH was also reduced (Table 2). This difference in TIC composition influenced the fate of the carbon when
passing the CO2 degasser. When the RAS water entered the CO2
stripping column at 10 mg/L alkalinity, as much as 38% of the system carbon was removed. In contrast, at the two higher alkalinities
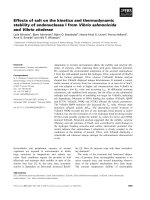
only 4% of the TIC was lost when passing the degasser (Fig. 3).
Over all treatments, TIC removal from the RAS averaged only
0.2–0.3 g/min due to nitrification and 1.1–1.9 g/min due to CO2
stripping (Table 5). We also estimate that TIC removal due to
the nitrification within the CO2 stripping column (probably <10%
of nitrification occurring in the MBBR based on surface area and
30
20
10
A
A
70 mg/l
200 mg/l
0
10 mg/l
Nominal alkalinity
Fig. 3. Mean (± s.e.) of the relative amount of total inorganic carbon (TIC) removed
across the forced ventilated cascade aeration columns at the three nominal alkalinity treatments, i.e., 10 mg/L, 70 mg/L, and 200 mg/L as CaCO3 . Values represent
analyses of samples collected each 14th day of each treatment (n = 6 per treatment).
Treatment means not sharing a common letter are significantly different (p < 0.05).
S.T. Summerfelt et al. / Aquacultural Engineering 65 (2015) 46–54
8.5
200 mg/L alk, pH 7.98
Time day 0, end dosing
pH
(degasser reservoir)
8.0
pH 7.68, 2.5 days,
-0.12 pH/day
7.5
7.0
Dosing
re-established
pH 6.4, 5 days,
-0.5 pH/day
6.5
6.0
-1
0
1
2
3
4
5
Days
Fig. 4. Effect of stopping alkalinity dosing on RAS pH, at a constant feed loading to
the system. Note the accelerating decline in pH with time. Alkalinity dosing was reestablished at pH 6.4. The pH values of 7.98, 7.68, and 6.4 were typical of alkalinities
of nominally 200 mg/L, 70 mg/L, and 10 mg/L as CaCO3 , respectively.
Alkalinity dosing constitutes a cost for the RAS farmer. This is
especially evident when using soft make-up water sources that are
low in alkalinity, which is the case at many locations in Norway
(Kristensen et al., 2009) but not in e.g., Eastern U.S (Davidson et al.,
2011). When the make-up water source is low in alkalinity, dosing
of e.g., bicarbonate must be used. The decision on the controlled
alkalinity concentration must be based on effects on the fish, nitrification, degassing, pH stability and loss of carbon through the RAS
loop. An inorganic carbon budget was made for the three experimental treatments in the present study (Table 5), incorporating
components that differed between treatments. The most significant
component was the loss of TIC through the degasser. The 200 mg/L
alkalinity treatment showed the highest absolute loss through the
degasser, as well as for total inorganic carbon loss out of the system (including TIC lost to water flushing; Table 5). Although only
4% of the TIC entering the degasser is removed in the 200 mg/L alkalinity treatment, the considerably higher TIC concentration in this
treatment made the removal significant.
In conclusion, Atlantic salmon smolt producers using soft water
make-up sources, and wishing to keep a relatively low steady-state
TAN and CO2 concentration in line with salmon tolerances, should
aim for 70 mg/L alkalinity considering the relatively low loss of carbon compared to 200 mg/L alkalinity, and the increased pH stability
as well as reduced TAN concentration, compared to when using
10 mg/L alkalinity. In the present study, the experimental design
precluded studying effects of alkalinity on salmon smolt performance, physiology, and welfare, and such investigations should
therefore be undertaken in future studies.
4. Conclusions
This study was conducted in semi-commercial scale RAS, at
typical water qualities found in Atlantic salmon smolt production
facilities. At these conditions, it was found that a low alkalinity (10 mg/L as CaCO3 ) led to a significantly higher steady-state
TAN concentration, compared when 70 or 200 mg/L alkalinity was
used. The mean areal nitrification rate was higher at the lowest
alkalinity; however, the mean TAN removal efficiency across the
MBBR was not significantly affected by alkalinity treatment. The
CO2 stripping efficiency showed only a tendency towards higher
53
efficiency at the lowest alkalinity, but differences were not significant. Thus, dissolved CO2 stripping efficiency across a degassing
unit is independent of alkalinity under freshwater conditions, when
alkalinity is ≤200 mg/L as CaCO3 . In contrast, the relative fraction of
total inorganic carbon that was removed from the RAS during CO2
stripping was much higher at a low alkalinity (10 mg/L) compared
to the higher alkalinities (70 and 200 mg/L as CaCO3 ). However,
when calculating the total absolute loss of inorganic carbon from
RAS, it was found that the daily loss was about equal at 10, and
70 mg/L, whereas it was highest at 200 mg/L alkalinity. pH recordings demonstrated that the 10 mg/L alkalinity treatment resulted
in the lowest system pH, the largest increase in [H+ ] across the fish
culture tanks, as well as giving little response time in case of alkalinity dosing malfunction. Rapid pH changes under the relatively
acidic conditions at 10 mg/L alkalinity may ultimately create fish
health issues due to CO2 or if aluminium or other metals are present.
In conclusion, Atlantic salmon smolt producers using soft water
make-up sources should aim for 70 mg/L alkalinity considering
the relatively low loss of inorganic carbon compared to 200 mg/L
alkalinity, and the increased pH stability as well as reduced TAN
concentration, compared to when using 10 mg/L alkalinity.
Acknowledgements
The authors wish to express special thanks to Britt Seljebø,
Kristin Nerdal, and Dag Egil Bundgaard for water chemistry analysis. We also thank two reviewers for their valuable comments. The
authors also wish to thank the reviewers, who provided insightful comments and suggestions. This research was supported by the
Research Council of Norway through the Strategic Institute Program (project no. 186913/I30) “Fish welfare and performance in
recirculating aquaculture systems”. All experimental protocols and
methods were in compliance with the animal welfare requirements
by the Norwegian Animal Research Authority. Use of trade names
does not imply endorsement by Nofima or the authors.
References
APHA, 2005. In: Eaton, A., Clesceri, L., Rice, E., Greenberg, A. (Eds.), Standard methods
for the examination of water and wastewater. American Public Health Association, Washington, USA.
Bergheim, A., Drengstig, A., Ulgenes, Y., Fivelstad, S., 2009. Production of Atlantic
salmon smolts in Europe—current characteristics and future trends. Aquac. Eng.
41, 46–52.
Biesterfeld, S., Farmer, G., Russell, P., Figueroa, L., 2003. Effect of alkalinity type and
concentration on nitrifying biofilm activity. Water Environ. Res. 75, 196–204.
Chen, S., Ling, J., Blancheton, J.-P., 2006. Nitrification kinetics of biofilm as affected
by water quality factors. Aquac. Eng. 34, 179–197.
Clingerman, J., Bebak, J., Mazik, P.M., Summerfelt, S.T., 2007. Use of avoidance
response by rainbow trout to carbon dioxide for fish self-transfer between tanks.
Aquac. Eng. 37, 234–251.
Colt, J., 2006. Water quality requirements for reuse systems. Aquac. Eng. 34, 143–156.
Colt, J., Watten, B., Pfeiffer, T., 2012. Carbon dioxide stripping in aquaculture. Part 1:
terminology and reporting. Aquac. Eng. 47, 27–37.
Dalsgaard, J., Lund, I., Thorarinsdottir, R., Drengstig, A., Arvonen, K., Pedersen, P.B.,
2013. Farming different species in RAS in Nordic countries: current status and
future perspectives. Aquac. Eng. 53, 2–13.
Danley, M.L., Kenney, P.B., Mazik, P.M., Kiser, R., Hankins, J.A., 2005. Effects of carbon
dioxide exposure on intensively cultured rainbow trout Oncorhynchus mykiss:
physiological responses and fillet attributes. J. World Aquac. Soc. 36, 249–261.
Davidson, J., Good, C., Welsh, C., Brazil, B., Summerfelt, S., 2009. Heavy metal and
waste metabolite accumulation and their potential effect on rainbow trout performance in a replicated water reuse system operated at low or high system
flushing rates. Aquac. Eng. 41, 136–145.
Davidson, J., Good, C., Welsh, C., Summerfelt, S., 2011. The effects of ozone and water
exchange rates on water quality and rainbow trout performance in replicated
water recirculating systems. Aquac. Eng. 44, 80–96.
Espmark, Å., Kolarevic, J., Åsgård, T., Willumsen, F., Lange, G., Alfredesen, J., Alver,
M., Terjesen, B., 2013. Tank size in experimental design matters. In: Aquaculture
Europe 2013, Trondheim, Norway, p. 130.
Fivelstad, S., 2013. Long-term carbon dioxide experiments with salmonids. Aquac.
Eng. 53, 40–48.
54
S.T. Summerfelt et al. / Aquacultural Engineering 65 (2015) 46–54
Fivelstad, S., Haavik, H., Løvik, G., Olsen, A.B., 1998. Sublethal effects and safe levels
of carbon dioxide in seawater for Atlantic salmon postsmolts (Salmo salar L.):
ion regulation and growth. Aquaculture 160, 305–316.
Fivelstad, S., Olsen, A.B., Asgard, T., Bæverfjord, G., Rasmussen, T., Vindheim,
T., Stefansson, S., 2003a. Long-term sublethal effects of carbon dioxide on
Atlantic salmon smolts (Salmo salar L.): ion regulation, haematology, element composition, nephrocalcinosis and growth parameters. Aquaculture 215,
301–319.
Fivelstad, S., Olsen, A.B., Kløften, H., Ski, H., Stefansson, S., 1999. Effects of carbon
dioxide on Atlantic salmon (Salmo salar L.) smolts at constant pH in bicarbonate
rich freshwater. Aquaculture 178, 171–187.
Fivelstad, S., Waagbø, R., Stefansson, S., Olsen, A.B., 2007. Impacts of elevated water
carbon dioxide partial pressure at two temperatures on Atlantic salmon (Salmo
salar L.) parr growth and haematology. Aquaculture 269, 241–249.
Fivelstad, S., Waagbø, R., Zeitz, S.F., Hosfeld, A.C.D., Olsen, A.B., Stefansson, S., 2003b.
A major water quality problem in smolt farms: combined effects of carbon
dioxide, reduced pH and aluminium on Atlantic salmon (Salmo salar L.) smolts:
physiology and growth. Aquaculture 215, 339–357.
Grace, G., Piedrahita, R., 1994. Carbon dioxide control. In: Timmons, M.B., Losordo,
T.M. (Eds.), Aquaculture Water Reuse Systems: Engineering Design and Management. Elsevier Science, New York, NY, pp. 209–234.
Grisdale-Helland, B., Helland, S.J., 1997. Replacement of protein by fat and carbohydrate in diets for Atlantic salmon (Salmo salar) at the end of the freshwater
stage. Aquaculture 152, 167–180.
Gutierrez, A., Kolarevic, J., Sæther, B., Bæverfjord, G., Takle, H., Medina, H., Terjesen,
B., 2011. Effects of sub-lethal nitrite exposure at high chloride background during the parr stage of Atlantic salmon. In: Aquaculture Europe 2011 Proceedings,
Rhodes, Greece, pp. 1080–1081.
Hosfeld, C.D., Engevik, A., Mollan, T., Lunde, T.M., Waagbø, R., Olsen, A.B., Breck, O.,
Stefansson, S., Fivelstad, S., 2008. Long-term separate and combined effects of
environmental hypercapnia and hyperoxia in Atlantic salmon (Salmo salar L.)
smolts. Aquaculture 280, 146–153.
Kern, D., 1960. The hydration of carbon dioxide. J. Chem. Educ. 37, 14–23.
Kolarevic, J., Baeverfjord, G., Takle, H., Ytteborg, E., Reiten, B.K.M., Nergård,
S., Terjesen, B.F., 2014. Performance and welfare of Atlantic salmon smolt
reared in recirculating or flow through aquaculture systems. Aquaculture,
(in press).
Kolarevic, J., Bæverfjord, G., Åsgård, T., Oehme, M., Takle, H., Ytterborg, E., GrisdaleHelland, B., Helland, S., Terjesen, B., 2009. Effects of light intensity and period
on feed intake, growth and respiration in Atlantic salmon (Salmo salar) in freshwater. In: Aquaculture Europe 2009, European Aquaculture Society, Trondheim,
Norway, pp. 323–324.
´ J., Ciric,
´ M., Zühlke, A., Terjesen, B.F., 2011. On-line pH measurements in
Kolarevic,
recirculating aquaculture systems (RAS). In: Aquaculture Europe 2011, European
Aquaculture Society, Trondheim, Norway, pp. 570–571.
Kolarevic, J., Selset, R., Felip, O., Good, C., Snekvik, K., Takle, H., Ytteborg, E., Bæverfjord, G., Åsgård, T., Terjesen, B.F., 2013. Influence of long term ammonia
exposure on Atlantic salmon (Salmo salar L.) parr growth and welfare. Aquac.
Res. 44, 1649–1664.
Kristensen, T., Åtland, Å., Rosten, T., Urke, H., Rosseland, B.O., 2009. Important
influent–water quality parameters at freshwater production sites in two salmon
producing countires. Aquac. Eng. 41, 53–59.
Landolt, M., 1975. Visceral granuloma and nephrocalcinosis in trout. In: Ribelin,
W., Migaki, G. (Eds.), The Pathobiology of Fishes. University of Wisconsin Press,
Madison, pp. 793–799.
Loyless, J.C., Malone, R.F., 1997. A sodium bicarbonate dosing methodology for ph
management in freshwater-recirculating aquaculture systems. Progressive FishCulturist, vol. 59., pp. 198–205.
Moran, D., 2010. Carbon dioxide degassing in fresh and saline water. I: degassing
performance of a cascade column. Aquac. Eng. 43, 29–36.
Mydland, L., Rud, I., Rudi, K., Ulgenes, Y., Ibieta, P., Gutierrez, X., Reiten, B., Summerfelt, S., Terjesen, B., 2010. Water quality and microbial community shifts
during start-up, disturbances and steady-state in a new moving bed bioreactor.
In: Aquaculture Europe 2010, Porto, Portugal.
Paz, J., 1984. The Effects of Borderline Alkalinity on Nitrification in Natural Water
Systems. Polytechnic Institute of New York, New York, pp. 125.
Pfeiffer, T.J., Wills, P.S., 2011. Evaluation of three types of structured floating plastic
media in moving bed biofilters for total ammonia nitrogen removal in a low
salinity hatchery recirculating aquaculture system. Aquac. Eng. 45, 51–59.
Rusten, B., Eikebrokk, B., Ulgenes, Y., Lygren, E., 2006. Design and operations of the
Kaldnes moving bed biofilm reactors. Aquac. Eng. 34, 322–331.
Skogheim, O., Rosseland, B., 1986. Mortality of smolt of Atlantic salmon, Salmo salar
L., at low levels of aluminium in acidic softwater. Bull. Environ. Contam. Toxicol.
37, 258–265.
Suhr, K.I., Pedersen, P.B., 2010. Nitrification in moving bed and fixed bed biofilters
treating effluent water from a large commercial outdoor rainbow trout RAS.
Aquac. Eng. 42, 31–37.
Summerfelt, S.T., Sharrer, M.J., 2004. Design implication of biofilter carbon dioxide production within recirculating salmonid culture systems. Aquac. Eng. 32,
171–182.
Summerfelt, S., Bebak-Williams, J., Tsukuda, S., 2001. Controlled systems: water
reuse and recirculation. In: Wedermeyer, G. (Ed.), Second Edition of Fish Hatchery Management. American Fisheries Society, Bethesda, pp. 285–395.
Summerfelt, S.T., Vinci, B.J., Piedrahita, R.H., 2000. Oxygenation and carbon dioxide
control in water reuse systems. Aquac. Eng. 22, 87–108.
Tarre, S., Green, M., 2004. High-rate nitrification at low ph in suspended- and
attached-biomass reactors. Appl. Envrion. Microbiol. 70, 6481–6487.
Terjesen, B.F., Summerfelt, S.T., Nerland, S., Ulgenes, Y., Fjæra, S.O., Megård Reiten,
B.K., Selset, R., Kolarevic, J., Brunsvik, P., Bæverfjord, G., Takle, H., Kittelsen, A.,
Åsgård, T., 2013. Design, dimensioning, and performance of a research facility
for studies on the requirements of fish in RAS environments. Aquac. Eng. 54,
49–63.
U.S. EPA, 1975. Process Design Manual for Nitrogen Control. Office of Technology
Transfer. Environmental Protection Agency, Washington, DC, USA.
U.S. EPA, 1983. Methods for chemical analysis of water and wastes. Environmental
Protection Agency, Cincinnati, OH, USA, pp. 491.
Villaverde, S., García-Encina, P.A., Fdz-Polanco, F., 1997. Influence of pH over nitrifying biofilm activity in submerged biofilters. Water Res. 31, 1180–1186.