Effects on water quality of additional mechanical aeration split pond aquaculture systems
Bạn đang xem bản rút gọn của tài liệu. Xem và tải ngay bản đầy đủ của tài liệu tại đây (6.93 MB, 91 trang )
Effects on Water Quality of Additional Mechanical Aeration in the Waste-Treatment Cells
in Split-Pond Aquaculture Systems for Hybrid Catfish Production
by
Lauren Nicole Jescovitch
A dissertation submitted to the Graduate Faculty of
Auburn University
in partial fulfillment of the
requirements for the Degree of
Doctor of Philosophy
Auburn, Alabama
May 7, 2017
Keywords: split-ponds, aeration, water quality, pond engineering
Copyright 2017 by Lauren Nicole Jescovitch
Approved by
Claude E. Boyd, Chair, Professor Emeritus, School of Fisheries, Aquaculture and Aquatic
Sciences
Yolanda Brady, Associate Professor Emerita, School of Fisheries, Aquaculture and Aquatic
Sciences
Donald Allen Davis, Alumni Professor, School of Fisheries, Aquaculture and Aquatic Sciences
Philip Chaney, Associate Professor, Department of Geosciences
George W. Crandell, Associate Dean, Graduate School
Abstract
Split-pond aquaculture is a new, innovative system for intensification of pond
aquaculture in the southeastern USA. Split ponds have a fish cell and a waste cell, approximately
20% water surface area and 80% water surface area, respectively, in which water recirculates to
improve water quality and allow more intensive production than possible in traditional ponds.
This three-year study focuses on the possible benefits of using mechanical aeration in the wastetreatment section of the split-pond culture system.
The present study was conducted on a commercial catfish farm in west Alabama that has
eight split-ponds, each with a fish-holding section of approximately 8,000 m2. Water quality was
assessed through a variety of parameters that had the potential to be affected by oxygen using
standard analytical chemical procedures in the field and laboratory. Further investigation also
determined poor circulation rates and aeration in split-ponds because of poor management.
This dissertation discusses water quality and intensification of pond aquaculture, water
quality and aeration in split-pond waste cells, and best practices of the split-pond design.
ii
Acknowledgments
The author would like to offer her love and sincere gratitude to her family for their
continuous support throughout this dissertation. She also wants to thank Dr. Claude E. Boyd for
giving her the opportunity to learn and study aquaculture, and gain teaching experience for the
past 5-years under his guidance and wisdom.
The author would like to express appreciation to June Burns, committee members,
colleagues and lab mates - especially Piyajit Pratipasen and Hisham Abdelrahman – for
assistance in this study and support for various professional opportunities that she completed
while attending Auburn University.
iii
Table of Contents
Abstract ......................................................................................................................................... ii
Acknowledgments........................................................................................................................ iii
Table of Contents ......................................................................................................................... iv
List of Tables ............................................................................................................................... vi
List of Figures ............................................................................................................................ viii
Chapter 1 – Introduction & Review of Literature ......................................................................... 1
1.1 Water Quality in Aquaculture ................................................................................... 1
1.1.1 Mechanical Aeration and Dissolved Oxygen ............................................. 2
1.1.2 Organic Matter .............................................................................................. 4
1.1.3 Nitrification ................................................................................................... 4
1.2 Traditional Pond Design in Southeastern USA ......................................................... 7
1.2.1 Split-Pond Design ................................................................................................... 9
Chapter 2 – Split-Pond Water Quality ........................................................................................ 13
2.1 Abstract .................................................................................................................. 13
2.2 Introduction ............................................................................................................ 14
2.3 Materials and Methods ........................................................................................... 16
2.3.1 Design ....................................................................................................... 16
2.3.2 Water quality analyses ................................................................................ 17
2.3.3 Non-routine Analyses ................................................................................. 19
2.4.4 Statistical Analyses ..................................................................................... 20
2.4 Results ...................................................................................................................... 20
2.4.1 Production ................................................................................................. 20
iv
2.4.2 Background water quality ........................................................................... 21
2.4.3 Water quality ............................................................................................... 21
2.4.4 Non-Routine analyses ................................................................................. 23
2.5 Discussion ................................................................................................................ 24
2.5.1 Complications ............................................................................................. 28
2.6 Conclusions .............................................................................................................. 30
Chapter 3 – Split-Pond Aquaculture System Design and Dissolved Oxygen Management....... 49
3.1 Abstract ................................................................................................................. 49
3.2 Introduction ........................................................................................................... 50
3.3 Materials and Methods .......................................................................................... 52
3.3.1 Design ....................................................................................................... 52
3.3.2 Circulation and mixing ............................................................................... 53
3.3.3 Dissolved oxygen ........................................................................................ 54
3.4.4 Statistical Analyses ..................................................................................... 54
3.4 Results ...................................................................................................................... 55
3.4.1 Production ................................................................................................. 55
3.4.2 Circulation and mixing ............................................................................... 55
3.4.3 Dissolved oxygen ........................................................................................ 56
3.5 Discussion ............................................................................................................... 57
3.5.1 Design ......................................................................................................... 57
3.5.2 Production and water quality management ................................................. 60
3.5.3 Paddlewheels/Pumps................................................................................... 61
3.5.4 Complications ............................................................................................. 62
3.6 Conclusion .............................................................................................................. 63
v
List of Tables
Table 2.1. Average pond measurements for fish and waste cells for control and aerated waste cell
ponds using Google Earth Pro for surface area and a meter stick for depth ............................... 35
Table 2.2. Average stocking rates, feed inputs, production, net yields, and feed conversion ratio
(FCR) for control and aerated-waste cell ponds for multiple-batch management system over three
years (2014-2016). Area includes both fish and waste cell assimilation. Significant differences
are noted by letters (P<0.05) ......................................................................................................... 36
Table 2.3. Average pH, Secchi disk visibility, and concentrations of other water quality variables
in control ponds and ponds with aerated waste cells for six sampling data as background data
(June-July, 2014). Significant differences are noted by letters (P<0.05) ..................................... 37
Table 2.4. Average pH, Secchi disk visibility, and concentrations of other water quality variables
in control ponds and ponds with aerated waste cells for seven sampling data in year one (AugustDecember, 2014). Significant differences are noted by letters (P<0.05) . .................................... 38
Table 2.5. Average pH, Secchi disk visibility, and concentrations of other water quality variables
in control ponds and ponds with aerated waste cells for seven sampling data in year two
(January-December, 2015). Significant differences are noted by letters (P<0.05) .................... 39
Table 2.6. Average pH, Secchi disk visibility, and concentrations of other water quality variables
in control ponds and ponds with aerated waste cells for eight sampling data for year three
(January-September, 2016). Significant differences are noted by letters (P<0.05) . .................... 40
Table 2.7. Average values for non-routine variables (2015-2016). Significant differences are
noted by letters (P<0.05) . ............................................................................................................. 45
Table 2.8. Average values of soil parameters for eight sampling data in year two (2015)
Significant differences are noted by letters (P<0.05). .................................................................. 48
Table 3.1. Average pond measurements for fish and waste cells for control and aerated-waste cell
ponds. . .......................................................................................................................................... 68
Table 3.2. Average stocking rates, feed inputs, production, net yields, and feed conversion ratio
(FCR) for control and aerated-waste cell ponds for multiple-batch management system over three
years (2014-2016). Area includes both fish and waste cell assimilation. Significant differences
are noted by letters (P<0.05) . ....................................................................................................... 69
vi
Table 3.3. Averages of DO and temperature for background and year 1-3 (2014-2016) in control
and additional aerated waste cell ponds in the fish and waste cells............................................ 79
Table 3.4. Number of hours recorded when the DO dropped between 0-0.5 mg/L, 0.6-1.0 mg/L,
1.1-1.5 mg/L, 1.6-2.0 mg/L, 2.1-2.5 mg/L, 2.6-3.0 mg/L, and total hours of DO collected for
control and additional aerated waste cell ponds. ........................................................................ 80
Table 3.5. Number of pumps and aerators for each treatment group throughout all three years of
the study ...................................................................................................................................... 81
vii
List of Figures
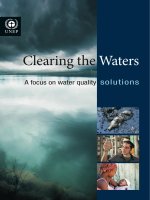
Figure 2.1. Study site in Hale County, Alabama. Control Ponds: 3, 5, 7, 13; Aerated wastetreatment cell ponds: 4, 8, 9, 10 as noted by symbols. Picture taken using Google Earth Pro ... 33
Figure 2.2. Typical split pond used in this study. This pond has waste cell aerators placed where
water is traveling through a pipe between the fish cell and waste cell. Picture taken using Google
Earth Pro. .................................................................................................................................... 34
Figure 2.3. Water quality averages (pH, secchi disk visibility, and chlorophyll a) for background,
and years 1-3 of study for control-in, control-out, aerated-in, and aerated-out sample locations 41
Figure 2.4. Water quality averages (total phosphorus, total and soluble COD) for background,
and years 1-3 of study for control-in, control-out, aerated-in, and aerated-out sample locations.42
Figure 2.5. Water quality averages (total nitrogen, TAN, nitrite nitrogen, nitrate nitrogen) for
background, and years 1-3 of study for control-in, control-out, aerated-in, and aerated-out sample
locations. ..................................................................................................................................... 43
Figure 2.6. Ammonia nitrogen averages for background, and years 1-3 of study for control-in,
control-out, aerated-in, and aerated-out sample locations. US EPA (2013) limits for acute and
chronic ammonia nitrogen concentrations are illustrated. . ........................................................ 44
Figure 2.7. Total alkalinity concentrations for control and aerated waste cell ponds during
acidification trials. ...................................................................................................................... 46
Figure 2.8. Average pH measurements. Measurements were taken every 3 hours for 24 hours for
control-in, control-out, aerated-in, and aerated-out sample locations. . ..................................... 47
Figure 3.1. Study site in Hale County, Alabama. Control Ponds: 3, 5, 7, 13; Aerated wastetreatment cell ponds: 4, 8, 9, 10 as noted by symbols. Picture taken using Google Earth Pro. .. 66
Figure 3.2. Typical split pond used in this study. This pond has waste cell aerators placed where
water is traveling through a pipe between the fish cell and waste cell. Picture taken using Google
Earth Pro. . .................................................................................................................................. 67
Figure 3.3. Average velocities measured during circulation study at surface, midway, and bottom
of waste cell. Stars indicate where measurements were collected.. ............................................ 70
Figure 3.4. Background dissolved oxygen data in the fish cells of the control and aerated waste
cell ponds. Dots indicate daily fluctuations on a given day. Darker areas have higher
occurrences. . .............................................................................................................................. 71
viii
Figure 3.5. Background dissolved oxygen data in the waste cells of the control and aerated waste
cell ponds. Dots indicate daily fluctuations on a given day. Darker areas have higher
occurrences. . .............................................................................................................................. 72
Figure 3.6. Year 1 (Aug- Dec 2014) oxygen data in the fish cells of the control and aerated waste
cell ponds. Dots indicate daily fluctuations on a given day. Darker areas have higher
occurrences. . .............................................................................................................................. 73
Figure 3.7. Year 1 (Aug- Dec 2014) oxygen data in the waste cells of the control and aerated
waste cell ponds. Dots indicate daily fluctuations on a given day. Darker areas have higher
occurrences. . .............................................................................................................................. 74
Figure 3.8. Year 2 (Jan-Dec 2015) dissolved oxygen data in the fish cells of the control and
aerated waste cell ponds. Dots indicate daily fluctuations on a given day. Darker areas have
higher occurrences. . ................................................................................................................... 75
Figure 3.9. Year 2 (Jan-Dec 2015) dissolved oxygen data in the waste cells of the control and
aerated waste cell ponds. Dots indicate daily fluctuations on a given day. Darker areas have
higher occurrences. . ................................................................................................................... 76
Figure 3.10. Year 3 (Jan-Oct 2016) dissolved oxygen data in the fish cells of the control and
aerated waste cell ponds. Dots indicate daily fluctuations on a given day. Darker areas have
higher occurrences. . ................................................................................................................... 77
Figure 3.11. Year 3 (Jan-Oct 2016) dissolved oxygen data in the waste cells of the control and
aerated waste cell ponds. Dots indicate daily fluctuations on a given day. Darker areas have
higher occurrences. . ................................................................................................................... 78
Figure 3.12. Average hours/aerator there were operational during background and year 1-3
(2014-2016) of this study for pumps, fish, and waste cells in control and additional aerated
ponds. . ........................................................................................................................................ 82
ix
Chapter 1 – Introduction & Review of Literature
1.1 Water Quality in Aquaculture
There are many aspects of aquaculture management, and one of the most important is
water quality. Water quality is dependent on various physical factors (climate, light, temperature,
etc), water composition (phosphorus, nitrogen, metals, etc.), aquatic plants, soil, and aquaculture
species, and type of production system. Water quality can be managed, but because of the
complex nature of the factors mentioned above, water quality variables cannot be predicted
accurately and must be measured at frequent intervals. Water quality variable concentrations
measured at a particular time provide managers with real-time data, but such data often cannot be
used to accurately project the concentrations that these parameters will be 24 hours later.
Farmers need to monitor water quality so they can observe trends in changes of concentrations
and adapt their management practices accordingly. Many water qualities are interrelated and
interact with each other (Xu and Boyd, 2016), and changes in one variable gives insight about
changes in a related variable. Water quality can have severe effects on living organisms if not
managed properly. Rapid changes in concentration or high levels of some variables are thought
to compromise immunocompetence of animals and make them more susceptible to pathogenic
organisms (Hargraves and Tucker, 2003).
1
1.1.1 Mechanical Aeration and Dissolved Oxygen
Dissolved oxygen (DO) in water is an extremely important water quality parameter to
living organisms, and especially to fish. Chronically low DO concentration is associated with
poor appetite, and low feed consumption (Boyd, 2015; Boyd and Tucker, 2014; Green and
Rawles, 2011; Torrans, 2005).
Dissolved oxygen concentrations in aquaculture systems should be maintained at
resonable levels at all times in order to meet the oxygen demand for biota and production
species. While DO can be supplied through reaeration (diffusion, wind, etc.) and photosynthesis,
mechanical aeration is necessary in ponds with feeding rates above 30 to 40 kg/ha/day.
Photosynthesis is the largest oxygen producer in a pond (Hargraves and Tucker, 2003). Net DO
production fluctuates daily as a result of the balance of photosynthesis and respiration as well as
to the rate of organic matter decomposition and other oxidative processes. Photosynthesis
(Equation 1) consumes carbon dioxide and produces energy for the plankton and releases
oxygen. Thus, DO increases in sunlight, but at night, respiration, or the reverse reaction of
photosynthesis, occurs and oxygen is consumed. This causes lower DO concentrations during the
night. The lowest DO concentration usually is observed just before dawn and that is the most
critical time to add additional aeration, because DO levels often fall below acceptable levels at
this time. For warmwater fish, early morning DO should remain above 3-4 mg/L, and for
coldwater fish above 5-6 mg/L. Warmwater and coldwater fish can survive with concentrations
as low as 1.0-1.5 mg/L and 2.5-3.5 mg/L, respectively, but these concentrations will increase
stress, diminish appetite or aggressiveness to eat, and – if low enough for a long period of time –
they can be lethal (Boyd, 2015).
2
sunlight
6CO2 + 6H2O
C6H12O6 + 6O2
Equation 1. Chemical reaction of photosynthesis.
During feeding, DO decreases because of the increased metabolic rates of the fish feeding
in the area. Metabolic rate increases because fish are using more energy to competitively eat.
Uneaten feed and fecal matter also create a DO demand. This waste is a source of plant nutrients
that stimulate phytoplankton growth. At a greater abundance, phytoplankton can demand more
DO for respiration at night increasing DO demand. Phytoplankton also are continually dying and
decomposing to increase DO demand. The addition of fertilizer can stimulate algae growth that
can produce more oxygen and the increased algal growth removes potentially toxic ammonia.
Algicides can be used to thin phytoplankton blooms, but they are not recommended because of
the potential for a large die-off of algae and oxygen depletions following algicide application.
The balance of phytoplankton and bacterial abundance are very important factors in DO
dynamics in ponds (Boyd, 2015; Boyd and Tucker, 2014; Zhou and Boyd, 2015).
If DO levels drop below 3-4 mg/L, mechanical aeration should be provided. Mechanical
aeration supplements DO supply, and to raise low DO and maintain DO at satisfactory levels in
aquaculture systems. Several types of mechanical aerators are used in aquaculture: paddlewheels,
aspirators, fountains, etc. Mechanical aeration is one of the most important management
inventions in feed-based, pond aquaculture. Paddlewheel aerators dominate around the world as
the most effective mechanical aerator for earthen ponds (Hargreaves and Tucker 2003).
3
1.1.2 Organic Matter
Organic matter is present in ponds in the form of fish, phytoplankton, bacteria, plants,
and even feed. Living organic matter consumes oxygen in respiration, dead organic matter can
cause great oxygen depletion when decomposed by bacteria. Organic matter requires a specific
amount of oxygen, or a specific oxygen demand, when decomposed and used as energy. The rate
of organic matter decomposition is greatly affected by temperature and oxygen availability.
The oxygen demand is expressed as either biological oxygen demand (BOD) or chemical
oxygen demand (COD). The BOD is the amount of DO required by the respiration of
microorganism in a water sample held in the dark at 20°C for a specific time (commonly 5 days).
The COD refers to the oxygen equivalent of the dichromatic ion required to completely oxidize
the organic matter in a water sample. These are generally used as indicators for pollution,
because a greater BOD or COD is indicative of a greater oxygen demand in effluents.
The concentration of bottom soil organic matter increases drastically in catfish ponds
during the first 6-12 months after a new pond is put into production and then reaches equilibrium
after 3-5 years (Steeby, 2002). Organic matter can be decomposed by either aerobic or anaerobic
processes. If oxygen is unavailable, other agents such as nitrate, sulfate, carbon dioxide, etc. will
act as the terminal election acceptors in respiration.
1.1.3 Nitrification
Nitrogen (N) occurs in several forms in pond water: gaseous N (N2), nitrate (NO3--N),
nitrite (NO2--N), ammonia (NH3-N), ammonium (NH4+-N), and dissolved and particulate N. The
most critical forms in aquaculture are ammonia nitrogen and nitrite that are potentially toxic to
fish. Feed, uneaten or eaten, and fish feces will decompose releasing ammonia into the system.
4
Ammonia is either in one of two forms: ionized ammonium or unionized ammonia. The amount
of nitrogen present in each form is dependent on pH and temperature: the greater the pH and
temperature, the more ammonium ion that is present, which is the toxic form of ammonia. This
response is described by the following equation:
NH3 + H2O = NH4+ + OH-
Kb= 10-4.74
The methods for measuring ammonia nitrogen do not distinguish between ammonia and
ammonium. The forms must be fractionated based on the pH and temperature. Tables of the
percentage of un-ionized ammonia at different temperatures and pH values are available, and online ammonia calculators are helpful. Together, the ionized and unionized forms are called total
ammonia nitrogen (TAN). The TAN concentration can build up and, if enough of the un-ionized
form is present, can stress the fish; symptoms usually include lesions on the gills. However, few
cases of direct mortality result from ammonia in aquaculture ponds. More often, ammonia
stresses fish and opens the opportunity for other health issues (Boyd, 2015; Boyd and Tucker,
2014; Zhou and Boyd, 2015).
The LC50, or lethal concentration of 50% survival of an organism, for warmwater fish in
respect to NH3-N ranges from 0.3- 3.0 mg/L. First signs of toxicity will appear around 0.01-0.05
mg/L (Boyd 2015). The US EPA (2013) acute and chronic criterion for NH3-N is 0.067 mg/L
and 0.008 mg/L, respectively; however, there is no “safe” ammonia concentration established by
law – these are only recommended concentration limits to protect freshwater organisms.
According to Zhou and Boyd (2015), the no-observed-effect level (NOEL) for channel catfish is
estimated to be 1.0 mg/L NH3-N in ponds with pH of 7.5 or greater. Adequate aeration and
5
efficient feed management should be used to prevent excessively high TAN concentrations,
especially because the alternatives of immediate, emergency practices (i.e. algicides, exchange
water, adding an acid, etc.) are expensive and have negative environmental impacts.
Unfortunately, an ammonia standard for hybrid catfish still needs to be determined through
research.
Ammonia in aquaculture has been a growing concern because of the increased feeding
rates in intensive systems. In feed-based aquaculture, 60-80% of nitrogen contained in the
protein of feed enters the pond as uneaten feed and feces or is excreted by fish as ammonia
nitrogen. Intensification and high production increases the nitrogen input and leads to greater
TAN concentrations. With photosynthesis causing higher pH during the day, NH3-N levels
increase during the day (Boyd and Tucker, 2014). The concentration of TAN increases in late
fall and early winter despite the reduced feeding rates. This results from decomposition of
organic matter that has accumulated during the summer (Hargreaves and Tucker, 20003).
Total ammonia N can be removed through uptake by phytoplankton and by the
nitrification process. Ammonia N is used by Nitrosomas bacteria and converted into nitrite (NO2)
and nitrite is used by Nitrobacter bacteria and converted to nitrate (NO3). Nitrite is potentially
toxic, but fortunately nitrification usually continues to nitrate, which is not considered toxic.
Both genera of nitrifying bacteria are autotrophic and require aerobic conditions in order for
nitrogen oxidation to occur. However, nitrate will remain in the water until absorbed by plants,
denitrified, or lost in outflows. Denitrification, or nitrogen reduction, is conducted by
heterotrophic bacteria (many species) that under anoxic conditions convert nitrate into nitrogen
gas (N2). These heterotrophic take oxygen from NO3 as an alternative to molecular oxygen. In
6
the process, nitrogen gas is formed and released into the water. Nitrogen gas diffuse from water
into the atmosphere.
A rapid oxidation rate of ammonia nitrogen and nitrite minimizes their concentration in
ponds. Higher concentrations of ammonia nitrogen in the water will block ammonia that is in the
fish gills from diffusion into the water thus remaining in the fish’s blood – becoming toxic.
Toxic ammonia in the blood will adversely affect the fish’s health, diminish feeding rates,
increase feed conversion ratio (FCR), and thus even more feed will be wasted as a response.
Phytoplankton will compete with nitrifying bacteria for ammonia which could manipulate the
microbial community present leading to production of odorous compounds that when absorbed
render fish off-flavor (Hargreaves and Tucker, 2003).
Unfortunately, very quick nitrification of ammonia can lead to high concentrations of
nitrite in the water, which can lead to methemoglobinemina or brown blood disease in fish (a
condition causing brown blood, gills, and internal organs). Bowser et al. (1983) showed that in
the presence of high nitrite, DO of 5 mg/L is not sufficient for channel catfish. Increasing
aeration drives nitrification to the nitrate (not as toxic) form thus reducing nitrite. Also, by
elevating concentrations of chloride or bromide in the water, the uptake of nitrite by fish is
blocked (Kroupova et al., 2005).
1.2 Traditional Pond Design in Southeastern USA
Traditional ponds are either excavated, levees formed around the area in which to
impound water, or watershed catchments dammed to capture and hold water for fish production.
Catfish ponds may reach up to 16 ha in size (Hargraves and Tucker, 2003). These ponds
7
typically exhibit various levels of intensification as described above and can produce a variety of
production species.
In the southeastern USA, the most common species grown in ponds is the catfish. In the
past, channel catfish was the most common species, but, in recent years, farmers have decided to
produce hybrid catfish. Current estimation of hybrid catfish production is 30-40% of total catfish
production in the US (Li et al., 2014). Hybrid catfish are created when a channel catfish female
(Ictalurus punctatus) and a blue catfish male (Ictalurus furcatus) mate. These hybrids are more
disease resistant, grow faster and bigger, and are more tolerant to poor water quality conditions
than their channel catfish parents (Dunham and Masser, 2012; Green and Rawles, 2011).
Farmers have found that management practices are more effective in smaller ponds, and
thus the average size of ponds decreased from 8-16 ha in the 1940s-1990s to 2-6 ha today.
Traditional pond production typically ranges from 5,600-6,700 kg/ha (Heikes, 1996). Typically,
ponds are subject to semi-intensive, or intensive, management. These farms also use multiplebatch approach to stocking and harvesting. Thus, fish are being stocked every year and harvested
any time of the year when the farmer can get the best price and/or needs the money. Multiplebatch production also reduces the economic risks associated with off-flavor because another
pond can be chosen for harvest rather than the one with the presence of off-flavors. This
management style is also advantageous for reducing effluents. These ponds can be operated
continuously for many years without draining unlike many single-batch cropping systems
(Hargreaves and Tucker, 2003).
Off-flavors and blue-green algae communities may dominate because of the high degree
of eutrophication and high waste loading rates that are associated with intensification. Waste
treatment and assimilation capacity of aquaculture ponds is a limiting factor for intensification as
8
a result of deterioration in water quality from over feeding (Hargreaves and Tucker, 2003). Many
designs to improve production and increase the water quality limit on production. One method is
based on transfer of water from an intensive fish confinement area to less extensive culture pond
where water is treated by natural processes for reuse. The improved mixing practice increases
algal production and settling to stabilize algal populations. The advantages of a smaller
confinement area for fish reduce labor in the form of water quality management, animal and bird
predation, feeding, harvesting, and sorting. The major disadvantage to these systems is the
increased use of energy intensive pumping systems that are necessary to move high volumes of
water between the two ponds. In addition, algal production produces diurnal oxygen and
ammonia cycles that can lead to algal population crashes (Brune et al., 2003).The partitioned
aquaculture system, in-pond race way, and the split-pond are some of more popular systems
using this technique.
1.2.1 Split-Pond Design
Partitioned aquaculture system, or PAS, developed by David Brune at Clemson
University were modified and implemented by Craig Tucker at Mississippi State University into
what are now called split-ponds. Split-ponds are created by dividing a traditional pond into two
sections: fish section and waste-treatment section. The fish section, or cell, is approximately 20%
of the total area, while the waste cell is approximately 80%. This system is an intensification of
the traditional pond system in order to yield higher production, and up to five times the density
of traditional ponds. This system provides reduced labor for harvest, reduced cost in chemical
treatments, and lower feed conversion ratio (FCR). This new system is becoming popular within
9
the catfish industry in Mississippi and Arkansas, and it is now starting to develop in Alabama
(Tucker, 2009).
Traditional, semi-intensive ponds can yield 6,000 kg fish/ha, but intensification from a
split-pond system can produce yields of over 12,000 kg fish/ha (Tucker, 2009). The high
production requires a higher cost than what most farmers are used to; thus, farmers may try to
modify the design to create their own mixed practices and designs of a traditional pond and splitpond. These un-researched modifications may result in failure of production at higher stocking
densities.
Implemented commercially in 2009, split-ponds are a new system of ponds for which
little data exists on water quality of these systems. The present research will expand on this
knowledge by exploring water quality in a large commercial farm, in which some ponds have
aerators in the waste cell and others do not. The present research also has the potential to
determine if additional aeration results in increased ammonia oxidation, through nitrification,
leads to more production than with un-aerated waste cells. The present research will provide an
assessment of best management practices used to manage split-pond systems. For instance,
transferring research findings to the commercial industry has always been a challenge. The
present on-farm research will be able to depict a more accurate result or application of splitponds than does a highly, controlled approach. Farmers and researchers will be able to apply
these results for future research in split pond management and water quality.
10
References
Bowser, P.R., Falls, W.W., VanZand, J., Collier, N., Phillips, J.D. (1983).
Methaemoglobinaemia in channel catfish: Methods of prevention. Progressive FishCulturist, 45: 154-158.
Boyd, C. E. 2015. Water Quality, an Introduction, 2nd edition. Springer, New York, New York,
USA.
Boyd, C.E., Tucker, C.S. (2014). Handbook for aquaculture water quality. Craftmaster, Auburn.
Brune, D.E., Schwartz, G., Eversole, A.G., Collier, J.A. Schwedler, T.E. (2003). Intensification
of pond aquaculture and high rate photosynthetic systems. Aquacultural Engineering 28:
65-86.
Dunham, R., Masser, M. (2012). Production of hybrid catfish. SRAC Publication No. 190.
Green, B.W., Rawles, S.D., (2011). Comparative production of channel catfish and channel
catfish x blue hybrid catfish subjected to two minimum dissolved oxygen concentrations.
North American Journal of Aquaculture. 73 (3): 311-319.
Hargraves, J.A., Tucker, C.S. (2003). Defining load limits of static ponds for aquaculture.
Aquacultural Engineering. 28: 47-63.
Heikes. D. (1996). Catfish yield verification trials. Final Report. May 1993-December 1996.
Arkansas Cooperative Extension Program, University of Arkansas at Pine Bluff, Pine
Bluff, Arkansas.
Kroupova, H., Machova, J., Svobodova, Z. (2005). Nitrite influence on fish: A review.
Veterinarni Medicina, 50 (11): 461-471.
Li, M.H., Robinson, E.H., Bosworth, B.G., Torrans, E.L. (2014). Growth and feed conversion
ratio of pond-raised hybrid catfish harvested at different sizes. North American Journal
11
of Aquaculture, 76(3): 261-264.
Steeby, J.A., (2002). Sediment accumulation, organic carbon content, and oxygen demand in
commercial channel catfish (Ictalurus punctatus) ponds. Ph.D. Dissertation. Mississippi
State University, Mississippi State, MS.
Torrans, E.L., (2005). Effect of oxygen management on culture performance of channel catfish
in earthen ponds. North American Journal of Aquaculture. 67 (40): 275-288.
Tucker, C.S. (2009). Southern Regional Aquaculture Center: Twenty-Second Annual Progress
Report. Southern Regional Aquaculture Center, Stoneville, Mississippi, pp. 38776.
U.S. EPA. (2013). Final aquatic life ambient water quality criteria for ammonia – Freshwater
2013. EPA Doc No: 2013-20307. Vol. 78 (163): 52192-52194.
Xu, Z., Boyd, C.E. (2016). Reducing the monitoring parameters of fish pond water quality.
Aquaculture. 465: 359-366.
Zhou, L. Boyd, C.E. (2015). An assessment of total ammonia nitrogen concentration in Alabama
(USA) ictalurid catfish ponds and the possible risk of ammonia toxicity. Aquaculture.
437: 263-269.
12
Chapter 2 – Split-Pond Water Quality
2.1 Abstract
Split ponds have a fish cell and a waste cell accounting for approximately 20% and 80%
of total water surface area, respectively. Water passes from the fish cell to the waste cell for
water quality improvement and flows back to the fish cell. The present study was conducted on a
commercial catfish farm in west Alabama that has eight split-ponds, each with a fish-holding
section of about 8,000 m2. Two, 10-hp floating, electric paddlewheel aerators were placed in the
waste treatment section of each of four ponds; while four ponds – the controls – had un-aerated
waste treatment cells. Water samples were collected biweekly at the inflow and outflow of the
waste-treatment cells; once the water became cooler in the fall and winter, the samples were
collected monthly. Analyses were made for pH, dissolved oxygen (DO), temperature, secchi disk
visibility, Chlorophyll a, total ammonia nitrogen, nitrite-nitrogen, nitrate-nitrogen, total nitrogen,
total phosphorus, soluble reactive phosphorus, chemical oxygen demand (total and soluble),
biological oxygen demand, and acidification potential. Water circulation rates and aeration hours
were determined as well as sediment samples analyzed. The study period was too short in Year 1
(2014) to obtain meaningful results. In Year 2 (2015), differences between control and ponds
with aerated waste cells were found for Secchi disk visibility, total ammonia nitrogen, total
nitrogen, chemical oxygen demand (soluble and total) and DO. In Year 3 (2016), differences
13
were analyzed between control ponds and ponds with aerated waste cells for total ammonia
nitrogen, total phosphorus, and soluble chemical oxygen demand. Nevertheless, no differences
were found between treatments and control ponds for production, yield, and FCR. The effects of
fish mortality in several ponds probably had a great influence on production and FCR than did
aeration in the waste cells. Best management practices that could help the farmer minimize fish
mortality and improve production are discussed.
2.2 Introduction
Alabama and Mississippi are the two leading catfish-producing states; the production
area in Alabama was 30,000 acres while Mississippi had 78,000 acres in production in 2014.
Both states have experienced losses in catfish production since 2009 (USDA, 2016). These
losses can be attributed to the competition of imported catfish from Asia (Bosworth et al., 2015;
Hanson and Sites, 2013). Some farmers who have had troubles with maintaining profitable
production during the last decade converted their farms to agricultural land or dedicated the land
to other purposes.
In order to prevent more loss to the catfish industry, new, innovative production systems
such as the partitioned aquaculture system (PAS) and split-ponds have been promoted. Splitpond aquaculture is a version of the PAS that has similar characteristics such as confinement of
fish in a smaller area, controlling dissolved oxygen in a smaller portion of the water area, and
aggressively treating for diseases and cyanobacteria (Brune et al., 2004). Split-ponds can be
created using existing, traditional catfish ponds through renovation rather having to build new
production facilities thereby lessening the cost of adoption of a new production method. Splitponds are formed when a levee is added inside an existing pond to divide the pond into a 1:4
14
relationship: 20% water surface area designated to fish production and 80% designated to wastetreatment. The water should be able to move freely between these two cells, and screens must be
installed to isolate fish within the smaller cell (Tucker, 2009).
Many advantages come from using an intensive system such as the split-pond. Fish may
be stocked at a higher stocking density, fish are easier to feed and harvest, medicated treatments
can be isolated to only the fish cells thereby reducing cost, and greater yields may be achieved.
In 2009, a commercial-sized, split-pond with a stocking rate of 1,334 kg/ha produced a yield of
17,880 kg/ha at a feed conversion ratio (FCR) of 1.83. This commercial-sized, split-pond
consisted of a 0.4-ha fish cell and 1.42-ha waste-treatment cell. The 2009 study provided a
promising alternative production method for farmers struggling to make ends-meet (Tucker,
2009).
Farrelly et al. (2015) conducted a study comparing water quality conditions between
different pond production systems that including split-ponds and traditional ponds. Net
production for traditional ponds was 4,962 kg/ha and for split-ponds it was 13,390 kg/ha. Of
course, split-pond net production was slightly lower than the harvest weight reported in the study
above. This study found that the feeding rate was significantly greater in split-ponds than
traditional ponds (which is to be expected with intensification), but there also were greater
concentrations of total phosphorus, alkalinity, and hardness in the split-ponds. Both Farrelly et
al. (2015) and Tucker (2009) reported that total ammonia nitrogen (TAN) concentrations rarely
exceeded 2.0 mg/L.
Presently, there is limited information on commercial split pond systems and the need for
aeration within the waste treatment cell. Hence, the objective of this study was to determine if
15
additional paddle-wheel aerators in the waste-treatment cells of split ponds affected water quality
within split-ponds from June 2014-September 2016.
2.3 Materials and Methods
2.3.1 Design
This experiment was conducted from June 2014 through September 2016. A commercial
catfish farm in west-central Alabama was selected for the study because it had six, split-ponds
constructed with the intention of creating more in the near future. Ponds 3, 4, 5, 7, 8, and 9 were
already active as split-ponds in May 2014, pond 10 became operational in August 2014, and
pond 13 was operational in June 2015. All ponds had two or three 10-hp paddlewheel aerators
for maintaining DO in the fish cells. Ponds 4, 8, 9, and 10 (the treatment ponds) were designed to
include two additional 10-hp paddlewheel aerators at the inlet of the waste cells as indicated by
the red and white indicators (Figure 2.1). These ponds were operational by August 2014; the
other ponds were considered the control group. Ponds were randomly assigned to each group.
A custom-made, axial pump consisting of a propeller of 50-cm in diameter, shaft and
12.5 kW electric motor was placed between the fish and waste cells. The propeller was inserted
in the end of the 90-cm diameter corrugated pipe extending between the two cells of a split-pond.
Between the pipe and the screen, a dam was installed to maintain division and circulation
between the cells. Screens were placed at the corner with the propeller pump to protect fish from
the propeller and to prevent fish from moving into the waste cell. Water then returned without
additional pumping back into the fish cell through a 1.1 m x 6 m screen. There was no baffle in
16