Nitrate removal effectiveness of fluidized sulfur based autotrophic denitrification biofilters for recirculating aquaculture systems
Bạn đang xem bản rút gọn của tài liệu. Xem và tải ngay bản đầy đủ của tài liệu tại đây (1.34 MB, 9 trang )
Aquacultural Engineering 68 (2015) 10–18
Contents lists available at ScienceDirect
Aquacultural Engineering
journal homepage: www.elsevier.com/locate/aqua-online
Nitrate removal effectiveness of fluidized sulfur-based autotrophic
denitrification biofilters for recirculating aquaculture systems
Laura Christianson a,∗ , Christine Lepine a , Scott Tsukuda a , Keiko Saito b ,
Steven Summerfelt a
a
b
The Conservation Fund, Freshwater Institute, 1098 Turner Road, Shepherdstown, WV 25443, USA
University of Maryland Baltimore County and Institute of Marine and Environmental Technology, 701 East Pratt St., Baltimore, MD 21202, USA
a r t i c l e
i n f o
Article history:
Received 6 April 2015
Received in revised form 13 July 2015
Accepted 17 July 2015
Available online 21 July 2015
Keywords:
Denitrification
Autotrophic
Mixotrophic
Sulfur
Fluidized biofilter
Recirculating aquaculture
a b s t r a c t
There is a need to develop practical methods to reduce nitrate–nitrogen loads from recirculating aquaculture systems to facilitate increased food protein production simultaneously with attainment of water
quality goals. The most common wastewater denitrification treatment systems utilize methanol-fueled
heterotrophs, but sulfur-based autotrophic denitrification may allow a shift away from potentially expensive carbon sources. The objective of this work was to assess the nitrate-reduction potential of fluidized
sulfur-based biofilters for treatment of aquaculture wastewater. Three fluidized biofilters (height 3.9 m,
diameter 0.31 m; operational volume 0.206 m3 ) were filled with sulfur particles (0.30 mm effective particle size; static bed depth approximately 0.9 m) and operated in triplicate mode (Phase I: 37–39%
expansion; 3.2–3.3 min hydraulic retention time; 860–888 L/(m2 min) hydraulic loading rate) and independently to achieve a range of hydraulic retention times (Phase II: 42–13% expansion; 3.2–4.8 min
hydraulic retention time). During Phase I, despite only removing 1.57 ± 0.15 and 1.82 ± 0.32 mg NO3 –N/L
each pass through the biofilter, removal rates were the highest reported for sulfur-based denitrification
systems (0.71 ± 0.07 and 0.80 ± 0.15 g N removed/(L bioreactor-d)). Lower than expected sulfate production and alkalinity consumption indicated some of the nitrate removal was due to heterotrophic
denitrification, and thus denitrification was mixotrophic. Microbial analysis indicated the presence of
Thiobacillus denitrificans, a widely known autotrophic denitrifier, in addition to several heterotrophic denitrifiers. Phase II showed that longer retention times tended to result in more nitrate removal and sulfate
production, but increasing the retention time through flow rate manipulation may create fluidization
challenges for these sulfur particles.
© 2015 The Authors. Published by Elsevier B.V. This is an open access article under the CC BY license
( />
1. Introduction
The global demand for food protein must be balanced with
increased concern for the environmental impact caused by these
production systems. Land-based closed-containment aquaculture
using recirculating aquaculture systems (RAS) are uniquely poised
to produce highly desirable and valuable food products while also
maintaining a small environmental footprint. However, while most
RAS are designed to remove solids and recycle water back to the fish
culture tanks (Summerfelt and Vinci, 2008; Timmons and Ebeling,
2010), the inability of these systems to remove nitrate–nitrogen
from the water significantly arrests this industry’s ultimate economic and environmental sustainability. For these aquaculture
∗ Corresponding author. Tel.: +1 304 870 2241; fax: +1 304 870 2208.
E-mail address: (L. Christianson).
systems to more completely address environmental issues, it is now
critical that efforts focus upon the reduction of nitrogen species in
effluent waters. Importantly, the ability to confidently and consistently remove nitrate nitrogen from RAS effluent may allow
expansion of this industry into locales currently bound by stringent water quality standards and may potentially allow increased
reuse of treated effluents. There is a crucial need to develop practical and cost effective methods to reduce RAS nitrate–nitrogen loads
to allow their maintained or increased productivity simultaneously
with attainment of water quality goals and good environmental
stewardship.
The most common wastewater denitrification systems are based
on heterotrophic denitrification with the addition of methanol
(Payne, 1973). However, sulfur-based autotrophic denitrification,
where a reduced form of sulfur (e.g., thiosulfate, elemental sulfur) serves as the electron donor rather than organic carbon,
presents several unique benefits (Eq. (1)). Compared to heterotopic
/>0144-8609/© 2015 The Authors. Published by Elsevier B.V. This is an open access article under the CC BY license ( />
L. Christianson et al. / Aquacultural Engineering 68 (2015) 10–18
denitrification, an autotrophic process does not require any
additional potentially expensive carbon source, and produces
less bacterial sludge thus simplifying treatment (Batchelor and
Lawrence, 1978; Koenig and Liu, 1996; Zhang and Lampe, 1999).
Elemental sulfur is a promising substrate for autotrophic denitrification as it is generally inexpensive and non-toxic (Batchelor and
Lawrence, 1978; Sahinkaya and Kilic, 2014; Sahinkaya et al., 2014).
+
NO−
3 + 1.10S + 0.40CO2 + 0.76H2 O + 0.08NH4 → 0.08C5 H7 O2 N
+
+ 0.50N2 + 1.10SO2−
4 + 1.28H
(1)
A major disadvantage of this process is that autotrophs generally
grow at a slower rate than heterotrophs, thus have lower denitrification rates (Sahinkaya and Kilic, 2014). Major by-products of
concern from sulfur-based autotrophic denitrification are sulfate
and acidity (Sahinkaya and Kilic, 2014) with 4.57 mg CaCO3 alkalinity consumed and 7.54 mg sulfate produced for each mg NO3 –N
reduced (Sahinkaya et al., 2014). Many sulfur-based denitrification
studies use a mix of sulfur and limestone or dolomite to buffer pH
and alkalinity decreases (Sahinkaya and Kilic, 2014; USEPA, 1978).
The presence of sulfur in the system combined with low-oxygen
conditions could also lead to sulfide production, though not as a
result of Eq. (1). An additional challenge is that elemental sulfur
is relatively water insoluble, meaning it has a limited microbial
availability at room temperature. Batchelor and Lawrence (1978)
outlined that for elemental sulfur-based denitrification to proceed,
three steps were necessary: (1) the sulfur must be solubilized, and
(2) nitrate must be transported from solution to the biofilm surface, where (3) it can be transported through the film so it can be
denitrified.
Sulfur-based autotrophic denitrification in static beds has
proven successful for treating nitrate in groundwater, landfill
leachate, and wastewaters (Koenig and Liu, 1996; Lee et al., 2008;
Shao et al., 2010), and this approach presents a unique option for
treatment of aquaculture effluents (Sher et al., 2008). Nitrogen
removal rates from previous laboratory studies are generally on the
order of 0.1–0.4 g N/(L d) (Lampe and Zhang, 1996; Sahinkaya and
Kilic, 2014; Sahinkaya et al., 2014). Nitrogen (N) removal performance may be limited by N loading with Kim et al. (2004) observing
a decline in N removal beyond loading rates of 2.5 kg NO3 –N/(m3 d), and Koenig and Liu (1996) noting that areal based loading rates
(g N/m2 -d) were their limiting factor in a packed sulfur bed. In
an aquaculture application, Sher et al. (2008) reported the use of
autotrophic denitrification provided a dual benefit for recirculated
waters; not only were nitrate levels brought under control, but
the oxidation of sulfide in the anaerobically digested sludge helped
safeguard against sulfide toxicity within the system.
Fluidized bed reactors are a proven aquaculture water treatment
technology due to their plugging prevention, ease of maintenance,
low cost and efficient treatment (Summerfelt, 2006). Because fluidized sand biofilters are common in this industry, their application
as fluidized sulfur autotrophic denitrification reactors could be a
natural extension of the technology. Fluidized sulfur biofilters have
been researched at the lab scale, with Kim et al. (2004) showing
higher N removal rates from fluidized sulfur beds than packed sulfur beds. This was due to the absence of clogging and good nitrate
transfer to the sulfur surface in the fluidized system. In previous
work, Christianson and Summerfelt (2014) determined fluidization
velocities of commercially-available sulfur flakes, grains, and powder, and concluded the grains provided the most realistic option for
full-scale testing of a fluidized sulfur-based denitrification biofilter.
The objective of this work was to assess the nitrate reduction potential of fluidized sulfur-based biofilters for treatment of aquaculture
wastewater.
11
2. Methods and materials
2.1. Fluidized sulfur biofilter experimental set-up
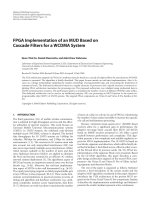
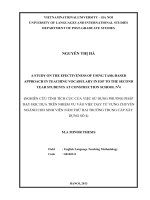
Three fluidized sulfur biofilters (285 L, height 3.9 m, diameter
0.31 m; Fig. 1) were operated at The Conservation Fund’s Freshwater Institute (Shepherdstown, West Virginia, USA) for 253 days
to quantify nitrate removal from aquaculture wastewater (Phase
I: 225 days, 13 March 2014 to 23 October 2014; Phase II: 28
days, 24 October 2014 to 20 November 2014). During Phase I,
the three biofilters were operated in triplicate fashion, each fluidized at 37–39% expansion with a hydraulic retention time (HRT)
of 3.2–3.3 min and a hydraulic loading rate of 860–888 L/(m2 min)
based on the mean flow rate of 63–65 L/min. Two Phase I study
periods of relatively consistent influent nitrate concentrations
were selected for analysis; Periods 1 and 2 allowed evaluation at
influent concentrations of 2.0–5.0 and 7.6–17 mg NO3 –N/L, respectively (days 57–92 and 190–225, respectively; six sample events
each). Phase II utilized a different flow rate in each biofilter to
assess the impact of HRT on nitrate removal (i.e., no replication; 42–13% expansion; 3.2–4.8 min HRT; 67–43 L/min flow rate;
influent 8.5–15 mg NO3 –N/L).
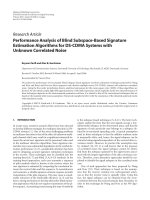
The waste and wastewater treatment system and biofilter
design has been previously described by Tsukuda et al. (2015)
(Fig. 2). In short, waste sludge from the production of rainbow
trout (Oncorhynchus mykiss) and Atlantic salmon (Salmo salar), was
concentrated via microscreen drum filters and radial flow settlers
and was pumped to a series of gravity thickening settling cones. A
holding tank for the supernatant overflow from the settling cones
fed the three fluidized denitrification biofilters. Overflow from each
biofilter was treated using a radial flow settler. Biofilter bed height
Fig. 1. Fluidized biofilter column dimensions (From Tsukuda et al., 2015).
12
L. Christianson et al. / Aquacultural Engineering 68 (2015) 10–18
reactive phosphorus (DRP) using methods from APHA (2005) and
Hach Company (2003). Temperature, dissolved oxygen (DO), and
oxidation reduction potential (ORP) were assessed at least twice
weekly. Measurements were made directly from the supernatant
tank (influent) and the open biofilter tops (effluent) utilizing both
inline and handheld probes (HACH HQ40d Portable meter with
either HACH IntelliCAL LDO101 or MTC101 ORP/redox probe;
HACH pHD sc Differential ORP sensor with HACH sc100 controller;
HACH Advanced LDO Process Dissolved Oxygen Probe with HACH
sc200 controller). Flow rate was measured along the influent pipes
to each biofilter and adjusted at least twice weekly concurrently
with temperature, DO, and ORP readings, as well as prior to the
weekly water chemistry sampling event (Dynasonics DXN Portable
Ultrasonic Measurement System).
Nitrate–N, sulfide, and alkalinity removal rates were based
upon:
Fig. 2. Process flow diagram for units involved with biofilter denitrification research
(Modified from Tsukuda et al., 2015); triplicate replication of settling cones, biofilters, and radial flow settlers not shown. Settling cones and radial flow settlers
drained every four weeks and bi-weekly, respectively, to prevent sludge accumulation (off-site sludge disposal).
(2.82 m; biofilter volume 0.206 m3 ) was controlled with a shearing pump at the top of each biofilter. The static sulfur bed depth
was approximately 0.9 m, although the sulfur grains in all three
biofilters were replenished on days 181 and 198 following an undetected wash-out (68 kg or approximately 0.75 m S per biofilter total
replenished). Biofilter influent nitrate levels were manipulated by
dosing a concentrated sodium nitrate (NaNO3 ; 34.0 g NO3 –N/L)
solution into the supernatant holding tank. The spring water feeding the RAS was naturally alkaline (≈275 mg CaCO3 /L), resulting in
high alkalinity of flows.
The sulfur grains had effective and calculating sizes of 0.30
(D10 ) and 1.31 mm (D90 ), respectively, and a uniformity coefficient of 3.1 (Georgia Gulf Sulfur, Customer Code 1660, distributed
by Prince Agri-Products, Inc., Quincy, Illinois, USA; Christianson
and Summerfelt, 2014). This is smaller than reported particle size
ranges for other sulfur-based denitrification studies as most have
used grains ranging from 2 to 16 mm (Koenig and Liu, 1996; Oh
et al., 2003; Sahinkaya et al., 2014). Sahinkaya and Kilic (2014)
reported using the most comparable size (0.5–1.0 mm grains) in a
packed column study, and in the only reported fluidized bed study,
Kim et al. (2004) used 2.0–3.35 mm sulfur grains. The smaller grain
size used here provided a desirable high specific surface area (SSA
bed: 4110 m2 /m3 ) relative to, for example, a 4.4 mm mean particle size sulfur product that had a 1363 m2 /m3 SSA (Koenig and Liu,
1996). Elemental sulfur powder was initially used in the fluidized
biofilters, but was discontinued due to fluidization and wash-out
challenges. Lampe and Zhang (1996) similarly reported difficultly
with powdered sulfur in a batch reactor (i.e., uniform mixing was
problematic).
2.2. Water quality parameters and analysis
Water quality samples were collected from a sampling valve
located at the back of each of the three biofilters and directly
from the influent supernatant tank (i.e., effluent sample values
were pooled as replicates during Phase I, n = 3; influent samples,
n = 1). Water chemistry was analyzed weekly onsite, and both
study phases followed the same sampling routine. Samples were
analyzed for chemical oxygen demand (COD), carbonaceous
biochemical oxygen demand (cBOD5 ), total ammonia nitrogen
(TAN), nitrite–nitrogen (NO2 –N), nitrate–nitrogen (NO3 –N), total
nitrogen (TN), alkalinity, pH, sulfate (SO4 2− ), sulfide (S2− ), total
suspended solids (TSS), total phosphorus (TP), and dissolved
Removal rate
=
(influent concentration − effluent concentration) × flow rate
total expanded biofilter volume of 206 L
(2)
with sulfate production rates calculated similarly except the
influent concentration was subtracted from the effluent. Statistical
analysis consisted of t-testing to ascertain significant differences
between influent and effluent parameter concentrations during
both study periods, or in the case of non-normally distributed data
as most of the concentration data turned out to be, Mann–Whitney
Rank Sum tests were used (˛ = 0.05; Sigma Plot 12.5). Nitrate–N
removal efficiency was calculated as:
Removal efficiency
=
(influent concentration − effluent concentration)
× 100%
influent concentration
(3)
2.3. Collection and extraction of DNA
Samples for screening the potential denitrification community
were collected from all three biofilters on the final day of Phase
I Period 2 (day 225). Biofilm attached to the sulfur media were
detached by vigorously vortexing a sample of sulfur media/biofilter
water in 50 mL sterile plastic conical tubes for 5 min. The resulting
suspensions of detached surface layer (SL) biofilms were centrifuged at 10,000 × g at 4 ◦ C for 20 min prior to DNA extraction.
Following SL biofilm detachment, the media were directly used
for DNA extraction of inner layer (IL) biofilm. The genomic DNA
were extracted from each reactor’s SL and IL biofilm using a PowerSoil DNA Extraction Kit (MO BIO Laboratories, Inc., Carlsbad, CA)
following the manufacturer’s protocol. The concentration and quality of extracted DNA were determined by absorbance at 260 nm
and 260/280 nm ratio, respectively (NanoDrop 2000c UV-Vis spectrophotometer; Thermo Fisher Scientific, Inc., Wilmington, DE).
Isolated DNA was stored at −20 ◦ C.
2.3.1. PCR amplification
Microbial community DNA extracted from three biofilters were
pooled in equal quantity and used to amplify nosZ fragments
which encode the catalytic subunit Z of nitrous oxide reductase. Primers nosZ-F (5 -CGYTGTTCMTCGACAGCCAG-3 ) and nosZ-R
(5 -CATGTGCAGNGCRTGGCAGAA-3 ) yielding approx. 700 bp fragments (Rösch et al., 2002) were used. PCR reaction mixtures were
prepared to contain 2× Taq PCR Master Mix (QIAGEN, Gaithersburg,
MD), 6 pmol of each forward and reverse primers, and 100 ng of
genomic DNA in a final volume of 20 L. The PCR amplification was
L. Christianson et al. / Aquacultural Engineering 68 (2015) 10–18
13
carried out as following: initial denaturation step at 94 ◦ C for 4 min;
one cycle at 94 ◦ C for 20 s (denaturation), at 65 ◦ C for 30 s (annealing), and at 72 ◦ C for 40 s (elongation); two cycles at 94 ◦ C for 20 s
(denaturation); at 62 ◦ C for 30 s (annealing); 72 ◦ C for 40 s (elongation); three cycles at 94 ◦ C for 20 s (denaturation); at 59 ◦ C for 30 s
(annealing); at 72 ◦ C for 40 s (elongation); five cycles at 94 ◦ C for 20 s
(denaturation); at 57 ◦ C for 30 s (annealing); at 72 ◦ C for 40 s (elongation); twenty four cycles at 94 ◦ C for 20 s (denaturation); at 55 ◦ C
for 30 s (annealing); at 72 ◦ C for 40 s (elongation); and then, final
extension at 72 ◦ C for 10 min in a PTC-200 Peltier Thermal Cycler
(MJ Research, Watertown, MA). A negative control prepared without DNA was included in every PCR reaction performed to test for
false positives caused by contamination. PCR products were separated and visualized by electrophoresis in 1.2% agarose gel stained
with EtBr, and were purified from excised gel slices (about 700 bp
size band) using the QIAquick Gel Extraction Kit (QIAGEN, Valencia,
CA).
2.3.2. Cloning and sequencing
Purified SL and IL nosZ amplicons were ligated into pCR4 TOPO
vector, and vector with insert were transformed into OneShot
TOP10 chemically competent Escherichia coli cells using TOPO TA
Cloning Kit following the manufacturer’s instructions (Invitrogen
Life Technologies, Carlsbad, CA). Ninety-six total clones were randomly selected from each SL and IL nosZ library and were cultured
for plasmid preparation. Plasmid DNAs were purified (Agencourt
SprintPrep 384 HC Kit, Agencourt Bioscience, Beverly, MA) and
sequencing was performed using an ABI PRISM genetic analyzer
(Applied Biosystems, Foster City, CA) with T7 and T3 primers provided in the cloning kit (Invitrogen) at the Biological Analysis
Service Laboratory, Institute of Marine and Environmental Technology (Baltimore, MD). Sequences were edited and assembled using
Sequencher software (Gene Code Corp., Ann Arbor, MI, USA), were
analyzed using the Basic Local Alignment Search Tool (BLASTn;
and were compared with
available sequences in the GenBank database to create neighbor
joining phylogenetic trees to aid the selection of the closest reference sequences.
2.3.3. Nucleotide sequence accession numbers
The 41 partial nosZ sequences that were generated in this study
have been deposited in GenBank database under accession numbers KT252910 to KT252950.
3. Results and discussion
3.1. Phase I: High and low nitrate loading at a consistent HRT
Nitrate reduction was observed during both Phase I periods
(Fig. 3a). Although differences between influent and effluent nitrate
concentrations were relatively small (Table 1; 1.57 ± 0.15 and
1.82 ± 0.32 mg NO3 –N/L for the two periods, respectively), the high
flow rates and compact biofilter volume resulted in mean removal
rates of 0.71 ± 0.07 and 0.80 ± 0.15 g N removed/(L bioreactord) for the two periods, respectively. This is much higher than
the previously reported range of 0.1 to 0.4 g N/(L d) for sulfurbased denitrification (Lampe and Zhang, 1996; Sahinkaya and Kilic,
2014; Sahinkaya et al., 2014), but similar to the low end of the
range for fluidized sand biofilter heterotrophic N removal rates of
0.86–1.74 g N/(L d) (or 35.8–72.6 mg NO3 –N/(L h); reviewed by van
Rijn et al., 2006). Relative to previous experiments with these biofilters, Tsukuda et al. (2015) reported removal rates of 0.4 g N/(L d)
when they were operated with fluidized sand. Christianson and
Summerfelt (2014) reported sand was much less expensive than
sulfur products for fluidized biofilters on both a volumetric and
surface area basis ($70–$200/m3 vs. >$1000/m3 , respectively;
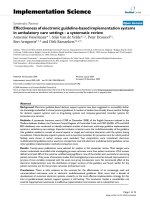
Fig. 3. Influent and effluent NO3 –N (a), sulfate (b), and sulfide (c) concentrations
during fluidized sulfur denitrification biofilter operation during Phase I (effluent
n = 3; mean ± standard error).
$0.02/m2 surface area vs. ≈$0.30/m2 surface area, respectively),
though a fluidized sand biofilter would also require purchase of a
carbon source to fuel denitrification. Influent loading averaged 1.46
and 5.82 g N/(L d) for Periods 1 and 2, respectively. Nitrate removal
efficiencies averaged 50 ± 4.6% and 16 ± 3.2% for the two Phase I
study periods, with the relatively high efficiency for Period 1 due
to the low influent nitrate concentration.
Theoretically, the production of sulfate is proportional to the
extent of autotrophic denitrification, thus sulfate production may
be the best indicator of this process (Oh et al., 2003; Sahinkaya et al.,
2014). Based on Eq. (1) and average removals of 1.57 and 1.82 mg
NO3 –N/L, Periods 1 and 2 should have produced an average of
11.8 and 13.7 mg SO4 2− /L. However, only 2.7 ± 2.0 and 6.1 ± 1.6 mg
SO4 2− /L were produced during these two periods, with no statistically significant difference between influent and effluent sulfate
concentrations for either Periods 1 or 2 (Table 1; Fig. 3b). This is
an indication that some of the N removal was potentially due to
heterotrophic denitrification in addition to autotrophic. Just as the
elemental sulfur was converted to sulfate, some sulfide present
in solution was also oxidized (Fig. 3c; Table 1; mean removal:
6.19 ± 1.82 and 8.64 ± 1.04 g S2− /L). Sher et al. (2008) observed
that a RAS sludge digestion basin also provided autotrophic denitrification treatment with sulfide as the electron donor. Dual
functionality of nitrate and sulfide removal would be a more significant benefit for RAS waters being recirculated to fish culture tanks
as compared to the treatment of effluent waters here.
Reduced alkalinity, another indicator of autotrophic denitrification, was observed here with average decreases of 16 and 12 mg
CaCO3 /L from the two Phase I study periods (Table 2). Others
have reported significant drops in alkalinity during sulfur-based
denitrification studies (Koenig and Liu, 1996), and this may be
14
L. Christianson et al. / Aquacultural Engineering 68 (2015) 10–18
Table 1
Mean ± standard error influent and effluent parameter concentrations during two study periods of Phase I operation of a fluidized sulfur denitrification biofilter experiment
where columns were run in triplicate; influent n = 6, effluent n = 18 with the exception of Period 2 cBOD5 where influent n = 5, effluent n = 15; concentrations in mg/L except
sulfide in g S2− /L.
Analytesa
Study Period 1 (days 57–92)
Influent
b
Nitrate–N
Nitrite–Nc
TANc
TNc
Sulfatec
Sulfidec
CODc
cBOD5 c
TPc
DRPc
3.21
0.16
2.71
15.43
133
75
227
73
5.1
2.32
±
±
±
±
±
±
±
±
±
±
Study Period 2 (days 190–225)
Effluent
0.48
0.05
0.54
1.66
34
6.1
29
11
0.6
0.31
1.64
0.10
2.78
13.40
136
69
218
73
4.8
2.30
±
±
±
±
±
±
±
±
±
±
0.21
0.02
0.30
1.21
20
2.7
20
8.3
0.4
0.17
p Value
Influent
0.002
0.271
0.790
0.390
0.894
0.053
0.571
0.714
0.505
0.969
13.29
0.26
1.36
17.85
73
50
90
43
3.4
1.69
±
±
±
±
±
±
±
±
±
±
Effluent
1.36
0.10
0.26
2.20
18
6.6
9.0
5.1
0.2
0.23
11.47
0.20
1.26
16.26
79
41
87
44
2.7
1.62
±
±
±
±
±
±
±
±
±
±
p Value
0.95
0.06
0.15
1.21
11
2.9
4.7
3.8
0.2
0.12
0.332
0.194
0.526
0.424
0.641
0.194
0.894
0.835
0.068
0.404
a
Abbreviations: Total ammonia nitrogen (TAN); total nitrogen (TN); chemical oxygen demand (COD); carbonaceous biochemical oxygen demand (cBOD5 ); total phosphorus
(TP); dissolved reactive phosphorus (DRP).
b
A statistically significant difference between influent and effluent concentrations existed for Period 1, but not Period 2 (t-test).
c
No statistically significant difference between influent and effluent concentration for either Periods 1 or 2 (Mann–Whitney Rank Sum tests; ˛ = 0.05).
Table 2
Mean ± standard error flow rates and influent and effluent alkalinity, pH, dissolved oxygen, oxidation reduction potential, and water temperature during two study periods
of Phase I operation of a fluidized sulfur denitrification biofilter experiment; study Period 1: influent n = 14, effluent n = 42; study Period 2: influent n = 10, effluent n = 30.
Study Period 1 (days 57–92)
Flow rate (L/min)
Alkalinity (mg CaCO3 /L)a
pH
DO (mg/L)
ORP (mV)
Temperature (◦ C)
a
Study Period 2 (days 190–225)
Influent
Effluent
Influent
Effluent
–
268 ± 18
7.35 ± 0.05
4.15 ± 0.43
−103 ± 38
17.8 ± 0.4
65 ± 0.7
252 ± 6.7
7.33 ± 0.03
0.12 ± 0.01
−143 ± 8.3
17.7 ± 0.2
–
292 ± 20
7.37 ± 0.09
1.07 ± 0.41
−185 ± 46
17.0 ± 0.2
63 ± 1.1
279 ± 10
7.39 ± 0.05
0.38 ± 0.07
−75 ± 8.4
16.9 ± 0.1
No statistically significant difference between influent and effluent concentration for either Periods 1 or 2 (Mann–Whitney Rank Sum tests; ˛ = 0.05).
the largest operational challenge of such a system (Kim and Bae,
2000). The naturally alkaline spring water used in the on-site RAS
here was considered well-buffered enough to not require alkalinity
addition as Furumai et al. (1996) reported the optimum alkalinity for sulfur-based autotrophic denitrification was 150–240 mg/L.
Based on Eq. (1), removal of 1.57 and 1.82 mg NO3 –N/L should
have resulted in alkalinity consumption of only 7.2 and 8.3 mg
CaCO3 /L for Periods 1 and 2, respectively. Likewise, based on
N removal rate (0.71 and 0.80 g N/(L d)), alkalinity consumption
should have been 3.2 and 3.7 g CaCO3 /(L d) although it averaged
7.1 ± 2.7 and 5.3 ± 2.3 g CaCO3 /(L d) for the two periods. The simultaneous occurrence of heterotrophic denitrification would have
reduced alkalinity consumption rather than increased consumption, and while nitrification can consume alkalinity, there was
no consistent change in TAN concentrations across the biofilters.
Degradation of possible accumulated sludge within the biofilter
may have consumed some alkalinity, although this could not be verified. The variability in alkalinity standard error complicated further
analysis.
No major pH changes were observed with the influent and
effluent both averaging between 7.33 and 7.39 for both periods
(Table 2). Others have observed notable pH decreases (Koenig
and Liu, 1996; Sahinkaya and Kilic, 2014) with nitrite accumulation possible at pH below 7.4 (Furumai et al., 1996). There was
no accumulation of nitrite here as levels were generally slightly
reduced over the biofilters (Table 1; Fig. 4). Water temperature
between the influent and effluent did not notably vary, although
a seasonal trend was observed. Temperatures peaked between
days 100–150 (20 June 2014–09 August 2014) during the warmest
time for these greenhouse-run experiments (Fig. 5a). As expected,
effluent DO concentrations were reduced to less than 1.0 mg DO/L
when the columns were operating as intended (Fig. 5b), and to
less than 0.5 mg DO/L during both analysis periods (Table 2). This
indicated a strong aerobic and/or facultative anaerobic component
existed within the biofilters. Facultative heterotrophic denitrifiers
use free oxygen as their electron acceptor while it is available,
because oxygen is a more energetically favorable electron acceptor than nitrate. Thus, heterotrophic denitrification and the use of
nitrate as an electron acceptor is reduced when free oxygen is still
present. Autotrophic denitrification has been documented under
both aerobic and anaerobic conditions (Zhang and Lampe, 1999).
The potential impact of the sulfur wash-out was evident as early
as day 150 when effluent DO levels increased; additional sulfur
was added on days 181 and 198. Oxidation reduction potentials
Fig. 4. Influent and effluent nitrogen species concentrations during fluidized sulfur
denitrification biofilter Phase I operation (effluent n = 3; mean ± standard error).
L. Christianson et al. / Aquacultural Engineering 68 (2015) 10–18
15
two periods, respectively. The very low utilization ratio for Period
2 potentially indicated relatively more of the N removal was due to
autotrophic vs. heterotrophic denitrification compared to Period 1.
The absence of measureable cBOD5 reductions was likely due to the
extremely short HRTs. While it is likely that heterotrophic denitrification did account for some of the nitrate removal, internal cycling
of solids may have complicated the COD balances.
3.2. Phase I: Microbiological characterization
Fig. 5. Influent and effluent temperature (a), dissolved oxygen (b), and oxidation
reduction potential (c) during fluidized sulfur denitrification biofilter operation from
Phase I (effluent n = 3; mean ± standard error).
were highly variable though always negative, and were reduced
slightly across the biofilter during Period 1 but increased during
Period 2 (Table 2; Fig. 5c). This increase in ORP across the biofilters
was mainly apparent because the influent ORP was more reduced
during this period; influent water quality throughout the experiment was variable and somewhat uncontrollable due to the nature
of this production aquaculture facility’s waste stream.
The term “mixotrophic denitrification” refers to the simultaneous occurrence of heterotrophic and autotrophic denitrification
(Oh et al., 2003; Sahinkaya and Kilic, 2014). With this relatively
high COD and cBOD5 wastewater, it is likely mixotrophic denitrification was occurring. Oh et al. (2003) observed addition of
a variety of soluble organic sources (methanol, ethanol, acetate)
did not inhibit autotrophic denitrification, although supplementation of organic carbon in excess did decrease sulfate production.
Balancing the autotrophic/heterotrophic reactions can reduce the
alkalinity requirement caused by autotrophic denitrification due
to alkalinity produced by heterotrophs (Kim and Bae, 2000; Lee
et al., 2001; Oh et al., 2003). Because heterotrophs grow faster than
autotrophs, some organic carbon forms may be preferentially utilized before sulfur in a mixotrophic denitrification reactor (Sun and
Nemati, 2012). Availability of the electron donor may play a role in
this as limited dissolution of solid sulfur particles can limit denitrification, especially at higher N loading rates (Kim et al., 2004).
Suitable COD:NO3 –N ratios for heterotrophic denitrification are on
the order of 3:1 to 6:1(van Rijn et al., 2006), and influent values
here averaged 74 ± 7.5 and 7.2 ± 1.3 COD:NO3 –N for Periods 1 and
2, respectively, more than sufficient to fuel heterotrophic denitrification (cBOD5 :NO3 –N of 24 ± 4.9 and 3.3 ± 0.5). However, during
Periods 1 and 2, COD was only reduced 8.5 ± 19 and 2.4 ± 3.0 mg
COD/L, respectively, and cBOD5 concentrations were not reduced
across the biofilters (Table 1). The COD:NO3 –N utilization ratios
were 5.4 and 1.3 mg COD consumed per mg N removed for the
Sequence analysis of 96 randomly selected clones from each
the biofilm surface layer (SL) and inner layer (IL) nosZ libraries
revealed fourteen unique operational taxonomic units (OTUs) for
SL and nine for IL (Table 3). The % Clone of similar sequences
in a library were calculated for SL-nosZ and IL-nosZ, separately
(Table 3, upper for SL-nosZ and lower for IL-nosZ). The nosZ library
clones in the SL belonged to: Alphaproteobacteria (19.6%), Betaproteobacteria (76.5%), and unclassified bacterium (4.3%); and in the IL
belonged to: Alphaproteobacteria (2.2%), Betaproteobacteria (17.5%),
and unclassified bacterium (80.4%). Similarly to previous fluidized
sand biofilter denitrification studies (Tsukuda et al., 2015), the denitrifying microbial population containing the nosZ gene in the SL
was more diverse than in the IL. Here, more than 80% of IL-nosZ
clones were closely related to the uncultured bacterium clone 2–80
(Accession JF509076.1). This lack of diversity may have been the
result of lower DO and higher sulfur availability (electron donor)
in the IL. Uncultured bacterium clone 2–80 were also found in the
SL biofilm, but their much higher % clone in the IL (4.3 vs. 80.4%
in SL vs. IL, respectively) may be an indication there are sulfurutilizing autotrophic denitrifiers that have not yet been isolated or
identified.
The microbial communities indicated that the encoding key
enzyme for denitrification (nosZ) in the SL was largely from Azoarcus, Thauera and Paracoccus spp., which are known as heterotrophic
denitrifiers, and their presence suggests the geochemical conditions near the SL were suitable for heterotrophic denitrification
compared to conditions in the IL. In contrast, nosZ sequences
belonging to Thiobacillus denitrificans, an obligate chemolithoautotrophic denitrifier, were dominant in the IL denitrifying microbial
community suggesting IL provided a suitable cultivating environment for autotrophs, although this was only 4.3% of the IL-nosZ
clones (80.4% were uncultured bacterium clone 2–80). The optimal growth temperature of T. denitrificans is between 28 and 32 ◦ C
(Shao et al., 2010), and lower water temperatures here (13–22 ◦ C;
Fig. 5a) may have influenced this relatively low percentage. Among
known autotrophic denitrifiers, the obligate chemolithoautotroph,
T. denitrificans, was the first to be isolated and characterized, is
capable of utilizing thiosulfate, tetrathionate, thiocyanate, sulfide
and elemental sulfur as the electron donor for denitrification, and
is the most commonly reported autotrophic denitrifier (Park et al.,
2010, 2011; Chen et al., 2013; Xu et al., 2014). The detection of
nosZ genes from autotrophic denitrifiers in both SL and IL biofilms
strongly indicated the capability of fluidized sulfur biofilters to cultivate and enrich autotrophic denitrifying bacteria for removal of
nitrate, even under relatively short HRTs compared to packed sulfur reactor studies. In addition, the co-existence of autotrophic and
heterotrophic denitrifiers suggests these reactors provided conditions to cultivate both types of bacteria which can offer unique and
efficient mixotrophic nitrate removal (Oh et al., 2001).
3.3. Phase II: Hydraulic retention time impact on autotrophic
denitrification
When each biofilter was operated independently, N removal
and sulfate production showed a weakly increasing trend at
increasing HRTs (Fig. 6a and b). Based on the regression slope
16
L. Christianson et al. / Aquacultural Engineering 68 (2015) 10–18
Table 3
Nearest neighbor of the nitrous-oxide reductase (nosZ) gene clones in the surface layer (SL, upper part of table) and inner layer (IL, bottom part of table) of the biofilm.
Phylogenetic group
Accession no. of
nearest neighbor
Nearest neighbora
Similarity (%)
% Clone in a library
Beta-proteobacteria
Beta-proteobacteria
Beta-proteobacteria
Beta-proteobacteria
Alpha-proteobacteria
Beta-proteobacteria
Alpha-proteobacteria
Alpha-proteobacteria
Beta-proteobacteria
Alpha-proteobacteria
Alpha-proteobacteria
Alpha-proteobacteria
Beta-proteobacteria
Unclassified bacteria
Beta-proteobacteria
Beta-proteobacteria
Alpha-proteobacteria
Beta-proteobacteria
Beta-proteobacteria
Beta-proteobacteria
Beta-proteobacteria
Beta-proteobacteria
Unclassified bacteria
AP012304.1
CR555306.1
CP001281.2
AM406670.1
AY345244.1
CP000267.1
AM422885.1
KM594554.1
CP001645.1
CP006880.1
CP001313.1
EU346731.1
CP000116.1
JF509076.1
CP000116.1
AP012304.1
GU136479.1
AB545666.1
AB545673.1
CP000267.1
GQ900543.1
CP001281.2
JF509076.1
Azoarcus sp. KH32C
Azoarcus aromaticum EbN1
Thauera sp. MZ1T
Azoarcus sp. BH72
Paracoccus denitrificans strain DN23
Rhodoferax ferrireducens T118
Rhizobiales bacterium D5-25
Paracoccus sp. SY
Ralstonia pickettii 12D
Rhizobium gallicum bv. gallicum R602
Rhodobacter capsulatus SB 1003
Shinella zoogloeoides strain BC026
Thiobacillus denitrificans ATCC 25259
Uncultured bacterium clone 2-80
Thiobacillus denitrificans ATCC 25259
Azoarcus sp. KH32C
Uncultured Azospirillum sp.
Herbaspirillum sp. TSO26-2
Herbaspirillum sp. TSO47-2
Rhodoferax ferrireducens T118
Rubrivivax gelatinosus strain S1
Thauera sp. MZ1T
Uncultured bacterium clone 2-80
81
81
84
78
81
85
81
81
88
88
84
86
84
89
84
85
74
75
83
84
78
85
88
26.1
21.7
13.4
6.6
6.5
4.3
4.3
2.2
2.2
2.2
2.2
2.2
2.2
4.3
4.3
2.2
2.2
2.2
2.2
2.2
2.2
2.2
80.4
a
The closest matching sequence was identified using Blastn at the NCBI and selected by neighbor joining phylogenetic analysis from Blastn hits.
(−0.0405 g N/(L d) per L/min of flow rate), decreasing the flow
rate approximately 20 L/min would provide an additional 0.81 g N
removed/(L d) which equated to an additional 167 g N removed/d
for these biofilters. Removal of sulfide also tended to increase at
higher HRTs, though this regression was even less strongly correlated (Fig. 6a). For fluidized systems, this reduction in flow rate to
achieve a longer HRT is a tradeoff resulting in less fluidization of the
sulfur particles, and thus the HRT would need to be increased via a
larger biofilter. A recommended 60% expansion, as was modeled in
Christianson and Summerfelt (2014), would have required a flow
rate of over 80 L/min and yielded an HRT of only 2.5 min in these
biofilters. Other reported HRTs for packed or continuously stirred
sulfur denitrification reactors have been on the order of 3 to 24 h
(Lampe and Zhang, 1996; Lee et al., 2001; Sahinkaya and Kilic, 2014;
Fig. 6. Nitrate–N and sulfide removal rate (a) and observed and theoretical sulfate production rate, (b) across a range of flow rates, hydraulic retention times, and fluidization
expansion levels from Phase II of fluidized sulfur biofilter operation.
L. Christianson et al. / Aquacultural Engineering 68 (2015) 10–18
Sahinkaya et al., 2014). Koenig and Liu (1996) reported the required
HRT for complete N reduction depended upon the sulfur particle size, and showed greater than 30 min was required for a 40%
nitrate removal efficiency using their smallest sulfur size fraction
(2.8–5.6 mm) in packed beds. At a loading of 2.2 kg N/(m3 -d), Kim
and Bae (2000) reported an HRT of 2.34 h in a packed bed provided
complete denitrification. Loading during Phase II was between 2.7
and 6.7 kg N/(m3 biofilter-d), thus a greater HRT, in a packed bed at
least, would have been required for complete N removal. The only
comparable fluidized bed study reported an HRT of 0.19 h (empty
bed contract time) and bed expansion of 25–30% (2–3.35 mm sulfur
particle size; Kim et al., 2004). Under these conditions, greater than
90% removal efficiency was achieved from an influent concentration of 20 mg NO3 –N/L. However, Kim et al. (2004) also reported
a decline in N removal-performance when N loading exceeded
2.53 kg N/(m3 -d), as the present study did. Ideally, this study would
have been improved if the biofilters were 2–3 m taller or if a slightly
smaller-sized sulfur particle could have been identified, because
both options would have increased the HRT within the denitrification bed.
4. Conclusions
Despite only removing 1.57 ± 0.15 and 1.82 ± 0.32 mg NO3 –N/L
each pass through the biofilter during Phase I, removal rates
were the highest reported for sulfur-based denitrification systems
(0.71 ± 0.07 and 0.80 ± 0.15 g N removed/(L bioreactor-d)). Lower
than expected sulfate production indicated some of the nitrate
removal was due to heterotrophic denitrification although there
was no statistically significant decrease in COD or cBOD5 concentrations between the influent and effluent. Mixotrophic denitrification
was verified via the presence of both heterotrophic and autotrophic
denitrifiers. Phase II tended to indicate that longer retention times
may result in more nitrate removal and sulfate production, but
increasing the retention time through flow rate manipulation may
create fluidization challenges for these sulfur particles. Operationally, the sulfur particles will degrade over time, and optimizing
the balance of fluidization velocity versus HRT may be challenging.
Acknowledgements
The authors wish to thank the Herrick Foundation (Detroit,
Michigan, USA) for their gracious support. This research was additionally supported by the USDA Agricultural Research Service under
Agreement no. 59-1930-0-046. A debt of gratitude is due to Shanen
Cogan and Fred Ford for technical assistance and Issra Arif for initial
assistance with the testing.
References
APHA, 2005. Standard Methods for the Examination of Water and Wastewater,
21st ed. American Public Health Association, Washington, DC.
Batchelor, B., Lawrence, A.W., 1978. A kinetic model for autotrophic denitrification
using elemental sulfur. Water Res. 12 (12), 1075–1084.
Chen, L.X., Li, J.T., Chen, Y.T., Huang, L.N., Hua, Z.S., Hu, M., Shu, W.S., 2013. Shifts in
microbial community composition and function in the acidification of a
lead/zinc mine tailings. Environ. Microbiol. 15 (9), 2431–2444.
Christianson, L., Summerfelt, S., 2014. Fluidization velocity assessment of
commercially available sulfur particles for use in autotrophic denitrification
biofilters. Aquacult. Eng. 60, 1–5.
Furumai, H., Tagui, H., Fujita, K., 1996. Effects of pH and alkalinity on
sulfur-denitrification in a biological granular filter. Water Sci. Technol. 34
(1–2), 355–362.
Hach Company, 2003. DR/4000 Spectrophotometer Procedures Manual, 11th ed.
Hach Company, USA.
Kim, E., Bae, J., 2000. Alkalinity requirements and the possibility of simultaneous
heterotrophicdenitrification during sulfur-utilizing autotrophic denitrification.
Water Sci. Technol. 42 (3–4), 233–238.
Kim, H.R., Lee, I.S., Bae, J.H., 2004. Performance of a sulphur-utilizing fluidized bed
reactor for post-denitrification. Process Biochem. 39 (11), 1591–1597.
17
Koenig, A., Liu, L.H., 1996. Autotrophic denitrification of landfill leachate using
elemental sulphur. Water Sci. Technol. 34 (5–6), 469–476.
Lampe, D.G., Zhang, T.C., 1996. Evaluation of sulfur-based autotrophic
denitrification. In: Proceedings of the HSRC/WERC Joint Conference on the
Environment, Great Plains/Rocky Mountain Hazardous Substance Research
Center.
Lee, D.U., Lee, I.S., Choi, Y.D., Bae, J.H., 2001. Effects of external carbon source and
empty bed contact time on simultaneous heterotrophic and sulfur-utilizing
autotrophic denitrification. Process Biochem. 36 (12), 1215–1224.
Lee, H.W., Park, Y.K., Choi, E., Lee, J.W., 2008. Bacterial community and biological
nitrate removal: comparisons of autotrophic and heterotrophic reactors for
denitrification with raw sewage. J. Microbiol. Biotechnol. 18 (11), 1826–1835.
Oh, S., Yoo, Y., Young, J., Kim, I., 2001. Effect of organics on sulfur-utilizing
autotrophic denitrification under mixotrophic conditions. J. Biotechnol. 92 (1),
1–8.
Oh, S., Bum, M., Yoo, Y., Zubair, A., Kim, I., 2003. Nitrate removal by simultaneous
sulfur utilizing autotrophic and heterotrophic denitrification under different
organics and alkalinity conditions: batch experiments. Water Sci. Technol. 47
(1), 237–244.
Park, S., Lee, J., Park, J., Byun, I., Park, T., Lee, T., 2010. Characteristics of nitrogen
removal and microbial distribution by application of spent sulfidic caustic in
pilot scale wastewater treatment plant. Water Sci. Technol. 62 (6), 1440–1447.
Park, S., Yu, J., Byun, I., Cho, S., Park, T., Lee, T., 2011. Microbial community
structure and dynamics in a mixotrophic nitrogen removal process using
recycled spent caustic under different loading conditions. Bioresour. Technol.
102 (15), 7265–7271.
Payne, W., 1973. Reduction of nitrogenous oxides by microorganisms. Bacteriol.
Rev. 37 (4), 409–452.
Rösch, C., Mergel, A., Bothe, H., 2002. Biodiversity of denitrifying and
dinitrogen-fixing bacteria in an acid forest soil. Appl. Environ. Microbiol. 68
(8), 3818–3829.
Sahinkaya, E., Kilic, A., 2014. Heterotrophic and elemental-sulfur-based
autotrophic denitrification processes for simultaneous nitrate and Cr(VI)
reduction. Water Res. 50, 278–286.
Sahinkaya, E., Kilic, A., Duygulu, B., 2014. Pilot and full scale applications of
sulfur-based autotrophic denitrification process for nitrate removal from
activated sludge process effluent. Water Res. 60, 210–217.
Shao, M.F., Zhang, T., Fang, H.H.P., 2010. Sulfur-driven autotrophic denitrification:
diversity, biochemistry, and engineering applications. Appl. Microbiol.
Biotechnol. 88 (5), 1027–1042.
Sher, Y., Schneider, K., Schwermer, C.U., van Rijn, J., 2008. Sulfide-induced nitrate
reduction in the sludge of an anaerobic digester of a zero-discharge
recirculating mariculture system. Water Res. 42 (16), 4386–4392.
Summerfelt, S.T., 2006. Design and management of conventional fluidized-sand
biofilters. Aquacult. Eng. 34 (3), 275–302.
Summerfelt, S.T., Vinci, B.J., 2008. Better management practices for recirculating
aquaculture systems. In: Tucker, C.S., Hargreaves, J.A. (Eds.), Environmental
Best Management Practices for Aquaculture. Blackwell Publishing, Ames, IA,
pp. 389–426 (Chapter 10).
Sun, Y., Nemati, M., 2012. Evaluation of sulfur-based autotrophic denitrification
and denitritation for biological removal of nitrate and nitrite from
contaminated waters. Bioresour. Technol. 114, 207–216.
Timmons, M.B., Ebeling, J.M., 2010. Recirculating Aquaculture, second ed. Cayuga
Aqua Ventures, Ithaca, NY.
Tsukuda, S., Christianson, L., Kolb, A., Saito, K., Summerfelt, S., 2015. Heterotrophic
denitrification of aquaculture effluent using fluidized sand biofilters. Aquacult.
Eng. 64, 49–59.
USEPA, 1978. Autotrophic Denitrification Using Sulfur Electron Donors
(EPA-600/2-78-113). U.S. Environmental Protection Agency, Washington, DC.
van Rijn, J., Tal, Y., Schreier, H.J., 2006. Denitrification in recirculating systems:
theory and applications. Aquacult. Eng. 34 (3), 364–376.
Xu, X.J., Chen, C., Wang, A.J., Yu, H., Zhou, X., Guo, H.L., Yuan, Y., Lee, D.J., Zhou, J.,
Ren, N.Q., 2014. Bioreactor performance and functional gene analysis of
microbial community in a limited-oxygen fed bioreactor for co-reduction of
sulfate and nitrate with high organic input. J. Hazard. Mater. 278, 250–257.
Zhang, T.C., Lampe, D.G., 1999. Sulfur: limestone autotrophic denitrification
processes for treatment of nitrate-contaminated water: batch experiments.
Water Res. 33 (3), 599–608.
Dr. Laura Christianson has been a Research Agricultural Engineer for The Conservation Fund’s Freshwater Institute, Shepherdstown, WV since 2013. She finished her
Ph.D. in Agricultural Engineering (Co-Major: Sustainable Agriculture) at Iowa State
University in December 2011 where her dissertation focused on improvement of
agricultural drainage water quality through the use of denitrification “woodchip”
bioreactors. During her Ph.D., she spent a year in New Zealand studying agricultural
water quality and denitrification technologies as a Fulbright Fellow. Laura previously completed a M.S. in Biological and Agricultural Engineering at Kansas State
University and a B.S. in Biosystems Engineering at Oklahoma State University.
Christine Lepine is a Research Technician for The Conservation Fund’s Freshwater
Institute (TCFFI), Shepherdstown, WV. She has been with TCFFI since 2014, originally
starting as a Research Intern. She also recently graduated magna cum laude from
Shepherd University with a B.S. in Environmental Studies, Concentration of Resource
Management.
Scott Tsukuda is the Director of Operations at The Conservation Fund’s Freshwater
Institute (TCFFI), Shepherdstown, WV, with his focus on energy monitoring and
18
L. Christianson et al. / Aquacultural Engineering 68 (2015) 10–18
auditing. Some of his past work has included MS Excel computer modeling, PLC
programming, denitrification technologies and alternative waste treatment systems
demonstration. He is a member of the Instrumentation, Systems and Automation
Society (ISA) and the Institute of Electrical and Electronics Engineers (IEEE) plus
holds a M.S. in Agricultural Engineering and a B.S. in Agricultural Engineering from
Cornell University. Past certifications include Microsoft Certified Systems Engineer
(MCSE). He is currently Certified Energy Manager (CEM).
Dr. Keiko Saito has been a Research Assistant Professor at University of Maryland Baltimore County’s Institute of Marine and Environmental Technology since
2010. Her research focuses on aquatic microbial ecology and aquacultural microbiology, and on applying molecular approaches to link the critical roles of
microbial community composition, functional diversity, ecosystem processes, and
bio-degradation/remediation. She is working toward development and improvement of microbially mediated waste treatment technologies for next-generation
aquaculture practices.
Dr. Steven T. Summerfelt, Professional Engineer, is Director of Aquaculture Systems
Research at The Conservation Fund’s Freshwater Institute (TCFFI), Shepherdstown,
WV, where he has been an employee since 1992. He is Project Leader on TCFFI’s
USDA-ARS project titled, “Development of Sustainable Land-based Aquaculture Production Systems” and has authored or co-authored of over 60 refereed papers, 9 book
chapters, and a book titled “Recirculating Aquaculture Systems”. Steve has designed
several large private and public fish culture facilities using closed-containment
technologies. He has B.S., M.S., and Ph.D. degrees in the fields of chemical and
environmental engineering.