Stereochemical analysis of the 3 and 3
Bạn đang xem bản rút gọn của tài liệu. Xem và tải ngay bản đầy đủ của tài liệu tại đây (146.42 KB, 8 trang )
MAGNETIC RESONANCE IN CHEMISTRY
Magn. Reson. Chem. 2002; 40: 581–588
Published online in Wiley InterScience (www.interscience.wiley.com). DOI: 10.1002/mrc.1064
Stereochemical analysis of the 3a- and 3b-hydroxy
metabolites of tibolone through NMR and
quantum-chemical investigations. An experimental test
of GIAO calculations
Diego Colombo,1 Patrizia Ferraboschi,1∗ Fiamma Ronchetti1 and Lucio Toma2
1
2
Dipartimento di Chimica e Biochimica Medica, Universita` di Milano, Via Saldini 50, 20133 Milan, Italy
Dipartimento di Chimica Organica, Universita` di Pavia, Via Taramelli 10, 27100 Pavia, Italy
Received 16 January 2002; Revised 15 May 2002; Accepted 24 May 2002
The configuration at C-3 of the 3a- and 3b-hydroxy metabolites of tibolone was studied by extensive
application of one- and two-dimensional 1 H and 13 C NMR spectroscopy combined with molecular
modeling performed at the B3LYP/6–31G(d) level. Using HF and DFT GIAO methods, shielding tensors
of the two molecules were computed; comparison of the calculated NMR chemical shifts with the
experimental values revealed that the density functional methods produced the best results for assigning
proton and carbon resonances. Although steroids are relatively large molecules, the present approach
appears accurate enough to allow the determination of relative configurations by using calculated 13 C
resonances; the chemical shift of pairs of geminal a/b hydrogen atoms can also be established by using
calculated 1 H resonances. Copyright 2002 John Wiley & Sons, Ltd.
KEYWORDS: NMR; 1 H NMR; 13 C NMR; tibolone metabolites; stereochemistry; steroids; molecular modeling; HF
calculations; DFT calculations
INTRODUCTION
The synthetic steroid tibolone (Org OD 14) (1) is widely
used in hormone replacement therapy (HRT) of menopausal
complaints1 and it is metabolized mainly affording the 4-ene
isomer 2 and the 3˛- and the 3ˇ-alcohols 3 and 4 obtained
by reduction of the 3-keto group. The hormonal activities
of these three steroids have been extensively evaluated2 and
more recently the role of tibolone and its metabolites in the
protection of breast tissue in postmenopausal women with
HRT has been studied.3 – 7
Considering the pharmacological significance of tibolone
metabolites and the few available chemico-physical data, we
decided to study the 3-hydroxy derivatives, verifying the
configuration at C-3 of both epimers. They can be easily
prepared from 1, the first by reduction with lithium tritert-butoxyaluminum hydride that affords a predominant
product purified by crystallization. Its 3-epimer can be
obtained by inversion of the configuration at C-3 performed
through a Mitsunobu reaction.8 The 3˛ configuration,
represented by structure 3, might be assigned to the
main product of reduction on the basis of the structural
analogy of 1 with the antifertility steroid norethinodrel
Ł Correspondence to: Patrizia Ferraboschi, Dipartimento di Chimica
e Biochimica Medica, Universit`a di Milano, Via Saldini 50, 20133
Milan, Italy. E-mail:
Contract/grant sponsor: Universit`a degli Studi di Milano.
Contract/grant sponsor: Universit`a degli Studi di Pavia.
(5), of which the tibolone is the 7˛-methyl analogue and
which on metal hydride reduction affords as preferred
product the 3˛-hydroxy derivative owing to the quasi-chair
conformation assumed by the A ring.9,10 Although tibolone
and norethinodrel share the same A ring, the presence of a
methyl group at position 7 could, in principle, modify the A
ring quasi-chair conformation and hence the stereochemical
outcome of the 3-ketone reduction.
We report here a detailed NMR study of diol 3 and its
epimer 4 combined with a modeling investigation through
quantum-chemical calculations that allowed us to confirm
the assignment of the relative configuration at C-3 and to
explore the usefulness of theoretical calculations of 1 H and
13
C chemical shifts in relation to stereochemical studies of
steroidal compounds.
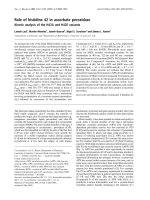
RESULTS AND DISCUSSION
Reduction of tibolone (1) with lithium tri-tert-butoxyaluminum hydride yielded two epimeric diols (3 and 4) in a ratio
of ca 96 : 4. The main product 3 was easily obtained pure
by crystallization from hexane–acetone whereas its epimer
4 was prepared by treatment of 3 with benzoic acid, diisopropyl diazadicarboxylate and triphenylphosphine followed
by hydrolysis of the recovered benzoate.
Complete 1 H and 13 C NMR signal assignments (Tables 1
and 2) of the spectra of 3 and 4 were achieved using a combination of 1D and 2D (COSY, HSQC and NOESY) experiments
Copyright 2002 John Wiley & Sons, Ltd.
582
D. Colombo et al.
HO
HO
O
O
1
172
HO
12 18
11
1
2
10
8
HO
12 18
171
17 16
13
9
2
11
1
14
15
2
10
13
9
4
5
HO 3
71
6
8
14
172
HO
15
7
7
HO 3
171
17 16
4
5
71
6
O
4
3
5
Table 1. GIAO-calculated 1 H NMR chemical shifts (υ, in ppm relative to TMS) for 3 and 4 based on geometries optimized at the
B3LYP/6–31G(d) level in comparison with the experimental values from the spectra recorded in chloroform–pyridine (1 : 1)
Ha
Exp.
HF/
6–31G(d)
HF/
6–31G(d,p)
B3LYP/
6–31G(d)
B3LYP/
6–31G(d,p)
B3PW91/
6–31G(d)
B3PW91/
6–31G(d,p)
3
1˛
1ˇ
2˛
2ˇ
3
4˛
4ˇ
6˛
6ˇ
7
8
9
11˛
11ˇ
12˛
12ˇ
14
15˛
15ˇ
16˛
16ˇ
18
71
172
1.97
2.17
1.57
2.08
3.94
2.05
2.33
1.62
2.23
1.81
1.47
1.69
1.96
1.20
1.90
1.71
1.90
1.66
1.34
2.40
2.13
1.02
0.81
2.84
1.64
1.96
1.14
1.87
3.59
1.33
2.10
1.33
1.98
1.49
1.26
1.42
1.62
1.05
1.71
1.24
1.51
1.48
1.25
2.24
2.05
0.92
0.85
2.75
1.55
1.88
1.04
1.77
3.44
1.24
2.00
1.21
1.90
1.34
1.07
1.28
1.53
0.95
1.64
1.14
1.35
1.41
1.17
2.18
1.95
0.86
0.79
2.69
1.92
2.26
1.21
1.87
3.79
1.50
2.26
1.56
2.22
1.78
1.71
1.97
1.82
1.33
1.90
1.45
2.13
1.66
1.46
2.30
2.12
0.95
0.91
1.94
1.90
2.23
1.12
1.83
3.72
1.43
2.21
1.47
2.19
1.71
1.57
1.85
1.79
1.27
1.87
1.41
2.03
1.64
1.42
2.29
2.09
0.93
0.87
2.05
1.91
2.25
1.22
1.87
3.81
1.51
2.26
1.57
2.21
1.79
1.73
1.97
1.82
1.32
1.89
1.45
2.13
1.65
1.44
2.31
2.11
0.93
0.88
2.03
1.89
2.22
1.13
1.82
3.74
1.44
2.22
1.48
2.18
1.72
1.59
1.84
1.79
1.26
1.86
1.40
2.02
1.63
1.40
2.30
2.08
0.91
0.85
2.13
4
1˛
1ˇ
2˛
2ˇ
3
4˛
4ˇ
6˛
6ˇ
7
8
1.84
2.43
1.74
1.87
4.16
2.21
2.13
1.56
2.31
1.81
1.50
1.59
1.99
1.31
1.79
3.69
1.81
1.75
1.33
1.95
1.50
1.24
1.52
1.92
1.20
1.68
3.57
1.72
1.66
1.21
1.88
1.35
1.07
1.79
2.32
1.55
1.73
3.82
2.16
1.89
1.57
2.20
1.79
1.70
1.76
2.31
1.48
1.67
3.81
2.11
1.83
1.48
2.17
1.73
1.58
1.79
2.28
1.53
1.73
3.83
2.14
1.91
1.58
2.19
1.81
1.73
1.76
2.28
1.46
1.68
3.83
2.09
1.84
1.49
2.16
1.74
1.59
Compound
Copyright 2002 John Wiley & Sons, Ltd.
Magn. Reson. Chem. 2002; 40: 581–588
Stereochemical analysis of tibolone metabolites
Table 1. (Continued)
Compound
a
Ha
Exp.
HF/
6–31G(d)
HF/
6–31G(d,p)
B3LYP/
6–31G(d)
B3LYP/
6–31G(d,p)
B3PW91/
6–31G(d)
B3PW91/
6–31G(d,p)
9
11˛
11ˇ
12˛
12ˇ
14
15˛
15ˇ
16˛
16ˇ
18
71
172
1.73
1.99
1.21
1.91
1.70
1.90
1.67
1.34
2.40
2.13
0.98
0.83
2.83
1.48
1.69
0.99
1.74
1.25
1.52
1.49
1.25
2.25
2.05
0.91
0.87
2.76
1.34
1.61
0.90
1.66
1.16
1.36
1.41
1.17
2.19
1.96
0.86
0.80
2.70
2.02
1.89
1.28
1.93
1.46
2.15
1.67
1.46
2.31
2.13
0.95
0.92
1.95
1.90
1.88
1.24
1.90
1.42
2.05
1.65
1.43
2.30
2.09
0.93
0.89
2.06
2.02
1.89
1.27
1.92
1.46
2.15
1.65
1.45
2.32
2.12
0.93
0.90
2.04
1.90
1.88
1.22
1.89
1.42
2.04
1.64
1.41
2.32
2.08
0.91
0.87
2.14
Numbered according to IUPAC–IUB Joint Commission on Biochemical Nomenclature (www.chem.qmul.ac.uk/iupac/steroid/).
Table 2. GIAO-calculated 13 C NMR chemical shifts (υ, in ppm relative to TMS) for 3 and 4 based on geometries optimized at the
B3LYP/6–31G(d) level in comparison with the experimental values from the spectra recorded in chloroform–pyridine (1 : 1)
Compound
C
Exp.
HF/
6–31G(d)
HF/
6–31G(d,p)
B3LYP/
6–31G(d)
B3LYP/
6–31G(d,p)
B3PW91/
6–31G(d)
B3PW91/
6–31G(d,p)
3
1
2
3
4
5
6
7
8
9
10
11
12
13
14
15
16
17
18
71
171
172
27.5
33.1
67.3
41.2
124.6a
38.9
27.5
42.0
40.2
128.7a
25.7
33.6
47.8
46.3
22.3
39.5
79.0
13.3
13.0
89.5
73.2
25.0
29.9
59.7
37.4
125.3
34.4
24.3
34.8
34.7
129.0
23.7
28.7
40.8
38.6
21.0
34.5
69.2
14.6
13.8
78.1
75.3
25.4
30.5
60.6
38.2
126.4
35.0
25.2
35.9
35.7
130.1
24.2
29.4
42.0
39.7
21.3
35.0
70.6
14.6
13.9
79.9
76.1
29.7
34.3
66.6
42.8
123.4
39.6
30.8
42.9
42.0
127.0
28.1
33.8
50.8
47.5
24.4
39.3
79.4
15.4
14.4
78.1
67.7
30.2
34.8
67.7
43.5
124.8
40.3
31.7
44.1
43.2
128.4
28.6
34.3
52.4
48.6
24.8
39.7
81.2
15.3
14.3
80.4
69.0
29.6
33.5
66.3
42.3
123.9
39.3
30.2
42.3
41.5
127.3
27.6
33.4
50.6
47.0
24.4
38.9
79.7
15.3
14.4
79.7
70.4
30.1
34.0
67.3
43.0
125.2
39.9
31.0
43.4
42.6
128.6
28.0
33.9
52.1
48.0
24.7
39.2
81.3
15.3
14.3
81.9
71.6
4
1
2
3
4
5
6
7
8
9
10
11
12
23.2
30.8
65.1
40.1
123.4a
39.5
27.5
41.9
39.9
128.6a
25.6
33.6
21.3
27.2
58.1
35.2
124.6
34.5
24.3
34.9
34.7
128.8
23.7
28.8
21.8
27.7
58.9
35.8
125.7
35.2
25.2
35.9
35.8
129.9
24.3
29.4
25.1
31.0
64.9
40.2
122.4
39.8
30.8
43.0
42.1
126.8
28.1
33.8
25.6
31.4
65.9
41.0
123.8
40.5
31.6
44.2
43.3
128.3
28.6
34.3
25.0
30.5
64.7
39.9
122.9
39.5
30.2
42.4
41.6
127.2
27.6
33.4
25.4
30.9
65.6
40.6
124.1
40.1
31.0
43.5
42.8
128.5
28.0
33.9
(continued overleaf )
Copyright 2002 John Wiley & Sons, Ltd.
Magn. Reson. Chem. 2002; 40: 581–588
583
584
D. Colombo et al.
Table 2. (Continued)
Compound
a
C
Exp.
HF/
6–31G(d)
HF/
6–31G(d,p)
B3LYP/
6–31G(d)
B3LYP/
6–31G(d,p)
B3PW91/
6–31G(d)
B3PW91/
6–31G(d,p)
13
14
15
16
17
18
71
171
172
47.7
46.4
22.3
39.4
79.0
13.2
13.2
89.6
73.2
40.8
38.7
21.0
34.6
69.2
14.7
13.8
78.1
75.4
42.0
39.7
21.4
35.0
70.5
14.7
13.9
79.9
76.2
50.8
47.5
24.5
39.4
79.4
15.4
14.4
78.1
67.7
52.4
48.7
24.9
39.8
81.2
15.4
14.3
80.4
69.0
50.6
47.0
24.4
39.0
79.7
15.4
14.4
79.7
70.5
52.1
48.1
24.7
39.3
81.3
15.3
14.3
81.9
71.7
Assigned through comparison with the calculated values.
recorded in a chloroform–pyridine (1 : 1) mixture, as this solvent gave the best spread of proton resonances of the two
steroids. Starting from the characteristic resonances of the
7˛-methyl group and of the H-3 proton, it was possible to
assign the resonances of H-1, H-2, H-4, H-6, H-7 and H-8 of
both 3 and 4 on the basis of their COSY and HSQC spectra. Also, even if many protons in the 1 H NMR spectrum
resonated as complex multiplets in the range 1.2–2.5 ppm,
some of these (Table 1) resulted in well resolved signals the
coupling of which could be measured (Table 3). In particular,
the assignments of some pairs of geminal protons (H-6, H-11,
H-15 and H-16 of both 3 and 4 and H-2 and H-4 of 3) were
made by comparison (Table 3) of the experimental values
of the vicinal coupling constants with the values calculated
through the electronegativity-modified Karplus relationship
(see below). NOE contacts from NOESY spectra were useful
for the assignment of other geminal protons, i.e. H-12 of both
3 and 4 (NOE between H-12ˇ and H3 -18), H-1 of 3 (NOE
between H-1ˇ and H-3) and H-4 of 4 (NOE between H-4˛
and H-6˛), while the pairs of geminal H-1 and H-2 protons
of 4 were tentatively assigned from the 1 H NMR chemical
shifts (Table 1) calculated through the GIAO approach (see
below). Finally, a cross peak between H-11˛ and one of the
H-1 protons in the NOESY spectrum of the isomer 4 was significant for the assignment of the protons H-11 vs H-15 and,
consequently, of H-9 vs H-14 and H-12 vs H-16, of the C and
D rings. As this part of the molecule is identical for the two
isomers, the protons of the C and D rings were assigned for 3
on the basis of the resonances already established for 4, even
though the NOESY cross peak between ˛H-11 and one of the
H-1 protons, which is assumed from the computed distances
(data not shown), was not evidenced because of resonance
overlapping in the corresponding proton spectrum (Table 1).
The H-3 signal is of special interest as the four vicinal
coupling constants of H-3 (Table 3) can be diagnostic for
the configuration at C-3. This configurational assignment
relies heavily, however, on the knowledge of the exact
conformational preferences of 3 and 4 and, in particular, of
the A ring. In fact, owing to the presence of the 5(10) double
bond, two half-chair conformations can be envisaged (A and
B type, Figure 1), the relative stability of which derives from a
fine balance between steric and electronic factors. The vicinal
coupling constants indicate a pseudo-axial orientation of the
Copyright 2002 John Wiley & Sons, Ltd.
Table 3. Experimental 1 H NMR coupling constants (Hz) for 3
and 4 in comparison with the values calculated with the
electronegativity-modified Karplus relationship
J
3 (exp.)
2˛,2ˇ
1˛,2˛
1˛,2ˇ
1ˇ,2˛
1ˇ,2ˇ
2˛,3
2ˇ,3
4˛,4ˇ
3,4˛
3,4ˇ
6˛,6ˇ
6˛,7
6ˇ,7
7,71
7,8
8,9
8,14
11˛,11ˇ
9,11˛
9,11ˇ
11˛,12˛
11˛,12ˇ
11ˇ,12˛
11ˇ,12ˇ
15˛,15ˇ
14,15˛
14,15ˇ
16˛,16ˇ
15˛,16˛
15˛,16ˇ
15ˇ,16˛
15ˇ,16ˇ
11.5
5.5
11.5
11.5
3.5
16.8
9.0
5.5
16.5
<1.0
7.0
7.0
3.0
11.0
11.0
12.0
12.0
12.0
3.0
12.0
12.0
15.0
9.0
5.5
12.0
3 (calcd)
5.5
2.5
11.3
6.1
10.7
3.3
9.3
5.5
1.4
6.1
3.0
12.0
12.0
3.2
12.3
4.0
2.7
13.1
4.0
6.0
11.4
12.1
3.0
4.7
12.2
4 (exp.)
2.0
6.0
17.0
3.5
4.5
17.0
<1.0
6.0
7.0
3.0
11.0
11.0
13.0
3.5
13.0
3.5
3.5
13.0
3.5
12.5
12.5
13.0
10.0
4.0
5.5
12.5
4 (calcd)
5.8
2.5
11.0
6.4
2.0
5.3
4.0
3.5
1.4
6.1
2.4
12.0
12.0
3.2
12.3
4.0
2.7
13.1
4.0
6.0
11.4
12.1
3.0
4.8
12.2
H-3 atom for 3 (and hence a hydroxy group equatorially
oriented) and vice versa for 4. However, these data cannot
be of help until the conformational preferences of 3 and 4
have been established.
Magn. Reson. Chem. 2002; 40: 581–588
Stereochemical analysis of tibolone metabolites
Table 4. Relative energy (kcal
mol 1 ) and population percentages
at 298K of the B3LYP/6–31G(d)
optimized conformations of 3 and 4
Conformation
Erel
%
3A
3B
4A
4B
0.00
1.18
0.00a
1.22
88.0
12.0
88.7
11.3
a
Erel D 0.03 kcal mol 1 with respect
to 3A (1 kcal = 4.184 kJ).
The relative stability of conformers A and B was
determined within the DFT framework using a hybrid
exchange-correlation functional, B3LYP,11 at the 6–31G(d)
level as implemented in Gaussian 98.12 The relative energies
of these conformers are reported in Table 4 together with the
population percentages, calculated through the Boltzmann
equation, and their 3D representations are reported in
Fig. 1. It can be seen that both compounds prefer by
about 90% a conformation of type A that makes the OH
group equatorial in 3 and axial in 4. For each conformer
the 1 H vicinal coupling constants were calculated with
the electronegativity-modified Karplus relationship13 and
were weighted averaged on the basis of the population
percentages. The values obtained are reported in Table 3 in
comparison with the experimental constants for 3 and 4. The
close agreement of the experimental and calculated values
confirms that the configuration at C-3 of diol 3 is ˛ and
similarly the configuration of diol 4 is ˇ. A number of NOE
contacts (e.g. between H-4ˇ and H-3 in 3 and between H-4˛
and H-3 in 4) further confirm the assigned structures. These
˚ as measured on the
contacts correspond to distances of <3 A
computed 3A and 4A conformations of 3 and 4, respectively.
Ab initio computation of NMR chemical shifts is becoming a convenient alternative tool for facilitating spectral
assignments and rationalizing experimental chemical shifts,
but has been infrequently applied to steroidal compounds.
For these calculations, the gauge-including atomic orbital
(GIAO)14 method is the more widely used; Cheeseman
et al.15 recommended the following procedure to give a reliable estimate of shielding constants: after an optimization
at the B3LYP/6–31G(d) level, the optimized geometries
should be used to compute the NMR properties at the
HF/6–31G(d) level, predicting the isotropic chemical shifts
for carbon and hydrogen atoms with respect to tetramethylsilane (TMS). However, other workers suggested the use of
different models and/or basis sets also in relation to the
nuclei which are to be predicted.16 Hence, in this work two
DFT functionals,11,17 B3LYP and B3PW91, together with the
traditional Hartree–Fock method were used for GIAO calculations combined with the 6–31G(d) and 6–31G(d,p) basis
sets.
We computed both the 1 H and 13 C chemical shifts for each
pair of conformations of 3 and 4 and weighted averaged them
on the basis of the population percentages; the results are
reported in Tables 1 and 2. The shifts for the carbon atoms
computed with the HF approach appear prevalently at higher
fields than those measured experimentally with an error that
can become higher than 10 ppm. This disagreement does not
depend on the fact that GIAO calculations do not explicitly
consider the solvent, in our case a 1 : 1 mixture of pyridine
and chloroform, as 13 C chemical shifts are not sensitive to the
solvent, as can be seen from the data in Table 5, where the
13
C resonances in chloroform and pyridine are reported; the
solvent effect is in general limited to less than 1 ppm with
the only exception of the quaternary acetylenic atom. The
change of the basis set from 6–31G(d) to 6–31G(d,p) slightly
improved the results that, however, remain unsatisfactory.
An improvement could be observed by turning to the density
functional methods which presented fairly good agreement
of the calculated and experimental values; however, the
prediction of the acetylenic carbon atoms still remains
unsatisfactory.
To allow an easier comparison of methods and basis sets,
we determined the root mean square (r.m.s.) errors between
calculated and experimental 13 C resonances (Table 6). The
values were calculated by inclusion or exclusion of the data
for the two acetylenic carbon atoms. It appears that the use
of a density functional method is largely to be preferred
3A
3B
4A
4B
Figure 1. 3D plots of the minimum energy conformations of 3 and 4.
Copyright 2002 John Wiley & Sons, Ltd.
Magn. Reson. Chem. 2002; 40: 581–588
585
586
D. Colombo et al.
Table 5. 13 C NMR chemical shifts (υ, in ppm relative to TMS)
for 3 and 4 from the spectra recorded in chloroform and in
pyridine
Compound 3
Compound 4
C
Chloroform
Pyridine
Chloroform
Pyridine
1
2
3
4
5
6
7
8
9
10
11
12
13
14
15
16
17
18
71
171
172
27.2
32.6
68.1
40.6
124.1
38.7
27.0
41.7
39.8
128.6
25.3
33.2
47.5
46.2
22.1
39.0
79.8
12.9
12.9
87.9
73.7
27.8
33.7
67.4
41.7
124.9
39.1
27.7
42.2
40.5
129.0
25.9
34.0
48.1
46.7
22.6
40.0
79.2
13.6
13.1
90.3
74.1
22.3
29.9
65.9
39.7
122.6
39.1
27.3
41.7
39.5
128.5
25.3
33.1
47.4
46.3
22.1
39.0
79.9
12.9
13.0
87.8
73.8
23.6
31.4
65.3
40.7
123.7
40.0
27.8
42.2
40.2
128.9
25.9
34.0
48.0
46.8
22.6
39.7
79.2
13.3
13.5
90.3
74.1
over the HF method as r.m.s. errors of 1.5 ppm are observed
with the B3PW91 method if only sp3 and sp2 carbon atoms
are considered. The use of the more extended basis set
6–31G(d,p) seems unnecessary as it gives a worsening of the
errors.
We now address the question of whether the theoretical
calculation of the 13 C resonances can be used for the assignment of the relative configuration of the diastereoisomeric
pair 3–4. We think that they can, in particular through minimization of the systematic errors by expressing the chemical
shifts of the carbon atoms of one isomer relative to the values
of the other isomer. Table 7 reports calculated and experimental υ(˛ ˇ): obviously, these υ values are significant
only for the carbon atoms of ring A, as the other rings
are identical. Very close agreement between experimental
and calculated υ values can be observed at all levels of
calculation.
As far as the 1 H NMR resonances are concerned, also in
this case the density functional methods with the 6–31G(d)
basis set work better than the Hartree–Fock method as
r.m.s. errors less than 0.2 ppm are observed (Table 6) if the
acetylenic proton is excluded from the computation. In the
case of the proton resonances, comparison of experimental
and calculated values cannot be a safe tool for configurational
assignments; however, it should be pointed out that in each
pair of geminal ˛–ˇ hydrogen atoms, the relative order in
the chemical shifts is correctly predicted (Table 1). Hence
this can become a method for the assignment of ˛- and ˇhydrogens in cases in which other methods, such as vicinal
coupling constant analysis or NOE contacts, fail.
CONCLUSIONS
The C-3 configuration of the diols 3 and 4, obtained by
reduction of tibolone, was assigned through a detailed
modeling study combined with the analysis of the vicinal
coupling constants of the ring A protons compared with the
theoretical J values. It has been shown that B3LYP/6–31G(d)
optimization followed by GIAO NMR calculations with the
same method or with the other DFT approach (B3PW91) is no
doubt a better way to carry out the theoretical determination
of 1 H and 13 C resonances. These methods are accurate
enough to permit the stereochemical assignment of the
configuration of diastereoisomeric steroidal compounds by
using 13 C resonance differences; the predicted 1 H resonances
appear less precise but allow the assignment of the chemical
shift within pairs of geminal ˛–ˇ hydrogen atoms.
EXPERIMENTAL
All solvents and reagents were purchased from Sigma.
Tibolone (1) was obtained according to Ref. 18. All reactions were monitored by TLC on silica gel 60 F254 plates
(Merck) with detection by spraying with 10% phosphomolybdic acid in ethanol solution and heating at 110 ° C.
Column chromatography was performed on silica gel 60
(0.063–0.200 mm) (Merck). Differential scanning calorimetry
(DSC) was performed on a Perkin-Elmer DSC-7 instrument.
GC analysis was performed on a Hewlett-Packard HP5890
instrument at 260 ° C oven temperature, with an HP5 capillary
Table 6. Comparison of the different methods for prediction of 1 H and 13 C chemical shifts by r.m.s. errors (in ppm)
Compound
3
All 13 C
sp and sp3
All 1 H
sp3 1 H
2
4
All 13 C
sp and sp3
All 1 H
sp3 1 H
2
13
C
13
C
Copyright 2002 John Wiley & Sons, Ltd.
HF/
6–31G(d)
HF/
6–31G(d,p)
B3LYP/
6–31G(d)
B3LYP/
6–31G(d,p)
B3PW91/
6–31G(d)
B3PW91/
6–31G(d,p)
5.3
4.9
0.29
0.30
4.6
4.2
0.39
0.40
3.2
1.7
0.26
0.19
3.1
2.3
0.26
0.20
2.6
1.5
0.25
0.19
2.5
2.0
0.25
0.20
5.3
4.9
0.29
0.30
4.6
4.3
0.38
0.39
3.2
1.7
0.23
0.15
3.1
2.3
0.22
0.16
2.6
1.5
0.22
0.16
2.5
2.0
0.21
0.15
Magn. Reson. Chem. 2002; 40: 581–588
Stereochemical analysis of tibolone metabolites
Table 7. Experimental and calculated 13 C NMR chemical shifts differences, υ(˛
ˇ) (in ppm), between the resonances of 3 and 4
C
Exp.
HF/
6–31G(d)
HF/
m6–31G(d,p)
B3LYP/
6–31G(d)
B3LYP/
6–31G(d,p)
B3PW91/
6–31G(d)
B3PW91/
6–31G(d,p)
1
2
3
4
5
6
7
8
9
10
11
12
13
14
15
16
17
18
71
171
172
4.3
2.3
2.2
1.1
1.2
0.6
0.0
0.1
0.3
0.1
0.1
0.0
0.1
0.1
0.0
0.1
0.0
0.1
0.2
0.1
0.0
3.7
2.7
1.6
2.2
0.7
0.1
0.0
0.1
0.0
0.2
0.0
0.1
0.0
0.1
0.0
0.1
0.0
0.1
0.0
0.0
0.1
3.6
2.8
1.7
2.4
0.7
0.2
0.0
0.0
0.1
0.2
0.1
0.0
0.0
0.0
0.1
0.0
0.1
0.1
0.0
0.0
0.1
4.6
3.3
1.7
2.6
1.0
0.2
0.0
0.1
0.1
0.2
0.0
0.0
0.0
0.0
0.1
0.1
0.0
0.0
0.0
0.0
0.0
4.6
3.4
1.8
2.5
1.0
0.2
0.1
0.1
0.1
0.1
0.0
0.0
0.0
0.1
0.1
0.1
0.0
0.1
0.0
0.0
0.0
4.6
3.0
1.6
2.4
1.0
0.2
0.0
0.1
0.1
0.1
0.0
0.0
0.0
0.0
0.0
0.1
0.0
0.1
0.0
0.0
0.1
4.7
3.1
1.7
2.4
1.1
0.2
0.0
0.1
0.2
0.1
0.0
0.0
0.0
0.1
0.0
0.1
0.0
0.0
0.0
0.0
0.1
column (25 m ð 0.32 mm i.d., 0.52 µm film thickness). Optical rotations were determined on a Perkin-Elmer model 241
polarimeter in ethyl acetate solutions (c D 1.0) in a 1 dm cell
at 25 ° C. Electron ionization mass spectrometry (EI-MS) was
carried out at 70 eV by LC particle beam introduction with
a Hewlett-Packard HP 5988A quadrupolar mass spectrometer equipped with a PB 59980A interface and an HP 1050
low-pressure liquid chromatograph.
Compounds
17˛-Ethynyl-7˛-methyl-5(10)-estren-3˛,17ˇ-diol (3)
A solution of lithium tri-tert-butoxyaluminum hydride (1.1 M,
10.7 ml) in tetrahydrofuran was added dropwise to a solution of
tibolone (1) (1 g, 3.2 mmol) in anhydrous tetrahydrofuran (10 ml)
kept under N2 , at 70 ° C. After 2 h the reaction mixture was poured
into 10% aqueous acetic acid (30 ml) and disodium ethylenediaminetetraacetate (0.2 g) was added. The mixture was extracted
with chloroform (5 ð 25 ml). The collected organic phases were dried
over sodium sulfate; evaporation of the solvents afforded a crude
product: by trituration with three portions of methylene chloride
(5 ml) and crystallization from acetone–hexane pure 3˛-diol 3 (0.7 g,
70%) was recovered. Endothermic peak fusion (DSC) at 187 ° C; [˛]25
D
C
°
C67.1° ; [˛]25
546 C79.9 ; EI-MS: m/z 314 (M , 43%), 296 (100%), 288
(100%); GC, retention time tR D 12.75 min; TLC [CHCl3 –AcOEt
(7 : 3)], Rf D 0.49.
17˛-Ethynyl-7˛-methyl -5(10)-estren-3ˇ,17ˇ-diol (4)
A solution of 3˛-diol 3 (0.44 g, 1.4 mmol) and triphenylphosphine (0.474 g, 1.81 mmol) in anhydrous diethyl ether (8 ml) was
added dropwise to a solution of diisopropyl azodicarboxylate (0.37 g, 1.81 mmol) and benzoic acid (0.222 g, 1.81 mmol) in
diethyl ether (0.8 ml). The reaction mixture was kept at room temperature with stirring overnight. The solvent was removed under
reduced pressure and the crude product was purified by column
chromatography (silica gel, 1 : 10); elution with hexane–ethyl acetate
(9 : 1) afforded the benzoate (0.38 g, 65%). The ester was treated with
sodium carbonate (0.42 g) in methanol–water (9 : 1) (13 ml) at 50 ° C
for 4 h. The reaction mixture was poured into cool water (20 ml) and
the precipitated crude product was recovered by suction. Column
Copyright 2002 John Wiley & Sons, Ltd.
chromatography [silica gel, 1 : 10; hexane–ethyl acetate (7 : 3) as eluant] and crystallization (2-propanol–water) afforded pure 3ˇ-diol 4
°
(0.15 g, 53%). Endothermic peak fusion (DSC) at 142 ° C; [˛]25
D C15.7 ;
° ; EI-MS: m/z 314 (MC , 65%), 296 (67%), 288 (100%); GC,
[˛]25
C18.5
546
tR D 12.56 min; TLC [CHCl3 –AcOEt (7 : 3)], Rf D 0.40.
NMR spectroscopy
All NMR spectra were recorded at 297 K with a Bruker AM500 spectrometer operating at 500.13 and 125.76 MHz for
1
H and 13 C, respectively, using a 5 mm broadband reverse
probe. Chemical shifts are reported on the υ (ppm) scale and
are relative to TMS as an internal reference. Compounds
3 and 4 (ca 15 mg) were dissolved in CDCl3 –pyridine-d5
(1 : 1) (0.5 ml) under N2 , and their assignments were given
by a combination of 1D and 2D COSY, HSQC and NOESY
experiments, using standard Bruker pulse programs. The
pulse widths were 7.5 µs (90° ) and 9.6 µs (90° ) for 1 H and
13
C, respectively. Typically 16K and 32K data points were
collected for one-dimensional proton and carbon spectra,
respectively. Spectral widths were 5747 Hz for 1 H NMR
(digital resolution: 0.70 Hz per point) and 38 461 Hz for 13 C
NMR (digital resolution: 2.34 Hz per point). 2D experiments
parameters were as follows. For 1 H– 1 H correlations (COSY
and NOESY): relaxation delay 1.2 s, data matrix 1K ð 2K (512
experiments to 1K, zero filling in F1 , 2K in F2 ), 16 transients
in each experiment, spectral width 5.9 ppm (2958.6 Hz). The
NOESY spectra were generated with a mixing time of 1.0 s
and acquired in the TPPI mode. There were no significant
differences in the results obtained at different mixing times
(0.5–1.5 s). For 13 C– 1 H correlations (HSQC): relaxation delay
1.5 s, data matrix 0.5K ð 2K (256 experiments to 0.5K, zero
filling in F1 , 2K in F2 ), 32 transients in each experiment,
spectral width 5.9 ppm (2958.6 Hz) in the proton domain
and 147.2 ppm (18 518.5 Hz) in the carbon domain. All 2D
Magn. Reson. Chem. 2002; 40: 581–588
587
588
D. Colombo et al.
spectra were weighted with sine-bell squared and shifted
( /2 in both dimensions) window functions, and processed
with the Bruker software package.
Calculations
All calculations were carried out with the Gaussian 98
program.12 Geometry optimization of the conformations
of 3 and 4 was performed without constraints at the
B3LYP/6–31G(d) level. The population percentages were
calculated from the gas-phase electronic energies of the
conformers through the Boltzmann equation at 298K; the
entropic terms were neglected. Attempts to evaluate the
influence of the solvent on the relative energies of the
conformers were made using a continuum solvent model
(C-PCM)19 at different dielectric constant values, but the
runs stopped without completion owing to the molecular
size of 3 and 4. However, solvent calculations on smaller
models of 3 and 4 lacking the D ring could be performed and
confirmed the preference for conformers such as 3A and 4A.
NMR chemical shifts were calculated at the Hartree–Fock
and density functional levels with the 6–31G(d) or the
6–31G(d,p) basis sets using the GIAO method. All the 1 H
and 13 C chemical shifts are referenced to those of TMS.
The absolute 1 H and 13 C shielding of TMS, based on the
B3LYP/6–31G(d) optimized geometry, were calculated at
the same level/basis set used in the calculation to which they
refer.
Acknowledgments
This work was financially supported by the Universit`a degli Studi
di Milano and Universit`a degli Studi di Pavia.
REFERENCES
1. Tax L, Goorissen EM, Kicovic PM. Maturitas 1987; 1(Suppl): 3.
2. (a) Markievicz L, Gurpide E. J. Steroid Biochem. 1990; 35: 535;
(b) Kloosterboer HJ. J. Steroid Biochem. Mol. Biol. 2001; 76: 231.
3. Chetrite G, Kloosterboer HJ, Pasqualini JR. Anticancer Res. 1997;
17(1A): 135.
Copyright 2002 John Wiley & Sons, Ltd.
4. Pasqualini JR, Paris J, Sitruk-Ware R, Chetrite G, Botella J. J.
Steroid Biochem. Mol. Biol. 1998; 65: 225.
5. Chetrite GS, Kloosterboer HJ, Philippe JC, Pasqualini JR.
Anticancer Res. 1999; 19(1A): 261.
6. Chetrite GS, Kloosterboer HJ, Philippe JC, Pasqualini JR.
Anticancer Res. 1999; 19(1A): 269.
7. Gompel A, Siromachkova M, Lombert A, Kloosterboer HJ,
Rostene W. Eur. J. Cancer 2000; 36(Suppl 4): S76.
8. Mitsunobu O. Synthesis 1981; 1.
9. Palmer KH, Ross FT, Rhodes LS, Baggett B, Wall ME. J. Pharmacol.
Exp. Ther. 1969; 167: 207.
10. Palmer KH, Cook CE, Ross FT, Dolar J, Twine ME, Wall ME.
Steroids 1969; 14: 55.
11. (a) Lee C, Yang W, Parr RG. Phys. Rev. B 1988; 37: 785;
(b) Becke AD. J. Chem. Phys. 1993; 98: 5648.
12. Frisch MJ, Trucks GW, Schlegel HB, Scuseria GE, Robb MA,
Cheeseman JR, Zakrzewski VG, Montgomery JA Jr, Stratmann
RE, Burant JC, Dapprich S, Millam JM, Daniels AD, Kudin KN,
Strain MC, Farkas O, Tomasi J, Barone V, Cossi M, Cammi
R, Mennucci B, Pomelli C, Adamo C, Clifford S, Ochterski J,
Petersson GA, Ayala PY, Cui Q, Morokuma K, Malick DK,
Rabuck AD, Raghavachari K, Foresman JB, Cioslowski J, Ortiz
JV, Baboul AG, Stefanov BB, Liu G, Liashenko A, Piskorz P,
Komaromi I, Gomperts R, Martin RL, Fox DJ, Keith T, Al-Laham
MA, Peng CY, Nanayakkara A, Challacombe M, Gill PMW,
Johnson B, Chen W, Wong MW, Andres JL, Gonzalez C, HeadGordon M, Replogle ES, Pople JA. Gaussian 98, Revision A.9.
Gaussian Inc.: Pittsburgh, PA, 1998.
13. Haasnoot CAG, de Leeuw FAAM, Altona C. Tetrahedron 1980;
36: 2783.
14. (a) Wolinski K, Hilton JF, Pulay P. J. Am. Chem. Soc. 1990; 112:
8251; (b) Ditchfield R. Mol. Phys. 1974; 27: 789.
15. Cheeseman JR, Trucks GW, Keith TA, Frisch MJ. J. Chem. Phys.
1996; 104: 5497.
16. (a) Eloranta J, Hu J, Suontamo R, Kolehmainen E, Knuutinen J.
Magn. Reson. Chem. 2000; 38: 987; (b) Casanovas J, Namba AM,
Leon
´ S, Aquino GLB, da Silva GVJ, Alem´an C. J. Org. Chem. 2001;
66: 3775; (c) Kupka T, Pastema G, Jaworska M, Karali A, Dais P.
Magn. Reson. Chem. 2000; 38: 149; (d) Smith WB. Magn. Reson.
Chem. 1999; 37: 103.
17. Perdew JP, Wang Y. Phys. Rev. B 1992; 45: 13 244.
18. De Jongh HP, van Vliet NP. US Patent 3340279, Organon, 1967.
19. Barone V, Cossi M. J. Phys. Chem. A 1998; 102: 1995.
Magn. Reson. Chem. 2002; 40: 581–588