designing business information systems apps websites and more
Bạn đang xem bản rút gọn của tài liệu. Xem và tải ngay bản đầy đủ của tài liệu tại đây (25.22 MB, 318 trang )
Designing Business
Information Systems
Apps, Websites, and More v. 1.0
This is the book Designing Business Information Systems: Apps, Websites, and More (v. 1.0).
This book is licensed under a Creative Commons by-nc-sa 3.0 ( />3.0/) license. See the license for more details, but that basically means you can share this book as long as you
credit the author (but see below), don't make money from it, and do make it available to everyone else under the
same terms.
This book was accessible as of December 29, 2012, and it was downloaded then by Andy Schmitz
() in an effort to preserve the availability of this book.
Normally, the author and publisher would be credited here. However, the publisher has asked for the customary
Creative Commons attribution to the original publisher, authors, title, and book URI to be removed. Additionally,
per the publisher's request, their name has been removed in some passages. More information is available on this
project's attribution page ( />For more information on the source of this book, or why it is available for free, please see the project's home page
( You can browse or download additional books there.
ii
Table of Contents
About the Authors................................................................................................................. 1
Acknowledgements............................................................................................................... 3
Dedication............................................................................................................................... 4
Preface..................................................................................................................................... 5
Chapter 1: Information Systems in Your Life: Types of Systems and Careers ...... 11
What Are Information Systems? ................................................................................................................ 12
Designing Information Systems ................................................................................................................. 18
The Big Picture ............................................................................................................................................. 23
Chapter 2: Information Systems to Enhance Business: Business Process
Redesign................................................................................................................................ 26
What Is a Business Process? ........................................................................................................................ 27
Diagramming a Business Process ............................................................................................................... 33
Chapter 3: Professionalism in Deliverables: Principles of Graphic Design ............ 40
C.R.A.P. Principles of Graphic Design ........................................................................................................ 41
Chapter 4: User Centered Design: Design an iPhone App .......................................... 65
MIS and Marketing ...................................................................................................................................... 66
Laws of Branding.......................................................................................................................................... 73
Icon Design ................................................................................................................................................... 76
Plan and Design Your App........................................................................................................................... 79
Chapter 5: Planning Usable Websites: Design a Website to Market the App ......... 92
Top Ten Guidelines for Site Usability ........................................................................................................ 93
Chapter 6: Build, Buy, or Reuse Solutions: Develop a Website to Market the
App ....................................................................................................................................... 104
Development Considerations.................................................................................................................... 105
Google Sites................................................................................................................................................. 112
Database Integration ................................................................................................................................. 119
Chapter 7: Knowledge with Information Systems: Forecast Revenues and
Expenses for the App........................................................................................................ 126
Development Options and Costs............................................................................................................... 127
Spreadsheets to Estimate Costs ................................................................................................................ 135
iii
Chapter 8: Decision Support: Determine Feasibility of a Business Loan for the
App ....................................................................................................................................... 148
Calculate the Terms of a Loan................................................................................................................... 149
Chapter 9: Industry Analysis: Smartphone Apps ....................................................... 161
Big Picture: Industry Analysis .................................................................................................................. 162
Representing Industry Information Using Graphs................................................................................. 167
Chapter 10: Business Intelligence: Analysis of App Sales Data............................... 182
Business Intelligence ................................................................................................................................. 183
Databases .................................................................................................................................................... 190
Chapter 11: Writing the Business Case: Design a Report for the App ................... 201
Pros and Cons of PowerPoint.................................................................................................................... 202
Schematic Report ....................................................................................................................................... 213
Template for the Report............................................................................................................................ 218
Chapter 12: Presenting the Business Case: Design a Presentation for the App .. 224
Designing Presentations............................................................................................................................ 225
Chapter 13: Establishing Credentials: Networking and Placement ....................... 242
Cover Letters, Resumes, Interviews ......................................................................................................... 243
Chapter 14: Microsoft PowerPoint Techniques .......................................................... 260
Chapter 15: Cloud Computing Techniques .................................................................. 271
Dropbox....................................................................................................................................................... 272
Chapter 16: Microsoft Excel Techniques...................................................................... 286
Chapter 17: Microsoft Access Techniques ................................................................... 299
Chapter 18: Microsoft Word Techniques ..................................................................... 304
Appendix A: Fonts ............................................................................................................. 310
Additional Font Categories ....................................................................................................................... 311
Combining Fonts and Effects .................................................................................................................... 312
Font Categories in Detail ........................................................................................................................... 313
iv
About the Authors
Raymond D. Frost
Raymond D. Frost is a Professor of Management
Information Systems department at Ohio University. He
is also the Director of Studies for College of Business
students in the Honors Tutorial College (HTC). Frost
joined the College of Business in 1999. His primary
research areas are instructional pedagogy, information
design, and database design. He was named 2010
Computer Educator of the Year by the International
Association for Computer Information Systems. He has
also received multiple teaching awards at both the
College and University level and holds the title of
O’Bleness Teaching Chair. Frost earned a doctorate in
business administration and an M.S. in computer science at the University of Miami
(Florida), and received his B.A. in philosophy at Swarthmore College. He lives in
Athens, Ohio with his wife, Tere, and two boys, Raymond and Luke.
Jacqueline C. Pike
Jacqueline C. Pike is an Assistant Professor of
Information Systems Management in the PalumboDonahue School of Business at Duquesne University. She
earned her B.B.A. from the Honors Tutorial College and
College of Business at Ohio University and her Ph.D.
from the Katz Graduate School of Business at the
University of Pittsburgh. Her research interests include
behavior in public online communities and social
computing environments, the utilization of public
online communities by organizations, human-computer
interaction, and the visual display of information in a
systems context.
1
About the Authors
Lauren N. Kenyo
Lauren N. Kenyo is an instructor in the Management
Information Systems at Ohio University. After
graduating from Ohio University’s College of Business
she went on to graduate from Ohio’s Masters of Business
Administration Program. In 2004 Kenyo came back to
join the faculty as in instructor in the Management
Information Systems department. Kenyo currently
resides in Streetsboro, Ohio with her husband, Eugene,
and daughter, Katelyn.
Sarah E. Pels
Sarah E. Pels is an Honors Tutorial College student in
the College of Business at Ohio University. Her research
interests include creating diagrams to aid in software
instruction.
2
Acknowledgements
Faculty Contributions
We are blessed to work with colleagues that value teaching and are truly concerned
with the welfare of our students. A number of our colleagues have made excellent
suggestions and contributions to the course. We give special thanks to Hao Lou, Vic
Matta, Scott Wright, Justin Davis, Corrine Brown, Hala Annabi, Mike Martel, Sean
McGann, Wayne Huang, Tod Brokaw, Ken Hartung, Jane Sojka, David Kirch, Susie
Freeland, David Payne, Mira Straska, Dave Matthews, Craig Evans, Wanda Weinberg,
Monica Cueto, and Nancy Matolak.
We give special thanks to Jeff Shelstad and Pam Hersperger of Unnamed Publisher
who believed in our vision and shepherded us through this process. We would also
like to thank Alisa Alering, Brad Felix, and the many other employees at Unnamed
Publisher that helped improve the text.
We would also like to thank members of the business community who reviewed
and/or made contributions to the text. In particular we thank Eugene Kenyo, IT
College Recruiter for Progressive Insurance, Tom Starr of Tom Starr Live, and Ralph
Riedel, Management Consultant, for their helpful suggestions.
Student Contributions
We believe that Ohio University students are second to none. They work hard, play
hard, and have good values. Our students are genuinely grateful for the effort we
put into this course.
A few of them have helped critique, edit and proofread this text. We are happy to
say that they are not shy about voicing their opinions. Their contributions have
been invaluable. In particular, Tucker Barlow and Chelsea Smith (diagrams),
Julianne Shasteen (editing), Kaitlin Bolling (design), John Letsky (business
intelligence), and Alex Minrisky (typesetting).
3
Dedication
To Isabel Maria Teresa Frost
It is as if heaven had a special band of angels, whose office it was to sojourn for a
season here, and endear to them the wayward human heart, that they might bear it
upward with them in their homeward flight. When you see that deep, spiritual light
in the eye… hope not to retain that child; for the seal of heaven is on it, and the
light of immortality looks out from its eyes.
—Harriet Beecher Stowe
4
Preface
Book Design Problem
We set out to design an introductory course governed by four themes:
1. Give students a good idea of what a career in MIS looks like by doing
MIS.
2. Enhance the professionalism of deliverables by teaching design and
usability concepts.
3. Promote creativity by assigning projects that demand it.
4. Teach students about cloud computing by having them do cloud
computing.
Students in an introductory Management Information Systems (MIS) course often
ask what a career in MIS looks like. Lacking a clear vision, they make their own
assumptions. Often they assume the career involves programming with little
human interaction. That MIS is a technical field could not be further from the truth.
MIS job descriptions typically require candidates to be able to collaborate,
communicate, analyze needs and gather requirements. They also list the need for
excellent written and communication skills. In other words, MIS workers are
constantly interacting with other people both inside and outside the organization.
They are coming up with creative solutions to business problems.
This course is designed to help students get a feel for what a career in MIS would be
like. Our students report that they learn more about information systems from
their internships than from their IS courses. Consequently, we designed a course
that looks very much like an internship—an introduction to the field followed by a
substantial project.
Chapter 1 begins by introducing the information systems landscape. Here we
discuss all the usual suspects: the information systems triangle, the systems
development life cycle, transaction systems (ERP, SCM, CRM), collaboration
systems, and business intelligence systems. Other aspects of the landscape such as
usability, outsourcing, database concepts and so forth are introduced throughout
chapter in Chapter 2 where they fit in naturally with the flow of the project.
Chapter 2 is the substantial project which runs over a number of chapters. Over the
course of the semester, students plan, build, and develop a proposal for an iPhone
5
Preface
application. They develop a very realistic mockup. They also build a website to help
market and support the app. Students are engaged because the project is fun and
feels real. However, they are simultaneously learning business concepts and MIS
skills. Prior to the existence of this course, we were only able to give such an
interesting project at the senior level. Now, even as freshmen, students have a real
experience of MIS in operation.
A by product of creating an engaging course is increased enrollment in the MIS
major. Even students who have never heard of MIS become excited about the major
and either switch majors or add it as a double major or minor.
Many other books have students study tools and then do a case. By contrast, most of
this book is a case. Much like the real world, we introduce tools when needed, and
only to the extent needed, to get at each part of the case.
Constraints
The design team embraced a number of constraints in creating the book. We
acknowledged that this is a support course in terms of skills development for the
other business disciplines—accounting, finance, management, and marketing.
Students should walk away with skills that they can take into the other disciplines.
The course requires mastery of a number of software skills—primarily from the
Microsoft Office suite. These include skills in PowerPoint, Word, and Excel. We
assumed no prior background knowledge on the part of the students. Our
experience is that students entering college have exposure to software skills, but
not a mastery of applying those skills to solve business problems.
A number of skills are also learned about cloud computing. These include Web site
design and development (Google Sites, Google Gadgets, Google Docs), Color
Management (Adobe Kuler Color), iPhone App mockups (MockApp), and online polls
(PollEverywhere).
The book was designed for both in class and online delivery and for small and large
section sizes. The non-traditional student population is a growing sector and many
of those students choose to learn online.
Finally, the book needed to appeal to the business side of information systems. We
accentuate the creative aspects of the field rather than casting MIS as an overly
technical, nerdy, machine-oriented discipline.
6
Preface
Values, attitude, approach
We began with the assumption that MIS is an exciting discipline. Nonetheless we
recognized the difficulty of conveying that excitement—especially in a skills book.
However, difficult does not mean impossible—and we believe we have created an
elegant solution. We hold that learning can be both challenging and fun. Research
clearly shows that students want to be challenged in meaningful ways. Finally, we
assumed that students recognize and want to emulate good graphic and
information design. This is an image-conscious generation with a keen eye for what
looks cool. Why not build a book that capitalizes on the eye for graphic design that
students already bring to the table?
Book Design Influences
While our background is in MIS, we believe that one of the strengths of the book is
its ability to look outside the field for inspiration. We were influenced by a number
of writers in the development of the book.
Edward Tufte (The Visual Display of Quantitative Information) is perhaps the
world’s leading expert on the design and display of quantitative information. Tufte
begins by insisting we focus first on the quality, relevance, and integrity of the
content. He has an especially sensitive eye for the ethical dimension—telling the
truth in an information display. Good content is followed by the creation of a good
design to communicate that content.
Robin Williams (The Non-Designers Design Book) gives simple but effective design
rules that can be applied to document design, presentation design, website design,
even spreadsheet design. Following these rules students are able to create
professional displays of information.
Students will use PowerPoint both in college and the workplace. Why not learn to
use it effectively? Two writers were especially helpful in this regard. Both are
pioneers in the effective construction of PowerPoint presentations. Garr Reynolds
(Presentation Zen) promotes a heavy use of images in PowerPoint. Nancy Duarte
(Slide:ology), provides a comprehensive list of design guidelines.
Organizing framework for the Book
Our organizing framework for the book revolves around the importance of design.
We want students to be creative, design like professionals, and take pride in their
7
Preface
work. We challenge students to produce deliverables that are professional in both
content and style.
Problems must be thoroughly analyzed before a proper solution is designed.
Information is a core asset, not only in information systems, but to most
organizations. It is safe to say that most students will regularly be creating
information displays as part of their jobs following graduation. Why not get a
competitive advantage by learning how to create them in a professional and
effective fashion? We include sections on graphic design—a subject that students
find to be very interesting and marketable.
The importance of design lead us to adopt the Systems Development Life Cycle for
the assignments. In this way, students are asked to be intentional about their design
choices, relating them back to the requirements that they uncovered earlier in the
project.
Book Guiding Principles
We developed a number of guiding principles in the creation of the book. We began
with creative, right brain problems. The business curriculum is so heavily focused
on analysis that there is little room for creative expression. We have students
design and draw with the software to remedy this problem. For example, students
design an iPhone App in PowerPoint and simulate its operation with hyperlinks.
We want to support and model critical thinking. There are many definitions of
critical thinking and we do not claim to have the most comprehensive one.
However, we believe that the explanatory framework offered by Richard Paul is
especially powerful. Paul encourages faculty to communicate concepts in four
forms—definitions, rephrasing, written examples and illustrations. The hope is that
one or more of the forms will stick and mutually reinforce each other in the
student’s mind. Students frequently comment that they see the value in what they
are learning and are able to apply it not only in their other classes, but also in real
life.
Finally, we think that the book should support multiple learning styles. We use Neil
Fleming’s taxonomy of learning styles: Visual, Auditory, Read/write, and
Kinesthetic (VARK). Different students learn differently; this book contains
something for everyone.
8
Preface
Architecture of the Book
We align the architecture of the book with our guiding principles. For example, all
the book’s concepts and software skills are presented in a critical thinking format.
Each concept is defined, rephrased “in other words,” bolstered by an example, and
then illustrated. For software skills we repeat the same pattern in a different
format. We construct a captioned screen shot. The caption contains the first three
forms—definition, rephrasing, and written example. The screenshot contains the
illustration. A great deal of work went into the digital manipulation of the
screenshots to support our pedagogy. The actions are expressed with a near
wordless lexicon. Symbols in the lexicon have an Anime or Comic Book feel in order
to create a counterpoint and stand out from the screen shot. And frankly the Anime
feel is just fun. To accommodate online learners the skills are also modeled through
video lectures.
Problems in the book progress from challenging students to imitate best practice to
creative application of the concepts. So many times we have seen assignments
where students are asked to do either too little and thus the students get little value
or the students are challenged but not given the proper ramp up. Our leveled
approach is a good meeting in the middle—challenge with support.
Since we set the bar so high for the professional quality of deliverables, we had to
provide a way for students to meet that standard. What we developed is a
progressively challenging pedagogy. By accomplishing the Level 1 and 2 hurdles,
students prepare themselves for a comprehensive Level 3 project.
Introduction: Each chapter begins with an introduction to outline the chapter. The
introduction also sells the practical value of the chapter to the student’s future
career. Selling the chapter achieves buy in and creates motivation to succeed.
Establishing the practical value of the chapter also lets students know that we care
about their future.
Following the introduction, we present the theory behind the chapter. The theory is
carefully introduced to scaffold on prior knowledge while extending that
knowledge much further. We cover best practice in industry and illustrate it using
good and bad examples.
L1, L2, L3 Creative Application: The Level 1 and Level 2 assignments incorporate
analysis and requirements stages. The Level 3 assignments focus on design.
Students must analyze the problem, gather requirements, design a solution, and
9
Preface
develop the solution. Students are encouraged to exercise creativity both in their
deliverable and in their written support for the deliverable.
Diagrams: We show abbreviated techniques to accomplish each of the tasks
required in the assignment. Furthermore, the techniques are shown in no particular
order. Students need to discover what they need to accomplish and then look up
the techniques that will help to get them there. Over the years, we have learned
that students can learn a technique very quickly, but this is not what they truly
need to understand. They need to know when to apply the technique, and this
pedagogy focuses on developing that intuition.
Sometimes, we show before and after examples of the required deliverable.
Students are challenged to transform the before into the after using the techniques.
We expressly avoid the step by step exercises found in many other texts. Our
experience is that students will focus on keystrokes rather than concepts when
presented with step by step instructions.
Our model is closer to just in time learning found in many MBA programs. It is also
a model for life-long learning, rather than learning specific software tools.
Conclusion
We have learned a lot over five years developing this book, and continue to learn
every day as we move forward. We would like to thank our students who have
helped guide us with their feedback. We will continue to make improvements to a
project that will never be entirely finished. However, this much we
know—enrollment has dramatically increased in our department (400%).
10
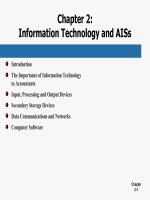
Chapter 1
Information Systems in Your Life: Types of Systems and Careers
11
Chapter 1 Information Systems in Your Life: Types of Systems and Careers
1.1 What Are Information Systems?
LEARNING OBJECTIVES
1. Understand the parts of an information system
2. Identify companies that practice user centered design
3. Identify typical careers for information systems graduates
It’s More Than Just Computers
Information systems1 are the combination of people, information technology, and
business processes to accomplish a business objective.
Every information system (IS) has people, processes, and information technology. In
fact, many IS professionals add most of their value working with people and
processes. They manage the programmers but typically avoid programming
themselves. We can represent an information system as a triangle with people,
processes, and information technology (computers) on the three vertices. The three
parts of an information system are often referred to as the information systems
triangle2.
Consider the popular trend of letting the TV audience vote on some talent shows
such as Dancing with the Stars. The voting is managed by a sophisticated
information system. The voters are the people involved with the system. Voters can
cast the votes by phone, by text, or by online poll—three different information
technologies. A central server at ABC records and tallies the votes. The business
processes include the phone, texting, and online procedures—how and when to cast
votes, and rules limiting the number of votes from each household.
1. The combination of people,
information technology, and
business processes to
accomplish a business
objective.
2. Every information systems
consists of people, business
processes, and information
technology.
In November 2010, ABC had to defend the legitimacy of its business processes when
detractors claimed that Bristol Palin, daughter of political candidate, Sarah Palin,
received an inflated vote tally from Tea Party supporters. Some of these supporters
bragged on blogs about how they had circumvented the ABC business processes to
record multiple votes for Bristol. ABC claims that it has systems in place to spot and
discount suspicious voting activity. They have publicly revealed some, but not all, of
these fraud detection systems. At this point we don’t know for sure if fraudulent
votes got through. For more on this story see for example: />2010/11/19/dwts-bristol-palin-tea-party-voting-conspiracy/.
12
Chapter 1 Information Systems in Your Life: Types of Systems and Careers
The three parts of the information systems triangle must interact in concert to realize business objectives. The job of
the IS professional is to ensure that a balance is maintained and enhanced for the good of all the actors and the
business as a whole.
Good and Bad Information Systems
Information systems professionals work with others to design and customize the
systems that you interact with everyday. When you register at a hospital, the
information goes into an information system designed to support administrative
reporting and insurance processing. When you buy from Amazon.com, the
information goes into an information system designed to support customer
relationship management.
Every information system is designed to make someone’s life easier. Unfortunately,
that someone is not always the consumer. When was the last time that you had a
good registration experience at a hospital? That system probably was not designed
with you in mind—but rather designed to support backend reporting for the
hospital administration and by proxy for the government and insurance companies.
So the administrators are happy, but not the customers. From the hospital’s point
of view there is no business need to make the registration experience
1.1 What Are Information Systems?
13
Chapter 1 Information Systems in Your Life: Types of Systems and Careers
extraordinarily pleasant. They are betting that you will not choose your hospital
based on how difficult it was to register.
Amazon.com, by contrast, delivers an extraordinary experience to its customers so
that they will stay loyal. Amazon practices user centered design3—designing to
meet the needs of the user. However, the clever folks at Amazon also have
tremendous backend reporting. So it is possible to design systems that please
customers and administrators simultaneously—but it takes a bit more effort.
What would hospital systems look like if they were designed to Amazon standards?
Imagine 1-click appointments, 1-click payments, shielding the client from the
insurance companies. How about an integrated patient record of all past
procedures?
The world will continue to gravitate toward Amazon style systems. In the end it is
good business to make everyone happy—employees, customers, and administrators.
It is also the right thing to do. Think back to the hospital. In a competitive market,
maybe you would choose the better customer experience. A hospital worker might
choose to work for the hospital with the more user friendly patient information
system. No one likes to be yelled at by unhappy customers.
It doesn’t take much to improve the user experience (UX) of a system. You have to
design a user interface (UI) anyway—why not make it a good one? In the words of
Hall of Fame basketball coach John Wooden, “If you don’t have time to do it right,
when will you have time to do it again?”
Consider the tremendous success of Apple Computer. One of the main advantages
that Apple has over its rivals is that it carefully analyzes how people best interact
with technology, develops requirements based on that analysis and then designs
elegant computers, the iPhone, iPad, iTunes, and so forth based on those
requirements.
3. Designing websites and
applications to meet the needs
of the user. While this may
seem to be common sense, in
practice it does not often
happen—especially in internal
corporate settings. How user
centered are the systems at
your college or university?
1.1 What Are Information Systems?
14
Chapter 1 Information Systems in Your Life: Types of Systems and Careers
Google Health, pictured here, has created a user centered patient record—and for free! It will be interesting to see if
hospitals adopt it.
Most Professions Use Information Systems
Marketing, accounting, finance, manufacturing – there are many different
professional goals and types of work in the business world. There are also many
different industries where this work can be performed – manufacturing, retail,
banking, healthcare. No matter what your career goal is or what industry interests
you, your success and the success of the business rely on your ability to recognize
opportunities where information systems can be used to improve performance. In
most lines of work, you will need to store information in and retrieve information
from databases. You will have to create persuasive and professional reports and
presentations to convince others that your ideas make sense. Using Microsoft Excel
and other tools, you will analyze data to find patterns and trends to aid decisionmaking. You will manage your relationships with contacts and clients using
customer relationship management systems. The business’s success will depend on
you leading efforts that use technology to support the introduction of new
products, efficiently manage supply chains, and effectively manage complex
financial activities. Retailers rely on past purchase data to develop sales forecasts
and predict purchase behavior. Most businesses utilize collaboration technologies
to bring together employees from all over the world to solve problems. Your ability
to recognize opportunities to use information technology to create business value is
central to both your success and that of your firm.
What Does an IS Career Look Like?
A career in information systems is full of action, problem-solving, and teamwork. It
is the goal of information systems professionals to bridge the knowledge gap
1.1 What Are Information Systems?
15
Chapter 1 Information Systems in Your Life: Types of Systems and Careers
between business users and technologists, and thus IS professionals must be fluent
in both worlds. Work in the field of information systems is exciting, fun, and fastpaced. There is always a new team to work with and new technology to learn about,
and projects move quickly leaving openings for new endeavors. In a recent report
published in The Wall Street Journal, information systems professionals were tied
for the highest percentage of college graduates that were satisfied with their career
path. See />When preparing to become an IS professional, students focus on learning about the
types of systems that exist, what they offer to businesses, best practices for
implementation, and the advantages and disadvantages of each. Students also focus
on how to work with business users and discover what their system needs are and
how they can best be served by information systems. Information systems
professionals focus on solving problems in businesses through the use of
information systems.
When students start their careers, they frequently work on teams that connect
businesspersons with the appropriate system solution for their situation. Usually
the organizations they work for adopt a set of best practices to create consistency
across project teams. Through the use of these best practices, IS professionals
determine what options are available, consider the pros and cons of each, design a
customized solution to match the specific business, and develop a plan on how to
best implement the information system, including rollout phases and training.
As mentioned, IS professionals typically work in teams. This is because the projects
are usually very large and have many interworking pieces. As a result, IS
professionals specialize in a particular type of work and contribute their expertise
in this area. Specializations include system analysts, software developers, database
administrators, and project managers.
Information systems as a career is attractive to many individuals because of the
traits above. However, it is also engaging because it is a career in which you get to
work on making people’s lives easier. IS professionals focus on developing systems
that businesspersons will use to create efficiency and increase their performance. IS
professionals design systems that help businesspersons make better decisions
(decision support systems) and lead organizations (executive dashboards). Systems
are also created to keep track of materials (supply chain management systems) and
customers (customer relationship management systems). And given the important
role of information in modern organizations, IS professionals record, monitor, and
analyze data to learn how the business can improve (business intelligence systems).
IS professionals work to design these systems to be more usable, more efficient, and
1.1 What Are Information Systems?
16
Chapter 1 Information Systems in Your Life: Types of Systems and Careers
more informative. This book will discuss these topics and allow you to experience
many of them. It walks you through what it is like to be an IS professional, rather
than telling you about it.
KEY TAKEAWAYS
• The information systems triangle includes people, processes, and
information technology. It is a good reminder that MIS is about much
more than just technology.
• Well designed information systems keep the user in mind at each step of
the process.
• Information systems are used by every functional area of
business—marketing, management, finance, and accounting. For this
reason it is good to have a strong background in information systems.
• Careers in information systems tend to be dynamic, team based, and
focused on problem solving.
• Few information systems careers involve programming. However, IS
professionals must be able to communicate with programmers.
QUESTIONS AND EXERCISES
1. Search for news stories on the Bristol Palin vote controversy. What
systems did ABC put in place to catch voter fraud?
2. Pick a user centered web site other than Amazon.com and explain why
you think it is well designed.
3. Find job descriptions for two information systems jobs. Do the job
descriptions emphasize soft skills or technical skills or both?
1.1 What Are Information Systems?
17
Chapter 1 Information Systems in Your Life: Types of Systems and Careers
1.2 Designing Information Systems
LEARNING OBJECTIVES
1. Compare and contrast usability, graphic design and analytical design.
2. Outline the steps by which an information system should be designed.
Many Meanings of Design
The key to successful information systems is good design. But what makes a good
design? A number of disciplines weigh in on this topic. We will look at design from a
number of different perspectives. Whenever possible we will contrast good and bad
designs.
Different people use the word design in different contexts. When IS professionals
speak of design, they are referring to business processes. Problems must be
analyzed and requirements documented before solutions are designed, developed,
and implemented. After all if the design does not satisfy the business need, then
what’s the point? However, satisfying the business need is really a baseline
standard. The vilified hospital system described earlier meets the business need of
registering patients. And yet its design is in other ways lacking. Similarly, fast food
meets the need for feeding one’s hunger. However, we want to be metaphorically
better than fast food in our designs.
Usability4 describes how easy the system is to navigate. The easier the system is to
navigate, the less time a user will need to spend learning to use the system. A more
usable system also leaves less room for error. Usability theory provides rules of
thumb (heuristics) that document best practice conventions for designing a user
interface. Amazon.com has one of the most usable online systems because they
follow established conventions. Following conventions tremendously increases the
potential acceptance of your website or app.
4. Describes how easy the system
is to use and
navigate—especially for novice
users.
5. Describes the visual appeal and
organization of the user
interface.
Graphic design5 refers to the visual appeal and organization of the user interface.
There is obviously some overlap here with usability. Usable systems typically
adhere to at least some graphic design rules. However, a usable system could be
bland and uninteresting. Employing graphic design principles helps ensure that the
system will have visual appeal. Designs also need to fit with the overall brand of the
client. Existing colors, fonts, and logos are all a part of the brand for which the
system is being created.
18
Chapter 1 Information Systems in Your Life: Types of Systems and Careers
Analytical Design6 describes how to best represent information—especially
quantitative information—to communicate clearly and truthfully. Every
information systems project has quantitative dimensions associated with project
management. These include estimating costs, time schedules, and so forth.
The convergence of usability, graphic design, and analytical design on Yahoo Finance. This graph shows the three
month stock price for Amazon vs. Google. From a usability standpoint it could not be easier to request the graph.
Type the company name and it suggests the stock ticker symbol. Also, as you move your cursor (the hand), the black
dot on the line moves as well, and the numbers on the top left update to display values for the date you are passing
over—very slick! The graphic design is excellent—muting the underlying grid so that the data stands out by
contrast. The analytical design is also first rate. Hundreds of data points are effortlessly represented. We see the
trading volume on each day. At the bottom, the stock price is placed in context over a multi year period. In sum, we
have a tremendous amount of information beautifully represented without clutter. Think about this the next time
you see an impoverished PowerPoint graph with four bars representing four data points.
6. Describes how best to
represent
information—especially
quantitative information—so
that it communicates clearly
and truthfully.
1.2 Designing Information Systems
19
Chapter 1 Information Systems in Your Life: Types of Systems and Careers
Systems Development Life Cycle (SDLC)
Information systems are designed using the systems development life cycle
(SDLC)7. The SDLC is to a large extent common sense spelled out in stages. First,
analyze the current situation. Then specify the requirements that a solution should
embody. The next stage is to design a solution (no programming yet). Then the
system is developed (programmed) and tested. Finally, the system goes live for the
end users as it is implemented in the business setting. To review, the five phases
are:
1.
2.
3.
4.
5.
7. A method for designing
information systems. The life
cycle proceeds through the
following stages: an analysis of
the current state, development
of requirements, design of a
solution, development from
the design and finally to
implementation or roll out of
the solution.
Analysis
Requirements (vision of future state)
Design
Development
Implementation
In this course we will cover all five stages. However we will focus most heavily on
the first three stages for two reasons. First, because that is where IS professionals
tend to spend most of their time and second because it is much easier to make
changes to a system when in the planning stages, than after code has already been
generated.
1.2 Designing Information Systems
20
Chapter 1 Information Systems in Your Life: Types of Systems and Careers
It is good to frequently interact with the end user and show them screen mockups8
and a systems architecture diagram9 of what the final system will look like. The
systems architecture is a hierarchy diagram of the flow of the website or app—what
the relationship between the pages of the system will be. It is sometimes called a
site map. Ideally the systems architecture is done on paper with sticky notes that
can be moved around at will by multiple users. A final systems architecture can be
represented as a hierarchy chart in PowerPoint.
Once the systems architecture is complete, wireframes10 or mockups of the
individual pages may be constructed. Mockups are non-functioning pages
generated in a drawing program such as PhotoShop, Omnigraffle (Mac), or even
PowerPoint. PowerPoint turns out to be a fairly respectable mockup tool—especially
when working off of some predefined templates.
8. Non-functioning pages of a
website or app that are
generated in a drawing
program such as Photoshop,
Omnigraffle, or even
PowerPoint.
The SDLC in action. By analogy think of home improvement shows on TV. such as Curb Appeal. They typically follow
a similar life cycle when improving a home. The current state of the home is analyzed in consultation with the
resident. During this stage the residents reveal their requirements for a solution. For example, they might want a
way to interact more with the neighbors. Next the designer produces a plan to meet those requirements. For
example, a French door in the living room leading to a front deck from which to interact with the neighbors.
Actually blowing a hole through the wall and installing a deck is the development stage. If the design is good and
workmanship good, the owner is normally delighted with the solution. At least they seem to be on TV. The
illustration below helps to tease out some of the equivalencies.
9. A diagram that shows the
organization of a website or
app. A systems architecture
diagram is sometimes also
called a site map.
10. A sketch of what the website or
app page will look like. A
wireframe has less detail filled
in than a mockup.
1.2 Designing Information Systems
21