A label free colorimetric sensor based on silver nanoparticles directed to hydrogen peroxide and glucose
Bạn đang xem bản rút gọn của tài liệu. Xem và tải ngay bản đầy đủ của tài liệu tại đây (1.33 MB, 10 trang )
Arabian Journal of Chemistry (2018) 11, 1134–1143
King Saud University
Arabian Journal of Chemistry
www.ksu.edu.sa
www.sciencedirect.com
ORIGINAL ARTICLE
A label-free colorimetric sensor based on silver
nanoparticles directed to hydrogen peroxide and
glucose
Nghia Duc Nguyen a, Tuan Van Nguyen a, Anh Duc Chu a, Hoang Vinh Tran a,*,
Luyen Thi Tran a, Chinh Dang Huynh a
a
Department of Inorganic Chemistry, School of Chemical Engineering, Hanoi University of Science and Technology (HUST),
1st Dai Co Viet Road, Hanoi, Viet Nam
Received 7 November 2017; accepted 31 December 2017
Available online 7 January 2018
KEYWORDS
Graphene quantum dots;
Silver nanoparticles;
Hydrogen peroxide (H2O2),
Glucose detection;
Human urine;
Colorimetric sensor
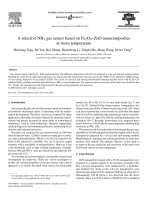
Abstract A simple method has been developed for preparation of silver nanoparticles (AgNPs)
based on the use of graphene quantum dots (GQDs) as a reducing agent and a stabilizer. The synthesized nanocomposites consisting of silver nanoparticles and graphene quantum dots (AgNPs/
GQDs) has been characterized by X-ray diffraction (XRD), Transmission Electron Microscopy
(TEM), Ultraviolet–visible spectroscopy (UV–Vis), Fourier-Transform Infrared spectroscopy
(FT-IR), Energy Dispersive X-ray spectroscopy (EDX) and Dynamic Light Scattering (DLS).
Results indicate that monodisperse of AgNPs has been obtained with particles size ca. $ 40 nm
and specific plasmon peak of silver nanoparticles at 425 nm by UV–Vis spectrum. Using AgNPs/
GQDs nanocomposite, we have constructed a colorimetric sensor for hydrogen peroxide (H2O2)
and glucose sensors based on the use of AgNPs/GQDs as both probes: capture probe and signal
probe. The fabricated sensors perform good sensitivity and selectivity with a low detection limit
of 162 nM and 30 lM for H2O2 and glucose sensing, respectively. Moreover, the biosensors have
been successfully applied to detect glucose concentrations in human urine.
Ó 2018 The Authors. Production and hosting by Elsevier B.V. on behalf of King Saud University. This is
an open access article under the CC BY-NC-ND license ( />
1. Introduction
* Corresponding author.
E-mail address: (H.V. Tran).
Peer review under responsibility of King Saud University.
Production and hosting by Elsevier
Diabetes, as well known, is a serious health problem, which
has been declared as a global epidemic by World Health Organization (WHO) owing to its unprecedented growth worldwide
(Jia et al., 2015; Vashist, 2012). The glucose level in blood is
used as a clinical indicator of diabetes (Su et al., 2012;
Baghayeri et al., 2016; Lu et al., 2015; Ensafi et al., 2016;
Gao et al., 2017). However, drawing blood from vein or fingertip causes discomfort and pricking sensation. Compared with
/>1878-5352 Ó 2018 The Authors. Production and hosting by Elsevier B.V. on behalf of King Saud University.
This is an open access article under the CC BY-NC-ND license ( />
A label-free colorimetric sensor based on silver nanoparticles
blood, urine is another informative body fluid as well and
more importantly, it can be obtained noninvasively. The glucose level in urine is also a good indicator for preliminary
screening of patients with high level diabetes or having renal
glycosuria (Jia et al., 2015; Radhakumary and Sreenivasan,
2011). In order to avoid the inconveniences caused by drawing
blood intravenously or by hand pricking, a preliminary screening of the patients with high level diabetes can be done
instantly by checking their urine glucose levels. When the concentration of glucose in urine is more than 500–1000 mg/L
(2.8–5.6 mM), the urine test is positive (Su et al., 2012;
Radhakumary and Sreenivasan, 2011; Fine, 1965; Lankelma
et al., 2012; Urakami et al., 2008; Zhang et al., 2017). Considering its convenience, painlessness, and affordability, urine
glucose monitoring should not be completely given up, especially in low-income regions (Su et al., 2012).
The sensing of glucose is usually based on electrical signal
or color change generated by the specific reaction of active species (e.g., glucose oxidase or phenylboronic acid) with glucose
(Jia et al., 2015). Most glucose sensors have been structured
based on natural enzymes (e.g., horseradish peroxidase
(HRP)). Natural enzymes in organisms are proteins composing
of hundreds of amino acids that can catalyze chemical reactions. It has been widely applied in various fields because of
their high substrate specificity and catalytic efficiency. However, their catalytic activity can be easily affected by environmental conditions such as acidity, temperature and
inhibitors. Furthermore, high costs of preparation, purification and storage also restrict their widespread applications
(Ding et al., 2016; Tran et al., 2018; Zhang et al., 2014; Xing
et al., 2014). In the light of this, exploiting stable enzyme
mimetics is an urgent need. Nowadays, many nanomaterials
with unique peroxidase-like activity have been discovered,
including magnetic nanoparticles and its composite (Ding
et al., 2016; Wei and Wang, 2008; Dong et al., 2012), cerium
oxide nanoparticles (Zhao et al., 2015), silver nanoparticles
(Tran et al., 2018), carbon-based nanomaterials (Wang et al.,
2015; Nirala et al., 2015; Wang et al., 2016); exfoliated Co–
Al layered double hydroxides (Co-Al ELDHs) (Chen et al.,
2013) and manganese selenide nanoparticles (MnSe NPs)
(Qiao et al., 2014). These nanostructured materials as
peroxidase mimetics show unparalleled advantages of low
cost and stability over natural enzymes (Ding et al., 2016).
Among them, carbon-based nanomaterials, such as graphene/
graphene oxide; carbon nanotubes and graphene quantum
dots are the most widely studied enzyme mimics (Shu and
Tang, 2017).
In this work, we synthesized nanocomposites consisting of
silver nanoparticles and graphene quantum dots (AgNPs/
GQDs) by a simple and green method. Using AgNPs/GQDs,
we constructed a directed colorimetric method for the direct
detection of hydrogen peroxide (H2O2). A colorimetric glucose
sensor has been designed and developed based on combining
with glucose oxidase (GOx). The fabricated sensors perform
excellent sensitivity and selectivity for hydrogen peroxide and
glucose sensing. Moreover, the proposed sensor has been successfully applied to detect of glucose concentrations in human
urine samples. Based on the good performances, the proposed
colorimetric glucose sensor becomes a great promising candidate for glucose level sensing as a without blood needing and
needle-free approach.
1135
2. Experimental
2.1. Chemical
Citric acid (C6H8O7ÁH2O); urea ((NH2)2CO); ammonia (NH3)
solution 28%wt.; acetic acid (CH3COOH) solution 99%wt.;
sodium hydroxide (NaOH); silver nitrate (AgNO3); glucose;
ascorbic acid; galactose; fructose; lactose; scructose; hydrogen
peroxide solution 30% (H2O2); phosphate buffered saline
tablets (PBS); and glucose oxidase (GOx) were purchased from
Sigma Aldrich. Human urine samples were collected from a
local hospital.
2.2. Synthesis of graphene quantum dots (GQDs)
3.44 g citric acid and 3.005 g urea were dissolved into 100 mL
distilled (D.I) water. The solution was transferred to an autoclave and heated at 160 °C for 4 h. Then, the mixture was centrifuged at 5000 rpm for 20 min to remove the big carbon
particles. The supernatant containing graphene quantum dots
(GQDs) was collected.
2.3. Synthesis of silver nanoparticles (AgNPs) using GQDs as
reducing reagent and stabilizer
100 mL of GQDs stock solution was diluted by 3 mL of D.I
water. Then 0.1 M NaOH and 1 M CH3COOH solutions were
used to control pH of GQDs solutions from 3 to 11. After that,
20 lL of 0.1 M AgNO3 solution was added into the GQDs
solutions. The mixtures were heated to 90 °C for 3 h to complete reduction of silver cation (Ag+) to silver nanoparticles
(AgNPs) process to form nanocomposites consisting of silver
nanoparticle and graphene quantum dots (AgNPs/GQDs) as
the results. AgNPs/GQDs solutions then were cooled to room
temperature (RT) and stored at 4 °C for use.
2.4. Characterization
UV–Vis spectra were measured using Agilent 8453 UV–Vis
spectrophotometer system with the wavelength in a range of
200–1200 nm. Morphology and crystal structure of nanoparticles were characterized using Transmission Electron Microscopy (TEM: JEM1010 - JEOL). Particles size distribution
was analysed by Dynamic Light Scattering (DLS) on the Nano
Partica SZ-100 (HORIBA Scientific, Japan). XRD pattern of
AgNPs/GQDs was measured using D8 ADVANCE - Bruker.
Chemical composition of samples was determined by JEOL
Scanning Electron Microscope/Energy Dispersive X-ray
(SEM/EDS) JSM-7600F Spectrometer.
2.5. Direct detection of hydrogen peroxide
200 lL of H2O2 solutions with different concentrations was
added into a 1.5 mL eppendorf. Then, 1000 lL of AgNPs/
GQDs solution was added into the eppendorf and the mixture
was stirred by vortex machine. The mixture was then incubated at 40 °C in a water bath for 30 minutes. Then the
UV–Vis spectra of the solutions were recorded. The optical
densities at 425 nm (OD425) of the AgNPs/GQDs solution
before and after addition of various H2O2 quantities were used
1136
N.D. Nguyen et al.
to draw a calibration curve, i.e. DA/A0 vs. [H2O2] the following
equation:
DA
A0 À Ac
ð%Þ ¼
Á 100%
A0
A0
ð1Þ
Here, A0 and AC are OD425 of the AgNPs/GQDs solution
before and after H2O2 addition, respectively.
2.6. Detection of glucose
100 lL of glucose solutions with the different concentrations
(from 0.5 mM to 8 mM) in PBS buffer (pH = 7) were added
into eppendorfs, then after, 100 lL of GOx (2 mg mLÀ1 in
0.001 M PBS solution) solution was added. The solution was
mixed and incubated in a 37 °C water bath for 30 min. Then,
1000 lL of the AgNPs/GQDs solution was added to the above
eppendorfs. Finally, the mixed solutions were incubated in a
40 °C water bath for 30 min and then they were transferred
to cuvettes for UV–Vis absorbance measurement and the optical density at wavelength of 425 nm was recorded. The optical
densities at 425 nm (OD425) of the AgNPs/GQDs solution
before and after addition of various glucose quantities and
GOx were used to draw a calibration curve, i.e. DA/A0 (Eq.
(1)) vs. Cglucose (here, DA = A0 À AC where A0 and AC are
OD425 of the AgNPs/GQDs solution before and after adding
the mixture of glucose and GOx, respectively).
3. Results and discussions
3.1. Characterization of AgNPs/GQDs hybrid
The simple method has been developed for the preparation of
nanocomposites consisting of silver nanoparticles and graphene quantum dots (AgNPs/GQDs). First, the small sized
graphene quantum dots (GQDs) with abundant oxygen containing functional groups have been synthesized by the
hydrothermal method. Then GQDs adsorbed Ag+ ions and
reduced them into silver nanoparticles (AgNPs) without adding any reducing reagents, while the oxygen containing functional groups were partially removed from the GQDs. Thus,
GQDs were coated on the surfaces of the resultant AgNPs,
leading to the formation of AgNPs/GQDs. The residual
oxygen-containing groups on the GQDs made the obtained
AgNPs/GQDs be excellent dispersive and long-term stable in
water (Tetsuka et al., 2012).
The UV–Vis spectra of GQDs and AgNPs/GQDs solutions have been shown in Fig. 1A. As can be seen in
Fig. 1A, curve b, the adsorption band at 425 nm is attributed
to the characteristic surface plasmon absorption of AgNPs,
while this absorption is not observed in the case of the control
sample (solution containing only GQDs, without AgNO3),
where no AgNPs are formed (Fig. 1A, curve a). A shoulder
at 357 nm in Fig. 1A (curve b) can be attributed to the presence of GQDs in AgNPs/GQDs solution when comparing to
UV–Vis spectra of GQDs (Fig. 1A, curve a). Moreover, the
synthesized AgNPs/GQDs have been characterized by DLS
(Fig. 1B), XRD (Fig. 1C) and TEM (Fig. 1D). DLS data
(Fig. 1B) have indicated that AgNPs/GQDs have particles size
from 20 nm to 100 nm with mean size at 40 nm. Besides that,
TEM analysis (Fig. 1D) shows that AgNPs/QGDs are spherical particles with particles size around 40 nm. These data are
in a highly agreement with the DLS results. The XRD pattern
of the AgNPs/GQDs (Fig. 1C) shows three main characteristic peaks at 2h = 37.5°, 43.1° and 64.8° which match very well
with those of the standard AgNPs (PCPDF card number
40,783) (Mamatha et al., 2017) with Miller indices (1 1 1),
(2 0 0) and (2 2 0). Normally, X-ray diffraction of GQDs presents a weak broad peak (0 0 2) centered at 2h $ 22.7° which
indicates the disordered stacking structures of graphene layers; however, this (0 0 2) peak is strongly depend on the
degree of oxidation of GQDs because the attached hydroxyl,
epoxy/ether, carbonyl and carboxylic acid groups can increase
the interlayer spacing of GQDs (Tetsuka et al., 2012). In
Fig. 1C, no specific XRD peak of GQDs can be seen, possibly
this peak is too weak and overlapped by the background signal. The EDS spectra of GQDs (Fig. 1E, curve a) showed the
peaks of C, O and N, which were three major constituents of
GQDs. EDX spectra of AgNPs/GQDs hybrid (Fig. 1E, curve
b) presented new appearing peaks, corresponding to Ag. The
EDS spectra provided an evidence for silver metal forming by
GQDs: strong peak values at 2.99 and 3.17 keV were due to
forming of AgNPs. These results confirmed that AgNPs were
efficiently formed onto surface of GQDs. Fig. 1F shows FTIR
spectra of GQDs (curve a) and AgNPs/GQDs hybrid (curve
b). Fig. 1F (curve a) shows that the bands at 3100–3500
cmÀ1 belong to t(OAH) and t(NAH), which is important
to facilitate the hydrophilicity and stability of the GQDs in
aqueous state. The absorption bands at 1641 cmÀ1 is attributed to t(C ‚ O), demonstrating that carboxylic acid may be
used as Ag+ binding site. These peaks indicate that GQDs
have abundance of amino (ANH2), carboxyl (ACOOH) and
hydroxy (AOH) groups on their surface and edges responsible
for the excellent hydrophilicity of GQDs. Interestingly, compared with the GQDs, the absorption bands of the OAH
group at 1064 cmÀ1 almost disappear in the FT-IR spectrum
of the AgNPs/GQDs hybrid (Fig. 1F, curve b). These results
indicate that Ag+ can be reduced to form AgNPs by OAH
groups on the GQD/AgNP hybrid’s surface, resulting in
OAH groups being converted into –COOH groups after the
reaction.
3.2. Hydrogen peroxide detection
3.2.1. Spectrometric assay for hydrogen peroxide detection and
effect of pH
The colorimetric H2O2 sensor was constructed basing on the
reaction of AgNPs with H2O2, which leaded the change of
the color of AgNPs/GQDs solutions from yellowish to colorless, depending on H2O2 concentration. As can be seen in
Fig. 2, the presence of AgNPs/GQDs in the solution results
in a strong absorption band at 425 nm (Fig. 2a to Fig. 2 g,
curve (i)), corresponding to the yellowish color. The optical
density of the AgNPs/GQDs solution at 425 nm (OD425)
decreases after addition 200 mL of H2O2 50 mM (Fig. 2a to
Fig. 2 g, curve (ii)), corresponding to the color changing of
the solution from yellowish to colorless. This result is
explained by the oxidation of AgNPs in the presence of
H2O2. The standard potential of Ag+/Ag is lower than that
of H2O2/H2O (E0Agþ =Ag = 0.8 V < E0H2 O2 =H2 O = 1.77 V) in
water at pH = 7. The following reaction will occur (Eq. (2)):
ðGQDsÞAg0 þ H2 O2 ! ðGQDsÞAgþ þ 2HOÀ
ð2Þ
A label-free colorimetric sensor based on silver nanoparticles
1137
0.8
10.0
(A)
(B)
8.0
420 nm
(a) (b)
Frequency (%)
Absorbance (A.U)
0.6
0.4
343 nm
357 nm
0.2
(b)
400
4.0
2.0
(a)
0.0
6.0
0.0
600
800
1
10
100
1000
Particle size (nm)
Wavelength (nm)
120
(C)
Intensity (A.U)
(D)
(111)
100
80
60
40
(200)
(220)
20
0
20
30
40
50
60
70
2θ/ degree
C
(F)
N
cps (a.u)
O
(a)
C
Ag
Ag
NO
Transmittance (%)
(E)
2
AgNPs/GQDs
(b)
(b)
4000
0
GQDs
(a)
4
6
8
Energy (keV)
3500
3000
2500
2000
1500
1000
500
-1
Wavenumber (cm )
Fig. 1 (A) UV–Vis spectra of (a) GQDs and (b) AgNPs/GQDs (Inset: color of the corresponding samples); (B) Particles size distribution
of AgNPs/GQDs by DLS method; (C) XRD pattern of AgNPs/GQDs; (D) TEM image of AgNPs/GQDs; (E) EDX of (a) GQDs and (b)
AgNPs/GQDs; (F) FT-IR of (a) GQDs and (b) AgNPs/GQDs.
Therefore, AgNPs in AgNPs/GQDs hybrid will be etched
from Ag0 to Ag+. So the concentration of Ag0 will decrease,
leading to the fading of the AgNPs/GQDs solution after add-
ing H2O2. The above behaviour provides a potential for quantitative detection of H2O2 by measuring the decrease in the
AgNPs surface plasmon resonance at 425 nm.
1138
N.D. Nguyen et al.
1.0
(a)
pH = 11
1.0
(b)
pH = 9
0.8
(i)
Absorbance (A.U)
Absorbance (A.U)
0.8
ΔA
0.6
(ii)
0.4
0.2
0.0
(i)
ΔA
0.6
(ii)
0.4
0.2
0.0
300
400
500
600
300
400
Wavelength (nm)
1.0
ΔA
0.6
(ii)
0.4
0.2
(i)
0.6
ΔA
0.4
0.2
(ii)
0.0
0.0
300
400
500
300
600
400
500
1.0
(f)
pH = 5
(e)
pH = 4
0.8
(i)
(i)
Absorbance (A.U)
Absorbance (A.U)
0.8
0.6
ΔA
0.4
(ii)
0.2
0.6
ΔA
0.4
(ii)
0.2
0.0
0.0
300
400
500
300
600
400
(g)
80
Δ A/A0 (%)
Absorbance (A.U)
pH = 3
(i)
0.6
ΔA
0.4
(ii)
0.2
60
40
20
0.0
300
600
(h)
100
0.8
500
Wavelength (nm)
Wavelength (nm)
1.0
600
Wavelength (nm)
Wavelength (nm)
1.0
600
pH = 7
0.8
(i)
Absorbance (A.U)
Absorbance (A.U)
0.8
(d)
1.0
pH= 7.5
(c)
500
Wavelength (nm)
400
500
Wavelength (nm)
600
2
3
4
5
6
7
8
9
10
11
12
pH
Fig. 2 UV–vis spectrum of AgNPs/GQDs solutions: (i) before and (ii) after addition of 50 lM hydrogen peroxide at room temperature
and reaction time was 15 min at different pH: (a) pH = 11, (b) pH = 9, (c) pH = 7.5, (d) pH = 7, (e) pH = 5, (f) pH = 4, (g) pH = 3;
(h) summarization of effect of pH on response signal of hydrogen peroxide sensors based on AgNPs/GQDs.
A label-free colorimetric sensor based on silver nanoparticles
1139
UV–vis spectra of AgNPs/GQDs solutions at different pH
values without (curve i) and with (curve ii) 50 mM H2O2 are
shown in Fig. 2a–g, which corresponding with pH from 11
to 3. It can be seen, when H2O2 was adding, the adsorption
at 425 nm (OD425) was decreased. The decreasing of OD425
was strongly depended on pH of solution. Fig. 2 h presents
the summarizing of the effect of pH on response signal of
H2O2 sensors based on AgNPs/GQDs solution, which was
given on the graph DA/A0 vs. pH (here, DA = A0 À AC where
A0 and AC are OD425 of the AgNPs/GQDs solution before and
after H2O2 addition, respectively). As can be seen in Fig. 2 h,
the value of DA/A0 is higher in acid environment than that
in base environment. This result is explained by the disintegration of H2O2 in base environment according to the following
equation (Eq. (3)):
(ca. 96.61%) at pH = 7, so that following experiments will be
performed in neutral environment.
2H2 O2 ! 2H2 O þ O2
ð3Þ
Therefore, in base environment, the decreasing of the concentration of Ag0 according to Eq. (1) is lower than that in
acid environment. The maximum value of DA/A0 was obtained
0.8
(A)
[H2 O2 ] concentration (mM )
0.7
Absorbance (A.U)
0.6
0.5
0.4
0.3
0
-3
0.5x10
-3
1x10
-3
5x10
-3
10x10
-3
20x10
-3
30x10
-3
40x10
-3
50x10
-3
100x10
0.2
3.3. Glucose detection
3.3.1. Sensitivity of the sensor
When glucose and GOx are added into the solution containing
AgNPs/GQDs, the following reaction will occur:
ðgluconic acidÞ
0.0
300
400
500
600
Wavelength (nm)
(B)
m
M
40
M
0.0
01
mM
0.000
5 mM
0.01 m
5
00
0.
60
0.02 m
M
0.0
3m
M
80
Δ A/A0 (%)
The UV–Vis spectra of samples containing different H2O2 concentrations are shown in Fig. 3A. When the concentration of
H2O2 increases from 0.5 lM to 100 lM, the optical density
of the AgNPs/GQDs solution at 425 nm (OD425) decreases
from 0.6 (a.u) to 0.07 (a.u). It can be seen that, a shoulder at
357 nm appears more clearly which can be attributed to specific plasmon peak of free GQDs in solution. This phenomenon
can be explained following: when H2O2 is added, H2O2 will
react with AgNPs (Eq. (2)), therefore, GQDs from AgNPs/
GQDs will be released to free GQDs in solution.
Using OD425 as the recorded signal, the calibration curve of
hydrogen peroxide detection was generated under optimum
conditions has been shown in Fig. 3B by DA/A0 vsÁH2O2 concentration (Eq. (1)). In the calibration, the linear relationship
of DA/A0 vsÁH2O2 concentration is in range from 0.5 lM to
50 lM with the regression equation DA/A0 = (1734 ±
72.58). CH2O2 (mM) + (2.74412 ± 1.79846) with R2 =
0.98615. Based on the calibration curve and the blank samples,
the limit of H2O2 detection (LOD) of the sensor is estimated of
to be 162 nM). Moreover, it is able to monitor the color changing of the AgNPs/GQDs solution by naked eyes in the case of
immediate and qualitative H2O2 detection (Fig. 3B, insert).
Glucose þ O2 þ H2 O ! D-glucono-1; 5-lactone þ H2 O2
0.1
100
3.2.2. Sensitivity of the sensor
0.
04
m
M
m
0.05
M
0.1 mM
0 mM
20
0
0.00
0.02
0.04
0.06
0.08
0.10
[H2O2]/ mM
Fig. 3 (A) UV–Vis spectra of hydrogen peroxide sensor with
various H2O2 concentrations; (B) Calibration curve for H2O2
detection (inset: color of sensor with corresponding samples in
(A)). Experimental conditions were described in the text.
ð4Þ
After that, H2O2 is measured by using the fabricated colorimetric sensor based on AgNPs/GQDs. Fig. 4A shows the UV–
Vis spectra of samples containing different glucose concentrations. When the concentration of glucose increases from 0.5
mM to 8 mM, the optical densities of the AgNPs/GQDs solution at 425 nm (OD425) are decreased from 0.61 (a.u) to 0.31
(a.u).
The calibration curve of glucose detection is shown in
Fig. 4B by DA/A0 vs. glucose concentration as mentioned
above. In the calibration (Fig. 4B), the linear relationship of
DA/A0 vs. glucose concentration is in range from 0.5 mM to
8 mM with the regression equation DA/A0 = (7.06087 ±
0.40925). Cglucose (mM) + (3.05473 ± 1.49321) with R2 =
0.97695. The limit of detection (LOD) was estimated to be
30 lM based on three times the standard deviation of the
blank tests, which is comparable to those of the previously
reported methods (Table 1). The linear range of the sensor is
from 0.5 mM to 8 mM and the LOD value (30 lM) is lower
than the value of the concentration of glucose in a urine sample which is positive for diabetes (2.8–5.6 mM). Thus, the
developed colorimetric glucose sensor has great potential for
application to a daily glucose test. In addition, the above
results have indicated that the synthesized AgNPs/GQDs
nanostructured material not only has catalytic efficiency as
peroxidase mimetics but also shows unparalleled advantages
of low cost and stability over natural enzymes.
N.D. Nguyen et al.
0.4
0.2
0.0
300
400
M
m
8.0
Glucose concentration (mM)
Absorbance (A.U)
M
0 mM
m
3.5
m
m
4.
0
5
0.
M
3.0 mM
m
2.0 mM
(A)
1.0
0.6
M
1140
500
M
0.0
0.5
1.0
2.0
3.0
3.5
4.0
8.0
600
Wavelength (nm)
60
(B)
Δ A/A0(%)
50
3.3.2. Selectivity of the sensor
40
30
20
10
0
0
2
4
6
8
Glucose concentration/ mM
Fig. 4 (A) UV–Vis spectra of glucose sensor with various
glucose concentrations (inset: color of sensor with various glucose
concentrations); (B) Calibration curve for glucose detection.
Experimental conditions were described in the text.
Table 1
Moreover, as can be seen in Fig. 4A, when the concentration of glucose increases from 0.5 mM to 8 mM, the
shoulder at 357 nm which can be attributed to specific plasmon peak of free GQDs in solution appears more clearly.
This result is in good agreement with the result obtained
in the case of H2O2 sensors (Fig. 3A). This result is an
important clue for suggestion of a glucose detection mechanism following two steps (Fig. 5): In the first step, glucose is
converted to D-glucono-1,5-lactone (which is named as gluconic acid) and H2O2 following Eq. (4). Then, AgNPs/
GQDs are etched by H2O2 (Eq. (2)) in the second step.
Therefore, GQDs from AgNPs/GQDs nanocomposite will
be released to free GQDs in solution, leading to the appearance more clearly of the shoulder at 357 nm. The above
result is a new point in the comparison with previous work
(Chen et al., 2014; Xia et al., 2013). In this work, the phenomenon of etching AgNPs and releasing GQDs can be seen
by experimental results. It is thanks to the excellent dispersive and the long-term stable in water of the synthesized
AgNPs/GQDs nanocomposite.
The selectivity of the glucose sensor was tested by conducting the control experiments in the presence of glucose,
galactose, lactose, sucrose and fructose at concentration of
4 mM.
It can be seen in Fig. 6A, a small decreasing of OD425 was
found when galactose, lactose, sucrose and fructose were
added. When glucose was added, a strong decreasing of
OD425 was obtained. The DA/A0 values of sensor when using
various saccharides at concentration of 4 mM were summarized in Fig. 6B. It can be found that the DA/A0 values were
14.59% for presence of galactose; 11.27% for lactose,
17.34% for sucrose, 16.29% for fructose. These values are
lower than that of the solution containing glucose (DA/A0
= 54.76%) at least 3.16 times at the same concentration.
These results have indicated the excellent selectivity for glucose
of the developed sensor.
Comparison with some reports based on label-free colorimetric methods for the detection of glucose.
Signal probes
Enzyme
immobilization
Line range (mM)
Limit of
detection (lM)
Actual samples
Reference
AuNPs coupled AgNPs
AuNPs
No
GOx
50 Á 10À3–70 Á 10À3
0.056–0.5
3
27.7
Human serum
Human urine
AgNPs/GQDs
AgNPs
CexOy nanoparticles
MnO2 nanoparticles
AgNPs/GQDs
DNA-embedded Au@Ag
nanoparticles
Au@Ag core–shell
nanoparticles
P(DMA-co-PBMA)
copolymer and AuNPs
GOx
GOx
GOx
GOx
GOx
GOx
0.17
0.2
500
0.17
30
0.01
N/R
Human serum
Human serum
Human serum
Human urine
Fetal bovine serum
GOx
0.5 Á 10À3–0.4
2 Á 10À4–0.1
0.5–100
0.5 Á 10À3–50 Á 10À3
0.5–8
0.01 Á 10À3–0.2 Á 10À3; 1 Á
10À3–100 Á 10À3
0.5 Á 10À3–0.4
Gao et al. (2017)
Radhakumary and
Sreenivasan (2011)
Chen et al. (2014)
Xia et al. (2013)
Ornatska et al. (2011)
Huang et al. (2017)
This work
(Kang et al., 2015)
0.24
GOx
N/R
50
Human urine or
human serum
N/R
N/R-not reported.
(Zhang et al., 2016)
(Li et al., 2011)
A label-free colorimetric sensor based on silver nanoparticles
1141
STEP 1
Glucose + O2 + H2O
D-Glucono-1,5-Lactone + H2O2
GOx
( Gluconic Acid)
STEP 2
(a)
(b)
H 2O 2
H2 O2
without glucose
H 2O 2
(a)
H2O2
Reaction
H2O2
H2O2
UV -V is spectra
with glucose
(b)
H 2O 2
GQDs
AgNPs
Ag+
Glucose Oxidase-GOx
Fig. 5 Illustration of detection mechanism of proposed label free and reagentless colorimetric sensor for hydrogen peroxide and glucose
using AgNPs/GQDs as capture probe and signal probe.
3.3.3. Application of the sensor for detection glucose in human
urine sample
(A)
(B)
Human urine sample was firstly diluted because human
urine may contain many soluble salts and residues. In
our previous work on human urine samples (Tran et al.,
2017), we have found that high diluted ratio gives better
signal than low diluted ratio. However, because of the limits of the LOD, the optimized dilution ratio was 1:4. The
standard addition method was used to analyse glucose concentration in the human urine sample using the proposed
sensor.
Fig. 7A shows UV–Vis spectra the glucose sensor in presence of the diluted urine sample and the three spiked urine
samples by adding glucose with concentration from 1 mM
to 3 mM. The calibration curve for determination of glucose
concentration using the standard addition method with the
human urine sample is described in Fig. 7B. From these data,
glucose concentration in the human urine sample has been
determined of 3.68 mM. Therefore, it is able to conclude that
the above human urine sample is of a diabetic patient. This
experimental result shows the great potential for application
of the developed colorimetric glucose sensor based on a
low-cost, blood-free and needle-free approach to daily glucose tests.
4. Conclusions
Fig. 6 (A) UV–Vis spectra of the glucose sensor in presence of
different saccharides at concentration of 4 mM; (B) Corresponding of DA/A0 of (A) (inset: color of sensor with various
saccharides).
In this work, silver nanoparticles decorated graphene quantum
dots carbon (AgNPs/GQDs) hybrids have been synthesized
and characterized by DLS, XRD, FT-IR, EDX and TEM
methods; and the results indicate that mono-dispersed AgNPs
have been obtained with particles size ca. $40 nm. Using
AgNPs/GQDs as capture probe and signal probe, a spectroscopy method has been developed for determination of
hydrogen peroxide with a low detection limit of 162 nM of
1142
N.D. Nguyen et al.
0.6
Absorbance (A.U)
0.5
0.4
References
(A)
(i)
(2i)
(3i)
(4i)
(5i)
(i) AgNPs/GQDs
(2i) = (i) + diluted urine
(3i) = (2i) + 1 mM glucose
(4i) = (2i) + 2 mM glucose
(5i) = (3i) + 3 mM glucose
0.3
0.2
0.1
0.0
300
400
500
600
Wavelength (nm)
35
(B)
Δ A/A0 (%)
30
25
20
15
10
5
0.92mM
0
-1
0
1
2
3
[Additional glucose] (mM)
Fig. 7 Method of standard addition for glucose detection in
urine: (A): UV–Vis spectra of (i) control sample (without diluted
urine addition); (2i) sensor in from (i) after addition of the diluted
human urine sample; (3i)-(5i) spiked urine sample with various
glucose concentration from 1, 2 and 3 mM, respectively. (B)
Calibration curve of standard addition for urine glucose detection.
Experimental conditions were described in the text.
H2O2. Combining with the use of glucose oxidase (GOx), a
simple colorimetric method for selective and sensitive detection
of glucose has also been fabricated. The above sensors perform
excellent sensitivity and selectivity with a low detection limit of
30 lM of glucose concentration. In addition, the level of glucose in the real human urine sample can also be measured
accurately by using the AgNPs/GQDs-based colorimetric sensor following the addition standard method. Therefore, the
proposed colorimetric glucose sensor has great potential for
application to a daily glucose test based on a low-cost;
blood-free and needle-free approach.
Acknowledgments
This research was funded by Vietnam National Foundation
for Science and Technology Development (NAFOSTED)
under grant number 104.99-2016.23.
Baghayeri, M., Amiri, A., Farhadi, S., 2016. Development of nonenzymatic glucose sensor based on efficient loading Ag nanoparticles on functionalized carbon nanotubes. Sens. Actuators B 225,
354–362.
Chen, S., Hai, X., Chen, X.W., Wang, J.H., 2014. In situ growth of
silver nanoparticles on graphene quantum dots for ultrasensitive
colorimetric detection of H2O2 and glucose. Anal. Chem. 86, 6689–
6694.
Chen, L., Sun, B., Wang, X., Qiao, F., Ai, S., 2013. Paper 2D ultrathin
nanosheets of Co-Al layered double hydroxides prepared in Lasparagine solution: enhanced peroxidase-like activity and colorimetric detection of glucose. J. Mater. Chem. B 1, 2268–2274.
Ding, C., Yan, Y., Xiang, D., Zhang, C., Xian, Y., 2016. Magnetic
Fe3S4 nanoparticles with peroxidase-like activity, and their use in a
photometric enzymatic glucose assay. Microchim. Acta 183, 625–
631.
Dong, Y., Zhang, H., Rahman, Z.U., Su, L., Chen, X., Hu, J., Chen,
X., 2012. Graphene oxide-Fe3O4 magnetic nanocomposites with
peroxidase-like activity for colorimetric detection of glucose.
Nanoscale 4, 3969–3976.
Ensafi, A.A., Zandi-Atashbar, N., Rezaei, B., Ghiaci, M., Taghizadeh,
M., 2016. Silver nanoparticles decorated carboxylate functionalized
SiO2 new nanocomposites for non-enzymatic detection of glucose
and hydrogen peroxide. Electrochim. Acta 214, 208–216.
Fine, J., 1965. Glucose content of normal urine. Br. Med. J. 1, 1209–
1214.
Gao, Y., Wu, Y., Di, J., 2017. Colorimetric detection of glucose based
on gold nanoparticles coupled with silver nanoparticles. Spectrochim. Acta Part A Mol. Biomol. Spectrosc. 173, 207–212.
Huang, Z., Yang, J., Zhang, L., Geng, X., Ge, J., Hu, Y., Li, Z., 2017.
A novel one-step colorimetric assay for highly sensitive detection of
glucose in serum based on MnO2 nanosheets. Anal. Methods 9,
4275–4281.
Jia, M.Y., Wu, Q.S., Li, H., Zhang, Y., Guan, Y.F., Feng, F., 2015.
The calibration of cellphone camera-based colorimetric sensor
array and its application in the determination of glucose in urine.
Biosens. Bioelectron. 74, 1029–1037.
Kang, F., Hou, X., Xu, K., 2015. Highly sensitive colorimetric
detection of glucose in a serum based on DNA-embeded Au@Ag
core-shell nanoparticles. Nanotechnology, vol. 26, 405707
(405708pp).
Lankelma, J., Nie, Z., Carrilho, E., Whitesides, G.M., 2012. Paperbased analytical device for electrochemical flow-injection analysis
of glucose in urine. Anal. Chem. 84, 4147–4152.
Li, C., Hu, J., Liu, T., Liu, S., 2011. Stimuli-triggered off/on
switchable complexation between a novel type of charge-generation
polymer (CGP) and gold nanoparticles for the sensitive colorimetric detection of hydrogen peroxide and glucose. Macromolecules
44, 429–431.
Lu, C., Liu, X., Li, Y., Yu, F., Tang, L., Hu, Y., Ying, Y., 2015.
Multifunctional janus hematite-silica nanoparticles: mimicking
peroxidase-like activity and sensitive colorimetric detection of
glucose. ACS Appl. Mater. Interfaces 7, 15395–15402.
Mamatha, R., Shadab, K., Pooja, S., Shruti, S., Shuchishweta, K.,
Asmita, P., Animesh, D., Bhushan, C.P., 2017. Rapid synthesis of
highly monodispersed silver nanoparticles from the leaves of
Salvadora persica. Mater. Lett. 205, 226–229.
Nirala, N.R., Abraham, S., Kumar, V., Bansal, A., Srivastava, A.,
Saxena, P.S., 2015. Colorimetric detection of cholesterol based on
highly efficient peroxidase mimetic activity of graphene quantum
dots. Sens. Actuators, B 218, 42–50.
Ornatska, M., Sharpe, E., Andreescu, D., Andreescu, S., 2011. Paper
bioassay based on ceria nanoparticles as colorimetric probes. Anal.
Chem. 83, 4273–4280.
A label-free colorimetric sensor based on silver nanoparticles
1143
Qiao, F., Chen, L., Li, X., Li, L., Ai, S., 2014. Peroxidase-like activity
of manganese selenide nanoparticles and its analytical application
for visual detection of hydrogen peroxide and glucose. Sens.
Actuators, B 193, 255–262.
Radhakumary, C., Sreenivasan, K., 2011. Naked eye detection of
glucose in urine using glucose oxidase immobilized gold nanoparticles. Anal. Chem. 83, 2829–2833.
Shu, J., Tang, D., 2017. Current advances in quantum dots-based
photoelectrochemical immunoassays. Chem. Asian J. 12, 2780–
2789.
Su, Li, Feng, Jie, Zhou, Ximin, Ren, Cuiling, Li, Honghong, Chen, X.,
2012. Colorimetric detection of urine glucose based ZnFe2O4
magnetic nanoparticles. Anal. Chem. 84, 5753–5758.
Tetsuka, H., Asahi, R., Nagoya, A., Okamoto, K., Tajima, I., Ohta,
R., Okamoto, A., 2012. Optically tunable amino-functionalized
graphene quantum dots. Adv. Mater. 24, 5333–5338.
H.V. Tran, T.V. Nguyen, A.D. Chu, N.D. Nguyen, L.T. Tran, C.D.
Huynh, Synthesis and characterization of a highly peroxidase-like
catalytic activity of doped graphene quantum dots. Towards a
colorimetric sensor for urine glucose detection. In: Proceeding of
the 6th Asian Symposium on Advanced Materials: Chemistry,
Physics & Biomedicine of Functional and Novel Materials (ASAM6), 2017, pp. 146–151.
Tran, H.V., Huynh, C.D., Tran, H.V., Piro, B., 2018. Cyclic
voltammetry, square wave voltammetry, electrochemical impedance spectroscopy and colorimetric method for hydrogen peroxide
detection based on chitosan/silver nanocomposite. Arab. J. Chem.
11 (4), 453–459.
Urakami, T., Suzuki, J., Yoshida, A., Saito, H., Mugishima, H., 2008.
Incidence of children with slowly progressive form of type 1
diabetes detected by the urine glucose screening at schools in the
Tokyo Metropolitan Area. Diabetes Res. Clin. Pract. 80, 473–476.
Vashist, S.K., 2012. Non-invasive glucose monitoring technology in
diabetes management: a review. Anal. Chim. Acta 750, 16–27.
Wang, Q., Yang, Y., Gao, F., Ni, J., Zhang, Y., Lin, Z., 2016.
Graphene oxide directed one-step synthesis of flowerlike Graphene@HKUST-1 for enzyme-free detection of hydrogen peroxide in
biological samples. ACS Appl. Mater. Interfaces 8, 32477–32487.
Wang, H., Yi, J., Velado, D., Yu, Y., Zhou, S., 2015. Immobilization
of carbon dots in molecularly imprinted microgels for optical
sensing of glucose at physiological pH. ACS Appl. Mater.
Interfaces 7, 15735–15745.
Wei, H., Wang, E., 2008. Fe3O4 magnetic nanoparticles as peroxidase
mimetics and their applications in H2O2 and glucose detection.
Anal. Chem. 80, 2250–2254.
Xia, Y., Ye, J., Tan, K., Wang, J., Yang, G., 2013. Colorimetric
visualization of glucose at the submicromole level in serum by a
homogenous silver nanoprism-glucose oxidase system. Anal.
Chem. 85, 6241–6247.
Xing, Z., Tian, J., Asiri, A.M., Qusti, A.H., Al-Youbi, A.O., Sun, X.,
2014. Two-dimensional hybrid mesoporous Fe2O3-graphene nanostructures: a highly active and reusable peroxidase mimetic toward
rapid, highly sensitive optical detection of glucose. Biosens.
Bioelectron. 52, 452–457.
Zhang, Z., Chen, Z., Cheng, F., Zhang, Y., Che, L., 2017. Highly
sensitive on-site detection of glucose in human urine with naked eye
based on enzymatic-like reaction mediated etching of gold
nanorods. Biosens. Bioelectron. 89, 932–936.
Zhang, W., Ma, D., Du, J., 2014. Prussian blue nanoparticles as
peroxidase mimetic for sensitive colorimetric detection of hydrogen
peroxide and glucose. Talanta 10, 362–367.
Zhang, X., Wei, M., Lv, B., Liu, Y., Liua, X., Wei, W., 2016. Sensitive
colorimetric detection of glucose and cholesterol by using Au@Ag
core-shell nanoparticles. RSC Adv. 6, 35001–35007.
Zhao, H., Dong, Y., Jiang, P., Wang, G., Zhang, J., 2015. Highly
dispersed CeO2 on TiO2 nanotube: a synergistic nanocomposite
with superior peroxidase-like activity. ACS Appl. Mater. Interfaces
7, 6451–6461.