26 Comparative studies on the nutrition of two species of abalone, Haliotis tuberculata L. and Haliotis discus hannai Ino. IV. Optimum dietary protein level for growth
Bạn đang xem bản rút gọn của tài liệu. Xem và tải ngay bản đầy đủ của tài liệu tại đây (1.09 MB, 16 trang )
Aquaculture
Aquaculture
136 (1995)
165-180
Comparative studies on the nutrition of two species
of abalone, Haliotis tuberculata L. and Haliotis
discus hannai Ino. IV. Optimum dietary protein
level for growth
Kangsen Mai a**, John P. Mercer ‘, John Donlon b
aShe&h
Research Laboratory, University College Galway, Galway, Ireland
b Deparmenr of Biochemisrry, University College Galway, Galway, Ireland
Accepted 30 May 1995
Abstract
A 100 day growth experiment was conducted to identify the optimum dietary protein level for the
juveniles of two species of abalone, Haliotis tuberculata and Haliotis discus hannai. A mixture of
vitamin-free casein and gelatin (4.34: 1) supplemented with crystalline amino acids was used as the
protein source to simulate the amino acid profile of abalone body. Eight purified diets were formulated
to provide graded protein levels ranging approximately from 0 to 50%. The weight gain, protein gain,
soft body to shell ratio, and carcass levels of protein and lipid of both abalone species were significantly
(ANOVA, P < 0.05) affected by the dietary protein level. The protein requirements of these abalone
were evaluated from weight gain and protein gain respectively, by using the second-order polynomial
regression analysis. On the basis of weight gain, the optimum protein levels were estimated to be
22.3-32.3%, and 23.3-35.6% for H. tuberculata and H. discus hannai, respectively. According to the
protein gain, the statistical analysis indicated that the optimum ranges of protein requirements were
24.0-34.5% and 25.2-36.6% for H. tuberculata and H. discus hannai, respectively. Based on these
results, about 35% dietary protein from good quality sources is recommended for the maximum
growth of both abalone species; and, if dietary protein is reduced from 35 to 25%, the growth of these
abalone may be depressed with 5% likelihood.
Keywords: Hakotis ruberculata; Halioris discus hnnai;
Comparative
nutrition; Protein requirements,
molluscs
1. Introduction
Animals
do not have an absolute
of essential and non-essential
protein
requirement
but require a well-balanced mixture
1983; Wilson, 1989). The most common
amino acids (NRC,
* Corresponding author at: College of Fisheries, Ocean University of Qingdao, Peoples Republic of China. Tel.
(+86-532)
2864361, Fax. (+86-532)
2879091.
0044-8486/95/$09.50
0 1995 Elsevier Science B.V. All rights reserved
SDr0044-8486(95)01041-6
166
K. Mai et al. /Aquaculture 136 (1995)165-180
and economical source of amino acid mixture is from natural proteins in feedstuffs. Information on the amino acid requirements of an animal provides a basis to evaluate the
nutritional value of protein sources and then to select proper protein sources for formulating
feeds for the animal. Because it is the principal diet component for animal growth, and has
the highest cost consideration for commercial feeds, protein has been given priority in
nutritional requirement studies (Lim et al., 1979). The minimum amount of dietary protein
needed to supply adequate amino acids and produce maximum growth has been determined
with semi-purified and purified test diets in about 30 species of fish and crustaceans (NRC,
1983; Tacon and Cowey, 1985; Wilson, 1989). Molluscan nutrition lags far behind that of
fish and crustaceans and much less is known of the protein requirements of molluscs largely
due to their lower commercial importance in aquaculture (Carefoot, 1982). There have
been some publications concerning the protein nutrition of molluscs (e.g. Duncan et al.,
1985; Nell, 1985; Uki et al., 1985; Utting, 1986; Hawkins et al., 1989; Kreeger and Langdon,
1992; Kreeger, 1993; Mercer et al., 1993). From the viewpoint of quantitative requirements,
however, there have been only four reports on the protein requirements of abalone, H. discus
(Ogino and Kato, 1964)) H. discus hunnai (Uki et al., 1986)) H. kumtschutkuna (Taylor,
1992) and H. midue (Britz et al., 1994), It has been demonstrated that intensive culture of
abalone using nutritionally complete diets is feasible; however, information on the nutrient
requirements of this animal is far from sufficient to support industrial scale feed manufacture.
Investigations into the protein requirement of abalone have used either white fish meal
(Ogino and Kato, 1964; Uki et al., 1986; Britz et al., 1994) or casein (Uki et al., 1986;
Taylor, 1992) as the sole protein source in the test diets. Following the results of feeding
trials, casein has been considered as the best protein source for abalone (Uki et al., 1985).
At present, no information is available on the quantitative requirements of abalone for
essential amino acids (EAA), however, the analyses of amino acid profiles of abalone body
indicate that casein is probably limiting in some EAA, especially arginine (Mai et al.,
1994). Therefore, the protein requirement of abalone could be overestimated if casein is
used as the sole protein source in experimental diets. The protein requirements of fish are
usually estimated by feeding a balanced diet containing graded levels of high quality protein,
which is generally a casein/gelatin
mixture supplemented with crystalline amino acids to
simulate the amino acid profiles of either fish body or whole hen’s egg protein (Tacon and
Cowey, 1985). Hence, this study was designed to identify the optimum level of dietary
protein for the growth of the two commercially important abalone species, H. tubercuhtu
and H. discus hunnui by employing the protein source, casein/gelatin mixture supplemented
with crystalline amino acids to simulate the EAA pattern of abalone body.
2. Materials and methods
2.1. Experimental
diets
Formulations of the experimental diets and their proximate composition are shown in
Table 1. On the basis of essential amino acid ratios (A/E ratios) (Arai, 198 1) , the EAA
pattern in the soft-body of these abalone (Mai et al., 1994)) expressed as mean A/E ratios,
was used as a reference. The mixture of casein and gelatin (4.34: 1) was supplemented with
0
0
0
65.00
5.00
18.00
4.00
2.00
0.50
5.00
0.28
5.09
15.8
5653.6
0.4
10.03
5.11
16.3
162.5
15.5
20.15
5.03
17.4
86.1
31.1
25.01
5.16
17.5
70.0
38.6
30.36
5.07
18.7
61.5
46.9
35.32
5.21
18.7
53.0
54.6
28.99
6.68
2.43
26.9
5.00
18.00
4.00
2.00
0.50
5.00
35
39.99
5.03
18.9
47.3
61.8
33.10
7.63
2.77
21.50
5.00
18.00
4.00
2.00
0.50
5.00
40
50.15
5.13
19.7
39.1
78.0
41.39
9.54
3.47
10.6
5.00
18.00
4.00
2.00
0.50
5.00
50
DS”
Arg
His
Ile
Leu
Lys
Met+Cys
Phe+Tyr
Thr
Val
1.ooo
171
38
96
152
133
69
151
88
102
Abalone
0.612
68
51
112
172
139
61
190
76
131
Casein
0.802
308
34
61
129
157
38
102
78
93
Gelatin
0.985
164
43
94
148
124
60
160
91
112
Exp. diets
‘All ingredients were purchased from Sigma Chemical, UK.‘Amino acid mix, each 100 g of the mix contained arginine, 71.43g; threonine, 21.35 g and methionine, 7.22
g. 3Mineral mix, each 1000 g of diet contained NaCl, 0.4 g; MgSO, 7Hz0, 6.0 g; NaH,PO, . 2HZ0, 10.0 g; KH,PO,. 12.8 g; Ca( H,PO,) z. HzO, 8.0 g; Fe-lactate, 1.O g;
Ca-lactate, 1.4 g; ZnSO,.7H,O,
141.2 mg; MnSO,.4H,O,
64.8 mg; CuS04.5Hz0,
12.4 mg; CoC12.6Hz0, 0.40 mg, KIO,, 1.2 mg. 4Vitamin mix, each 1000 g of diet
contained tbiamin HCI, 120 mg; riboflavin, 100 mg; folic acid, 30 mg; PABA, 400 mg; pyridoxine HCI, 40 mg; niacin, 800 mg; Ca pantothenate, 200 mg; inositol, 4000
mg; biotin, 12 mg; vitamin E, 450 mg; menadione, 80 mg; B,,, 0.18 mg; ascorbic acid, 4000 mg; vitamin A, 100,000 I.U.; vitamin D, 2,000 I.U.; ethoxquin, 400 mg.
‘Corn oil and menhaden fish oil ( 1:l) with 0.001% of ethoxquin. ?ncluding the AA mix. ‘Gross energy. aPercentage of protein energy.‘A/E ratio = (Each EAA/Total
EAA) X 1000, not including Trp. The calculation of A/E ratios for casein and gelatin were based on the amino acid data reported in NRC ( 1983). InDegree of similarity
(Mai et al., 1994).
Protein(%)6
Lipid( %)
GE (kJ/g)’
W/g protein
% PEE
30
8.29 16.59 20.70 24.88
1.91
3.82
4.77
5.74
0.70
1.39
1.73
2.08
54.10 43.20 37.80 32.3
5.00
5.00
5.00
5.00
18.00 18.00 18.00 18.00
4.00
4.00
4.00
4.00
2.00
2.00
2.00
2.00
0.50
0.50
0.50
0.50
5.00
5.00
5.00
5.00
25
EAA
20
0
10
A/E Ratio?
diets (% on dry weight basis)
Protein levels (%)
and proximate analysis of experimental
Proximate analysis (means of triplicates)
Casein
Gelatin
AA mix’
Dextrin
Cellulose
Na alginate
Mineral mix’
Vitamin mix4
Choline
co/MF@
Ingredients’
Table 1
Ingredient composition
168
K. Mai et al. /Aquaculture
136 (1995) 165-180
a crystalline amino acid mix including arginine, threonine and methionine to simulate the
reference protein. The A/E ratios and the degree of similarity (DS) in EAA pattern (Mai
et al., 1994) of the protein sources and the experimental diets to that of the reference are
also given in Table 1. A mixture of corn oil and menhaden fish oil ( 1: 1) was used as the
lipid source. Dextrin, the major carbohydrate source, was used to adjust the protein level.
Eight experimental diets were formulated from the purified ingredients to provide graded
protein levels ranging approximately from 0 to 50%. Gross energy of experimental diets
correspondingly
ranged from 15.8 to 19.7 kJ g-’ as determined by bomb calorimetry, and
energy/protein
ratios (E/P ratios) were from 39.1 to 5653.6 kJ gg’ protein.
Procedures for food preparation were modified from the method described by Uki and
Watanabe ( 1992). Casein, gelatin and some minerals that were in the form of small grains
were ground individually using a Pascal Mill and then passed through a mesh with 125 pm
pore size. After adding water (about 120%, w/w) to the mechanically mixed ingredients
containing 18% of sodium alginate, a paste was made by using an electronic mixer. The
paste was shaped into 0.5 mm thick sheets, which were cut into 1 cm* flakes. The flakes
were dipped in an aqueous solution of CaCl, (5%, w/v) for one minute. The surplus
solution was drained naturally, then the flakes were sealed in a sample bag and stored at
- 20°C until use.
2.2. Animal rearing
To maintain the water temperature, a re-circulating system was used. This system comprised a glass fibre reservoir tank (3 m3), a high position tank ( 150 1) and two flush trays
(220 X 120 X 30 cm). Each flush tray held 24 rearing units constructed from 10 1 PVC
flowerpots with covers, and the bases replaced with 1.0 mm mesh. Each rearing unit was
stocked with 25 abalone juveniles. The seawater in the reservoir tank was pumped into the
high position tank, where it was aerated, then delivered to each rearing unit through 1.O cm
(i.d.) PVC tubes. The flow rate of water through each unit was about 1 1 min- ‘. The water
depth in the flush trays was maintained at about 25 cm and the excess water was returned
to the reservoir through the outlets. Water temperature during the experiment was maintained
at 13-15°C. Similar size juveniles of H. discus hannai (378.3 f 16.7 mg) and H. tubercuzata
( 182.7 + 7.8 mg) were selected from the hatchery produced population, then assigned to
the rearing system using a completely randomised design with eight treatments and three
replicates per treatment. At the same time, 100 juveniles of each species were randomly
sampled from the same cohort and stored at - 20°C until subsequent analysis for carcass
composition. Abalone were fed the appropriate diet every third day at a satiation level with
a little leftover. The whole system was thoroughly cleaned just before each feeding and
refilled with pre-heated and filtered ( 10 pm cartridge) seawater. Under such management,
good water quality in the system can be maintained (K. Mai, unpublished observation).
The feeding experiment was run for 100 days.
2.3. Sample collection and analysis
At the termination of the experiment, 15 abalone from each replicate were frozen for
subsequent chemical analysis. Growth is expressed as mean weight gain and protein gain
169
K. Mai et al. /Aquaculture I36 (1995) 165-180
(mg per abalone). The initial and final samples were slightly thawed, and shell and softbody were separated. The soft-body to shell ratio (SB/S ratio, w/w) was computed to
provide an index of nutritional status for abalone.
An aliquot of soft-body tissue from each sample was lyophilised to a constant weight to
determine the moisture content. The rest of each soft-body sample was homogenised with
an equivalent volume of distilled water for 10 min in an Omni-mixer (Sorvall, New Town,
CT), then the homogenate was freeze-dried and ground into fine powder for analyses of
protein and total lipid. Protein was estimated by a modification of the Lowry procedure
(Hartree, 1972) with bovine serum albumin as the calibration standard. Extraction of lipid
was carried out according to the method of Bligh and Dyer ( 1959) and the lipid levels were
determined gravimetrically.
The levels of protein and lipid in the experimental diets were
analysed as described above. The gross energy in the diets was estimated with a Gallenkamp
ballistic bomb calorimeter. The mean gains in body weight and protein were calculated as
follows:
MWG (mg/abalone)
= Wt-
Wi
MPG(mg/abalone)=SBt.(l-Mr).Pt-SBE’.(l-Mi).
Pi
where MWG is mean weight gain; Wi, Wt is initial or final mean body weight (mg); MPG
is mean protein gain; SE, SBt is initial or final soft-body weight (mg); SBi, t= Ri, t. Wi, t/
( 1 + Ri, t); Ri, Rt is initial or final soft-body to shell ratio (SB/S ratio); Mi, Mt is initial or
final moisture level in soft body (%); Pi, Pt is initial or final protein level in soft body (%).
2.4. Statistical analysis
All percentage data were square-root arcsine transformed prior to analysis. Data from
each treatment were subjected to one way ANOVA. When overall differences were significant at less than 5%, Tukey test was used to compare the mean values between individual
treatments. Protein requirements of the juvenile abalone were estimated from weight gain
and protein gain using both the broken-line model (Robbins et al., 1979) and the secondorder polynomial regression analysis model (Lovell, 1989). All statistics were calculated
using Systat@ package (SYSTAT, 1992).
3. Results
3.1. Survival and weight gain
The data of survival and weight gain of abalone fed the experimental diets are shown in
Table 2. During the 100 day experimental period the mean survival, ranging from 92.0 to
98.7% for H. discus hannai and from 82.7 to 96.0% for H. tuberculata, was generally high
and not related to dietary protein level, even though both species fed the approximately
protein-free diet (Diet 1) showed relatively lower survival. The weight gain of both abalone
species was significantly affected by dietary protein levels (ANOVA, P < 0.001). The
progressive increase in mean weight gain reached a maximum value at a protein level of
2.469
0.064
0.865
0.554
194.7(4.1)
178.1(9.1)
186.9(4.5)
186.0(9.4)
177.3(8.3)
174.8(10.8)
190.1(7.5)
173.6( 10.3)
367.8( 16.9)
358.5(6.6)
388.5(5.7)
404.9( 18.3)
393.8( 16.9)
367.2(6.1)
362.6( 10.0)
383.1(7.2)
54.95
0.000
353.1( 16.3)
643.1(5.5)
874.6(47.9)
972.4(24.1)
917.0(2.9)
874.7(23.0)
806.9(42.6)
872.9( 19.2)
H. d
H. t*
H. d’
19.389
0.000
239.2(4.0)
380.9(12.4)
499.2( 10.7)
498.9(39.2)
536.7(37.0)
524.0(34.0)
554.9(12.3)
417.8( 12.3)
Ht
Final weight (mg)
Initial weight (mg)
34.53
0.000
359.1(29.7)d
349.1(24.8)’
364.8(4.9)’
244.2(7.4)bc
312.3(9.6)cd
313.1(29.6)“’
44.6(0.39)”
202.7( 13.7)”
H. t
0.717
0.660
92.0(4.6)
96.0(2.3)
96.0(2.3)
96.0(2.3)
98.7( 1.3)
94.7(3.5)
92.0(2.3)
96.0(2.3)
H. d
1.76
0.166
82.7(3.5)
96.0(2.3)
94.7( 1.3)
96.0(2.3)
90.7(7.4)
96.0(2.3)
92.0(2.3)
93.3( 1.3)
H. t
Survival (%)
different as determined by Tukey test (P > 0.05).
28.17
0.000
- 14.7(0.6)a’
284.6(7.0)b
486.2(44.3)”
567.5(6X)’
523.0(7.0)=’
507.5( 19.9)=’
444.3(32.7)’
489.8( 14.8)“’
H. d
Weight gain (mg/abalone)
‘H. d, H. discus hannai.
‘H. t, H. tuberculata.
3Means in the same column sharing the same superscript letter were not significantly
F
P
0.3
10.0
20.2
25.0
30.4
35.3
40.0
50.2
ANOVA
Protein level( %)
Table 2
Effect of dietary protein on growth and survival of the abalone, H. ruberculara and H. discus hannai (means (s.e), n = 3)
2
%
R
3
5.
a
R
5
0
K. Mai et al. /Aquaculture
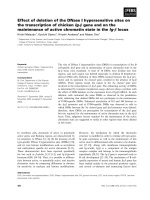
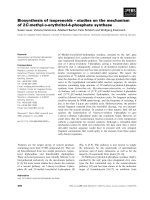
y = 6.902+30.482x- 0.428x"ZRV. = 0.902
y =
171
136 (199.5) 165-180
0
H. dircrcs hami
35.569+ 19.712x
- 0.305r'Z R"2 = 0.919 A H.m!xrculata
X1=23.3%(H.d)
Xmax=35.6%(H.d)
Xmax=32.3% (H.I)
I
40
.
I
50
.
I
60
Dietary protein (%)
Fig. I, Relationship between weight gain and dietary protein level for H. discus hannui and H. tubercuhtu a~
described by second-order polynomial regression. Y,,,,,, maximum weight gain; Y,, a weight gain below maximum
but within the 95% confidence interval; X,,,, a protein level required for Y,,,,,; X,, a protein level associated with
Y,.
25% for H. discus hannai and 40% for H. tuberculata. The results of Tukey test, however,
showed that weight gains of both species at or beyond 20% dietary protein concentration
were not significantly different; but 50% dietary protein appeared to significantly depress
gain of H. tuberculata (Table 2). On the basis of weight gain, the results estimated by the
broken-line model showed that the protein requirements of H. discus hannai and H. tuberculata were 17.3% and 17.4%, respectively (Table 4). However, the second-order polynomial regression analysis revealed that the ranges of dietary protein levels that produced
the maximum weight gains (Y,,)
and lower gains within the 95% confidence limits of
Y,,,,, ( Y, ) were 23.3-35.6% (X,-X,,,)
for H. discus hannai and 22.3-32.3% for H. tuberculata (Fig. 1, Table 4).
The protein requirements of both abalone species seem to be similar when they were
estimated with the same analysis model (Table 4). One remarkable difference in growth
performance between these abalone was that feeding on Diet 1 (approximately 0.3% protein), H. discus hannai exhibited a negative weight gain, while H. tuberculata showed a
positive one (Table 2 and Fig. 1) .
3.2. Carcass composition
and protein gain
Except for moisture content, the body composition was significantly affected by the
dietary treatments (Table 3). Soft body to shell ratios (SB/S ratio, w/w) could be regarded
13.32
0.000
1.91
0.067
‘Soft-body to shell ratio (w/w).
‘On dry weight basis.
3H.t, H. tuberdata;
H.d, H. discus hannai.
4Data for initial animals were not subjected to statistical analysis.
‘Means in each column sharing the same letter are not significantly
11.97
0.000
F
P
1.65(0.03)”
2.02(0.03)b
2.23(0.07)W
2.25(0.04)k
2.32(0.12)W
2.27(0.05)h
2.34(0.04)’
2.15(0.06)&
1.78(0.03)
10.84
0.000
24.66
0.000
8.6(0.2)’
8.3(0.1)”
8.2(0.2)“’
7.9(o.l)k
7.8(0.1)h
7.5(0.l)b
7.4(0.l)b
6.8(o.1)a
6.3(0.2)
H. t
different based on Tukey test (P> 0.05)
2.02
0.058
S.O(O.2)’
7.8(0.1)’
7.6(0.1)bc
7.7(O.l)“c
7.3(o.l)ak
7.o(o.l)ab
6.6(0.3)”
6.7(0.3)”
6.2( 0.3)
76.4(0.1)
75.4(0.2)
76.0(0.2)
75.7(0.1)
75.6(0.2)
74.9(0.3)
74.9(0.3)
75.7(0.6)
76.2(0.3)
SO.O(O.3)
79.5(0.2)
78.8(0.2)
78.7(0.2)
79.0(0.4)
79.0(0.2)
79.6(0.2)
79.4(0.3)
79.8(0.5)
1.50(o.05)ti
1.83(0.06)b
2.04(0.06)b
2.05(0.06)b
2.07(0.04)b
2.03(0.04)b
1.96(0.06)b
l.97(0.06)b
1.81(0.02)
H. d
H. t
H. d
H. d3
H. t3
Lipids (%)’
Moisture (%)
16.24
0.000
40.6(0.6)”
43.6(0.6)ab
44.7(0.8)b
45.5(o.9)b
46.7(0.4)r’=’
46.5(0.5)““
48.4(0.7)=“
49.4(0.8)’
43.3(0.6)
H. d
Protein (‘70)’
of H. tuberculara and H. discus hmnai (means (s.e.), n = 3)
SB/S Ratios’
0.3
10.0
20.2
25.0
30.4
35.3
40.0
50.2
Initial animals4
ANOVA
Protein level (%)
Table 3
Effect of dietary protein on the carcass composition
28.17
0.000
41.5(0.3)”
42.7(0.8)ab
46.0(0.4)bc
46.8(0.4)=’
49.4(0.5)‘&
50.1( l.o)de
50.2( l.l)*
51.9(0.7)”
45.1(0.8)
H. t
107.75
0.000
-3.3(0.1)”
17.2(0.4)b
34.0(2.8)=
40.9(0.6)’
38.4(0.4)cd
36.9( 1.3)cd
32.5(2.2)’
37.8( l.l)=’
H. d
50.55
0.000
1.6(0.1)”
14.9(0.9)b
26.1(0.7)cd
27.0(2.5)Cd
32.8(2.6)de
33.8(2.3)d’
35.4(0.6)’
24.3(0.7)’
H. t
Protein gain (mg/abalone)
K. Mai et al. /Aquaculture
Table 4
Comparison of the protein requirements
analysis model
Statistical model
Broken-line
analysis
Quadratic regression
analysis (X, -X,,,)
‘Weight gain.
2Protein gain.
‘Numbers in parentheses
173
136 (1995) 165-180
of abalone estimated by the broken-line
H. discus hannai
model and the quadratic regression
H. tuberculata
Based on WG’
Based on PC?
Based on WG
Based on PG
17.3%
(2765.8)’
23.3-35.6%
(4905.2)
21.6%
(10.24)
25.2-36.6%
(20.3)
17.4%
(2132.3)
22.3-32.3%
(1018.0)
27.3%
(17.5)
24.0-34.5%
(10.2)
are residual mean squares.
as a good condition index of nutritional status for abalone because it showed a very similar
pattern to that of weight gain. Statistically, SB/S ratio did not reflect the effect of dietary
protein levels on growth performance as sensitively as weight gain. The lowest SB/S ratio
was always observed for the abalone fed diet 1 (0.3% protein) and higher SB/S values
were observed for H. discus hannai fed 20-35% protein and for H. tuberculata fed 20-40%
protein. Whole soft-body lipid levels, ranging from 6.6 to 8.0% for H. discus hannai and
from 6.8 to 8.6% for H. tuberculata, steadily decreased with increasing dietary protein.
Conversely, carcass protein levels, ranging from 40.6 to 49.0% for H. discus hannai and
from 41.5 to 51.9% for H. tuberculata, showed a linear increase when dietary protein
increased from 0.3 to 50.2%.
Based on F values of ANOVA (Table 2 and Table 3), protein gains appeared to be
more sensitively affected by dietary protein levels than did weight gains. Protein gains
ranged from - 3.3 to 40.9 mg per abalone for H. discus hannai and from 1.6 to 35.4 mg
per abalone for H. tuberculata. Similarly to weight gains, maximum protein gain was
recorded for H. discus hannai fed 25% dietary protein and for H. tuberculata fed 40%
dietary protein. Based on protein gain, the protein requirements assessed by the broken-line
model were 21.6% and 27.3% for H. discus hannai and H. tuberculata, respectively
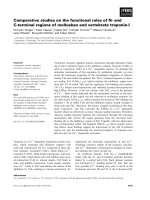
(Table 4). The second-order polynomial regression demonstrated that the minimum dietary
protein levels giving the maximum protein gains were 36.6% for H. discus hannai and
34.5% for H. tuberculata, and the lower dietary protein levels, i.e. 25.2% and 24.0% for H.
discus hannai and H. tuberculata respectively, could reduce their protein gains with 5%
likelihood.
4. Discussion
Estimates of quantitative nutrient requirements are influenced not only by the criteria
used but by the statistical methods chosen to evaluate criterion response to differing dietary
nutrient concentrations
(Zeitoun et al., 1976). In quantifying protein requirements of fish,
the most common criterion used by researchers is growth (Tacon and Cowey, 1985; Lovell,
1989). Some other criteria, such as nitrogen balance, protein efficiency ratio (PER), net
K. Mai et al. /Aquaculture
174
y=
y =
0
136 (1995) 165-180
2.6139+ 2.343 -0.032~A2 ~"2 =0.912
0.171 + 1.865x
X1=24.0%
(H. t)
0.027x”Z
RY
= 0.924
0
H.discwhm~i
A
f/. ~,&rcu,aara
Xmax=36.6%
(H. d)
Xmax=34.5%
(H. L)
Dietary protein (%I
Fig. 2. Relationship between protein gain and dietary protein level for H. discus hctnnui and H. tuberdata
as
described by second-order polynomial regression. Y,,,, maximum protein gain; Y,, a weight gain below maximum
but within 95% confidence interval; X,,,,, a protein level required for Y,,,,,; X, , a protein level associated with Y,
protein utilisation (NPU) and feed conversion efficiency (FCE) , are sometimes employed.
The reliability of the results based on the latter criteria depends strongly upon the accuracy
in determining the feed consumed. The aquatic environment makes it difficult to obtain
accurate data on feed intake of aquatic animals. Therefore, growth in terms of weight gain
is generally sensitive to the dietary protein content, and sometimes shows a more clear-cut
protein requirement level than PER, FCE, etc. (Moore et al., 1988). Because abalone eat
very slowly, using radula to scrape off particles of feed and send them into the mouth rather
than swallowing feed pellets directly as most fish do, great difficulties are encountered in
obtaining reliable data on their feed intake, particularly on artificial feeds. As a result, the
protein requirements of the juveniles of H. discus hannai and H. tuberculata were evaluated
by their growth data in the present study. Weight gain is a reliable indicator for growth as
long as the experimental variable is not expected to affect composition of gain in the animal
(Lovell, 1989). In this study, dietary protein significantly affected the carcass composition
of both abalone species (Table 3). Hence, it is generally believed that protein gain could
be a more reliable measure for true growth than weight gain, and thus more reliable estimates
of protein requirements may be yielded from the protein gain data. In the current study,
however, protein gain was still highly correlated with weight gain in both abalone species
(r = 0.99)) and very similar estimates of protein requirements were obtained from these
two types of data by the second-order polynomial regression analysis (Fig. 1 and Fig. 2).
K. Mai et al. /Aquaculture
136 (1995) 165-180
175
Different statistical methods, such as ANOVA and Duncan’s multiple range test, the
broken-line model and the second-order polynomial regression analysis, have been used to
determine the protein requirements of several species of fish (e.g. Delong et al., 1958;
Zeitoun et al., 1976; Cowey, 1979; Moore et al., 1988; Santiago and Reyes, 1991; Khan et
al., 1993). The broken-line model and the quadratic regression model employed in the
current study produced quite different estimates (Table 4). Comparing the residual mean
squares yielded from the two mathematical models (Table 4), the broken-line model
appeared to be more suitable for the data of H. discus hannai, whereas the second-order
polynomial regression analysis method seemed to be more appropriate for those of H.
tuberculatu. It may not be preferable to compare the protein requirements, which were not
assessed by the same mathematical model, between the abalone species. The observed data
(Table 2 and Table 3, Fig. 1 and Fig. 2) showed that maximum growth of H. discus ham&
was reached around 25-30% of dietary protein, and the fastest growth of H. tuberculata
was attained around 3&40% protein. Hence, the broken-line model appeared to underestimate the protein requirements of these abalone. The polynomial regression analysis shows
the advantage of being more accurate than other methods when the relationship between
dietary nutrient and growth data is curvilinear. Additionally, this method can yield nutrient
requirements for maximum and less than maximum rates of growth for both physiological
and economical considerations
(Lovell, 1989). It is believed that the second-order polynomial regression analysis gave better estimates in the present study. That is to say, on the
basis of protein gain data, the optimum dietary protein levels were 25.2-36.6% for H. discus
hannai and 24.0-34.5% for H. tuberculata. Statistically, H. discus hannai seems to have a
slightly higher protein requirement than H. tuberculata. Conversely, the observed data
indicate that H. tuberculatu may have a slightly higher requirement for protein than H.
discus hannai (Table 2 and Table 3). However, it may be premature to draw any conclusion on the different protein requirements of these two species because their initial size in
this experiment was different (Table 2). For the sake of simplification, it could be concluded that about 35% dietary protein may produce maximum growth, in terms of protein
gain, for the juveniles of both H. discus hannai and H. tuberculata, and when dietary protein
is reduced from 35 to 25% the growth of these abalone may be depressed with 5% likelihood.
The optimum level (25-35%)
of dietary protein for these abalone is lower than those
for most species of fish and crustaceans (NRC, 1983; Tacon and Cowey, 1985; Wilson,
1989). This result looks similar to those recommended by Ogino and Kato ( 1964) for H.
discus (20%)) by Uki et al. ( 1986) for H. discus hannai (2&30%),
and by Taylor ( 1992)
for H. karntschatkana (30%), but much lower than that of H. midue (47%) (Britz et al.,
1994). However, it is difficult to compare these values directly. Among the reported data
for abalone, the protein requirements of H. discus and H. midae were evaluated by using
fish meal as a sole protein source (Ogino and Kato, 1964; Britz et al., 1994). In fact, Ogino
and Kato ( 1964) obtained very different results in their three experiments. In their last two
experiments, maximum growth rates of H. discus were reached at the highest protein levels
tested (42.7% and 44.3%). For H. kamtschatkuna, the range of dietary protein level tested
was that which resulted from O-30% casein used as the sole protein source, and of these,
only 20%- and 30%-casein diets yielded positive growth (Taylor, 1992). Protein levels
above 30% have not been investigated for this abalone. Uki et al. (1986) evaluated the
protein requirement of H. discus hannai using both casein and fish meal as the sole protein
176
K. Mai et al. /Aquaculture
136 (1995) 165-180
54 -
52 -
4
0
H. discushannai
A
H. tuberculnta
50 4
48 -
+P
B
46 44 -
$0
f
P
I
42
.
25
0
I.
I
50
.I
.
.,
75
100
125
, .
.I
,
150
175
150
175
200
8.5 8.0 -
4
7.5 -
@G
7.0-
0
.
0
P
P
6.5 6.0
@
I
I
I
25
50
75
E/F’ ratio
.I
.,
100
(kJ/G
.I.
125
,
.,
ml
protein)
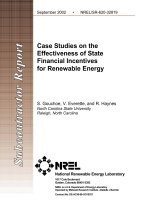
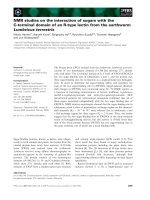
Fig. 3. Relationship between dietary energy/protein
ratio and carcass lipid and protein in H. discus hannai and H.
tuberculata. Data from Diet 1 are not depicted to simplify the graph. Error bars, f s.e.
sources, based on FCE and NPU instead of growth. Actually, weight and protein gains of
H. discus hunnai increased up to the highest protein level (43%) when fish meal was used
as the sole protein source, and maximum growth was reached at 50% of dietary protein
when casein was used as the sole protein source (Uki et al., 1986; see Uki and Watanabe,
1992 for a review). From this standpoint, our estimate is much lower than theirs. This
difference could probably be attributed to the simulation of the EAA pattern of abalone
body by using a mixture of casein and gelatin supplemented with crystalline amino acids
as protein sources in the current study. It can be seen from Table 1 that the simulation
increased the DS (degree of similarity) value of EAA pattern from 0.612 of casein and
0.802 of gelatin to 0.985 of the experimental diets. However, it is necessary to further
investigate the utilisation of gelatin by these abalone and the supplemental effectiveness of
crystalline amino acids, because it has been documented that the utilisation of gelatin or
crystalline amino acids by some species of fish and crustaceans can be very poor (Wilson
et al., 1977; Cowey and Sargent, 1979; Pieper and Pfeffer, 1980; Deshimaru, 1982; Mai et
al., 1988; Lim, 1993). However, it has been demonstrated that over 50% of crystalline
amino acids diffuse from agar gel in just a few hours (Carefoot, 1982). Leaching could be
a major problem, even though the procedure of diet preparation in the current study produces
K. Mai et al. /Aquaculttwe
111
I36 (1995) 165-180
45
1
0
25
50
7s
E/P ratios
100
0
H. discus hannar
A
H. tuberculata
125
150
17s
2M)
(kJ/g protein)
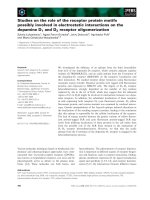
Fig. 4. Relationship between dietary energy/protein ratio and protein gain of H. discus hnnai and H. tuberculatu.
Data from Diet 1 are not depicted to simplify the graph. Error bars, f se.
good water stability of feed pellets (Mai et al., 1995). Therefore, the contribution
of the added crystalline amino acids largely depends on the first day intake in each 3 day
feeding.
The notably different performance between H. discus hannai and H. tuberculata when
both fed on Diet 1 (without protein sources added but 0.3% protein estimated) might result
from their differences in initial size, energy requirement, appetite for the ‘non-protein’ diet,
etc. The mean initial body weight of H. discus hannai was about twice as big as H.
tuberculutu (Table 2). As a result, H. discus hannui certainly required a higher absolute
amount of energy and protein for maintenance than H. tuberculata. Based on visual inspection of uneaten feed remaining in the rearing units, the approximately protein-free diet (Diet
1) apparently depressed the appetite of both abalone species. Judging from the negative
gains in both body weight and protein of H. discus hannai fed diet 1 (Table 2 and Table 3)
and the lowest gross energy level in this diet (Table l), these larger abalone obviously did
not ingest sufficient protein and/or energy to meet their maintenance requirements. In the
smaller H. tubercuhta, however, the consumed protein and energy were not only sufficient
to meet the maintenance requirements, but also produced observable growth in weight and
shell. If the ingested nutrients came completely from the artificial feed (Diet 1), H. tuberculutu appeared to consumed relatively more feed (% body weight) than H. discus hannai,
indicating that the European abalone might have better appetite to the unpalatable diet, and/
or have a higher energy requirement than the Japanese abalone. It is still unknown whether
these differences are size-dependent or species-dependent.
Though the quantity of benthic
microalgae growing on the inside surfaces of the rearing units was limited, it might be a
supplemental source of nutrients particularly for smaller abalone, which require smaller
absolute amounts of nutrients for maintenance and are better grazers of microalgae than
larger ones.
Although the moisture content of the abalone was not significantly affected by dietary
protein level, it tended to be lower when fed the diets with optimum protein levels (Table 2).
relatively
178
K. Mai et al. /Aquaculture
136 (1995) 165-180
Carcass lipid levels significantly decreased with increasing dietary protein, meanwhile,
carcass protein concentrations were significantly elevated (Table 2). Similar observations
have also been reported in some fish species (Cowey et al., 1972; Wee and Tacon, 1982;
Santiago and Reyes, 1991; Khan et al., 1993). Nevertheless, some studies illustrate the lack
of significant influence of dietary protein on body protein of fish and conclude that whole
body protein is influenced to a greater degree by dietary lipid than dietary protein (Millikin,
1982; Daniels and Robinson, 1986; Brown et al., 1992). This conclusion is largely true. In
the present study, however, all diets contained approximately 5% lipid (Table 1)) thus, the
significant difference in carcass protein content undoubtedly resulted from the progressive
substitution of dietary protein.
Millikin (1982) suggested that a shorter experimental duration may account for a lack
of differences in whole-body protein concentration of striped bass. In our opinion, the
manifestation of the effect of dietary protein on carcass protein content depends largely on
the range of dietary protein levels, or of energy/protein
ratios (E/P ratios) tested; the wider
the range, the more significant the effect. In the present study, the experimental diets
contained a wide range of protein levels (O-50%), particularly including the extreme end
of low levels (Diets 1 and 2). The corresponding range of E/P ratios was from 39.1 to
5653.6 kJ g- ’ protein, and the percentage of protein energy from 0.4 to 78.0% (Table 1) .
Apparently, the non-protein energy in low protein diets can easily be converted to lipid and
then deposited in animal tissues. Subsequently, the deposited lipid dilutes the whole-body
protein (Page and Andrews, 1973). However, low protein diets can possibly not provide
sufficient EAA for protein biosynthesis, and thus lead to lower body protein.
The relationship between E/P ratios and the carcass levels of protein and lipid (Fig. 3)
illustrates that E/P ratio is the dominant factor influencing the carcass composition of these
abalone. It can be seen from Fig. 3 and Fig. 4 that the optimum gross energy/protein
ratios
seem to be around 50-60 kJ g-’ protein in casein/gelatin-based
diets for feeding abalone
to produce maximum protein gain and higher carcass protein but lower carcass lipid. As
digestible energy in feedstuffs varies considerably with sources, digestible energy, instead
of gross energy, is preferably used to express optimum E/P ratio. At present, however,
there is no information available on digestible energy of feed ingredients for abalone. Further
experimentation is required to obtain more reliable optimum E/P ratio for abalone by using
varying levels of both dietary protein and digestible energy.
Acknowledgements
The authors would like to thank P. Crawford, University of Dublin, for use of the
Gallenkamp ballistic bomb calorimeter and B. Mannion for the preparation of the manuscript. Special thanks are due to D. Brown and Y. Mgaya for their valuable comments on
the manuscript. Part of the work was supported by Taighde MaraTeo. Kangsen Mai received
a postgraduate fellowship from University College Galway.
References
Arai, S., 1981. A purified test diet for coho salmon, Oncorhynchus
550.
kisutch, fry. Bull. Jpn. Sot. Sci. Fish., 47: 547-
K. Mai et al. /Aquaculture
136 (1995) 165-180
179
Bligh, E.G. and Dyer, W.J., 1959. A rapid method of total lipid extraction and purification. Can. J. Biochem., 37:
911-917.
Britz, P.J., Hecht, T., Knauer, J. and Dixon, M.G., 1994. The development of an artificial feed for abalone farming.
S. Afr. J. Sci., 90: 7-8.
Brown, M.L., Nematipour, G.R. and Gatlin, D.M., 1992. Dietary protein requirement ofjuvenile sunshine bass at
different salinities. Prog. Fish-Cult., 54: 148-156.
Carefoot, T.H., 1982. Gastropod nutrition. In: C.D. Pruder, C. Langdon and D. Conklin (Editors), Proceedings
of the Second International Conference on Aquaculrure Nutrition: Biochemical and Physiological Approaches
to Shellfish Nutrition. 27-29 October, 1981, Lewes/Rehoboth
Beach, Delaware. Louisiana State University
Press, Baton Rouge, LA, pp. 321-336.
Cowey, C.B., 1979. Protein and amino acid requirements of finfish. In: J.E. Halverand K. Tiews (Editors), Fin&h
Nutrition and Fishfeed Technology. Proceedings of a World Symposium sponsored and supported by EIFAC,
IUNS, Hamburg, 20-23 June 1978. Heenemann, Berlin, pp. 4-5.
Cowey, C.B. and Sargent, J.R., 1979. Nutrition. In: W.S. Hoar, D.J. Randall and J.R. Brett (Editors), Fish
Physiology, Vol. VIII. Bioenergetics and Growth. Academic Press, New York, pp. l-69.
Cowey, C.B., Pope, J.A., Adron, J.W. and Blair, A., 1972. Studies on the nutrition of marine flatfish. The protein
requirement of plaice (PIeuronecfes platessa).Br. J. Nutr., 28: 447456.
Daniels, W.H. and Robinson, E.H., 1986. Protein and energy requirements of juvenile red drum (Sciuenops
ocellatus). Aquaculture, 53: 243-252.
Delong, D.C., Halver, J.E. and Mertz, E.T., 1958. Nutrition of salmonoid fishes: VI. Protein requirements of
chinook salmon at two water temperatures. J. Nutr., 65: 589-599.
Deshimaru, 0.. 1982. Protein and amino acid nutrition of the prawn Penueus juponicus. In: CD. Pruder, C.
Langdon and D. Conklin (Editors), Proceedings of the Second International Conference on Aquaculture
Nutrition: Biochemical and Physiological Approaches to Shellfish Nutrition. 27-29 October, 1981, Lewes/
Rehoboth Beach, Delaware. Louisiana State University Press, Baton Rouge, LA, pp. 106-123.
Duncan, P.L., Dupaul, W.D. and Castagna, M., 1985. Successful use of crab meal as a supplemental food for
juveniles of the hard clam, Mercenarin mercenariu (Linne). J. Shellfish Res., 5: 34-35.
Hartree, E.F., 1972. Determination of protein: a modification of the Lowry method that gives a linear photometric
response. Anal. Biochem., 48: 422427.
Hawkins, A.J.S., Widdows, J. and Bayne. B.L., 1989. The relevance of whole-body protein metabolism to meaured
costs of maintenance and growth in Mvtilus edulis. Physiol. Zool., 62: 754-763.
Khan, M.S., Ang, K.J., Ambak, M.A. and Saad, CR., 1993. Optimum dietary protein requirement of a Malaysian
freshwater catfish, M.v~tus nemurus. Aquaculture, 112: 227-235.
Kreeger, D.A., 1993. Seasonal patterns in utilization of dietary protein by the mussel Mvtifus edulis trossulus.
Mar. Ecol. Prog. Ser., 95: 215-232.
Kreeger, K.E. and Langdon, C.J., 1992. Effect of dietary protein content on growth of juvenile Mytilus edulis
trossulus. J. Shellfish Res., 11: 554.
Lim, C., 1993. Effect of dietary pH on amino acid utilization by shrimp (Penaeus uannamei). Aquaculture, 114:
293-303.
Lim, C., Sukhawongs, S. and Pascual, F.P., 1979. A preliminary study on the protein requirements of Chums
chmos (Forskal) fry in a controlled environment. Aquaculture, 17: 195-201,
Lovell, T., 1989. Nutrition and Feeding of Fish. Van Nostrand Reinhold, New York, 260 pp.
Mai. K., Li, A. and Yin, Z., 1988. Studies on the absorption and utilization of amino acids in the test diet by the
prawn Penaeus orientalis. Acta Oceanol. Sin., 7: 621429.
Mai. K., Mercer, J.P. and Donlon, J., 1994. Comparative studies on the nutrition oftwo species of abalone, Haliotis
tuberculutu L. and Haliotis discus hannai Ino. II. Amino acid composition of abalone and six species of
macroalgae with an assessment of their nutritional value. Aquaculture, 128: 115-130.
Mai. K., Mercer, J.P. and Donlon, J., 1995. Comparative studies on the nutrition oftwo species of abalone, Hal&is
tuberculatu L. and Haliotis discus hannai Ino. III. Response of abalone to various levels of dietary lipid.
Aquaculture, 134: 65-80.
Mercer. J.P., Mai, K. and Donlon, J., 1993. Comparative studies on the nutrition oftwo species of abalone, Haliotis
tuberculata Linnaeus and Haliotis discus hmnai Ino. I. Effects of algal diets on growth and biochemical
composition. Invert. Reprod. Dev., 23: 75-88.
Millikin, M.R., 1982. Effects of dietary protein concentration on growth, feed efficiency, and body composition
of age-0 striped bass. Trans. Am. Fish. Sot., 11 1: 373-378.
180
K. Mai et al. /Aquuculture
136 (1995) 165-180
Moore, B.J., Hung, S.S.O. and Medrano, J.F., 1988. Protein requirement of hatchery-produced
juvenile white
sturgeon (Acipenser trunsmontanus). Aquaculture, 7 1: 235-245.
Nell, J.A., 1985. Comparison of some single cell proteins in the diet of the Sydney rock oyster, Saccostrea
commercinlis. Prog. Fish-Cult., 47: 110-l 13.
NRC, 1983. Nutrient requirements of warmwater fishes and shell fishes. National Academy Press, Washington,
DC, 102 pp.
Ogino, C. and Kato, N., 1964. Studies on the nutrition of abalone-B. Protein requirements for growth of abalone,
Huliofis discus. Bull. Jpn. Sot. Sci. Fish., 30: 523-526 (in Japanese with English abstract).
Page, J.W. and Andrews, J.W., 1973. Interactions of dietary levels of protein and energy on channel catfish. J.
Nutr., 103: 1339-1346.
Pieper, A. and Pfeffer, E., 1980. Studies on the comparative efficiency of utilization of gross energy from some
carbohydrates, proteins and fats by rainbow trout (S&no gairdneri, R.). Aquaculture, 20: 323-332.
Robbins, K.R., Norton, H.W. and Baker, D.H., 1979. Estimation of nutrient requirements from growth data. J.
Nutr., 109: 1710-1714.
Santiago, C.B. and Reyes, O.S., 1991. Optimum dietary protein level for growth of bighead carp (Aristichfhys
nob&) fry in a static water system. Aquaculture, 93: 155-165.
SYSTAT, 1992. Statistics, version 5.2 edition. SYSTAT, Evanston, IL, 724 pp.
Tacon, A.G.J. and Cowey, C.B., 1985. Protein and amino acid requirements. In: P. Tytler and P. Calow (Editors),
Fish Energetics, New Perspectives, Croom Helm Australia, Sydney, N.S.W., pp. 155-183.
Taylor, B., 1992. Abalone nutrition: optimum protein levels in artificial diets for Haliotis kamfschtkana.
J.
Shellfish Res., 11: 556.
Uki, N. and Watanabe, T., 1992. Review of the nutritional requirements of abalone (Haliotis spp.) and development
of more efficient artificial diets, In: S.A. Shepherd, M.J. Tegner and S.A. Guzman Del Prdo (Editors), Abalone
of the World: Biology, Fisheries and Culture, Proceedings of the 1st International Symposium on Abalone.
Fishing News Books, Blackwell Scientific Publications, London, pp. 504-517.
Uki, N., Kemuyama, A. and Watanabe, T., 1985. Development of semipurified test diets for abalone. Bull. Jpn.
Sot. Sci. Fish., 5 1: 1825-I 833 (in Japanese, with English abstract).
Uki, N., Kemuyama, A. and Watanabe, T., 1986. Optimum protein level in diets for abalone. Bull. Jpn. Sot. Sci.
Fish., 52: 1005-1012 (in Japanese, with English abstract).
Utting, S.D., 1986. A preliminary study on growth of Crassosfrea gigas larvae and spat in relation to dietary
protein. Aquaculture, 56: 123-138.
Wee, K.L. and Tacon, A.G.J., 1982. A preliminary study on the dietary protein requirement ofjuvenile snakehead.
Bull. Jpn. Sot. Sci. Fish., 48: 1463-1468.
Wilson, R.P., 1989. Amino acids and proteins, In: J.E. Halver (Editor), Fish Nutrition, 2nd edn. Academic Press,
New York, pp. 11 l-151.
Wilson, R.P., Harding, D.E. and Garling, D.L., 1977. Effect of dietary pH on amino acid utilization and the lysine
requirement of fingerling channel catfish. J. Nutr., 107: 166170.
Zeitoun, I.H., Ullrey, D.E., Magee, W.T., Gill, J.L. and Bergen, W.G., 1976. Quantifying nutrient requirements
of fish. J. Fish. Res. Board Can., 33: 167-172.