- Trang chủ >>
- Khoa Học Tự Nhiên >>
- Vật lý
A history of astronomy from 1890 to the present
Bạn đang xem bản rút gọn của tài liệu. Xem và tải ngay bản đầy đủ của tài liệu tại đây (8.83 MB, 397 trang )
A History of Astronomy
from 1890 to the Present
David Leverington
A HISTORY OF
ASTRONOMY
from 1890 to the Present
Springer
London Berlin Heidelberg New York
Paris Tokyo Hong Kong
Barcelona Budapest
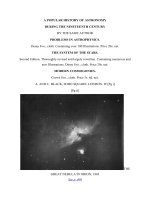
Front cover: The Great Vienna Telescope made by Howard Grubb of Dublin
in 1880 with a 27 inch (69 cm) diameter objective. For five years it was the
largest refractor in the world. The picture of the Hubble Space Telescope is
reproduced by courtesy of NASA.
ISBN-13: 978-3-540-19915-1
e-ISBN-13: 978-1-4471-2124-4
DOl: 10.1007/978-1-4471-2124-4
British Library Cataloguing in Publication Data
Leverington, David
History of Astronomy: From 1890 to the Present.
1. Title
520.904
Library of Congress Cataloging-in-Publication Data
Leverington, David, 1941A history of astronomy from 1890 to the present / David Leverington
p. cm.
Includes bibliographical references (p. ) and index.
(pbk. : alk. paper)
1. Astronomy-History-20th century. I. Title.
QB22.L481995
520'.9'04-dc20
95-12034
© Springer-Verlag London Limited 1995
Apart from any fair dealing for the purposes of research or private study, or criticism
or review, as permitted under the Copyright, Designs and Patents Act 1988, this
publication may only be reproduced, stored or transmitted, in any form or by any
means, with the prior permission in writing of the publishers, or in the case of
reprographic reproduction in accordance with the terms of licences issued by the
Copyright Licensing Agency. Enquiries concerning reproduction outside those
terms should be sent to the publishers.
Contents
Preface .......................................................... ... .....................
ix
Introduction ..........................................................................
xi
1 • The Sun ......... .. .......................... ............................ .. ...
1
Early Work ............................................................................
The Temperature of the Sun and its Generation of Energy..... ... .....
The Corona ............................................................................
Sunspots and the Disturbed Sun ...............................................
The Quiet Sun and the Interplanetary Plasma ..............................
The Solar Constant..................................................................
The Solar Spectrum .................................................................
1
6
9
11
15
18
22
2 • The Moon .............. .. ...................................................
23
Early Work ..................... ........... ....... ....... .......... ........ ............
The Surface ........................................................................ ....
The Origin and Subsequent History of the Moon .........................
23
26
29
3 • The Origin of the Solar System ............................... 31
Early Theories ........................................................................
Collisions and Close Encounters .............. ..................................
Condensing Nebulae Re-examined ............................................
31
33
35
4 • The Terrestrial Planets..............................................
37
Mercury ................................................................................
Venus ................................................. ..................................
The Earth ..................................................... .........................
Mars .....................................................................................
37
42
46
53
5 • The Gas Giants ..........................................................
62
Jupiter ............................ .. ................ .. ..................................
Saturn....... ....... ................... ......... ....... ........ .......... ........ ........
62
71
Uranus ..................................................................................
Neptune ................................................................................
80
87
6 • Small Bodies of the Solar System ............................ 96
Pluto .................................................................................... 96
The Asteroids......................................................................... 103
Comets ................................................................................. 109
Meteorites ............................................................................. 118
7 • Stellar Evolution and Stellar Structures .................. 120
Early Work ............................................................................
The Luminosity of Stars ...........................................................
The Harvard Classification .......................................................
Initial Evolutionary Ideas .........................................................
Ionisation and the Abundance of Hydrogen in Stellar
Atmospheres .........................................................................
The Surface Temperature of Stars ..............................................
The Internal Structure of Stars ..................................................
The Source of Energy in Stars ...................................................
The MKK and BCD Classification Systems ..................................
Later Evolutionary Ideas ..........................................................
Stellar Populations ..................................................................
120
125
126
128
133
135
136
141
145
148
152
8 • Variable and Double Stars ....................................... 154
Early Work ............................................................................
Short Period Variables .............................................................
Long Period Variables ..............................................................
Irregular Variables ....................................................... ...........
Flare Stars .............................................................................
Eclipsing Binaries ....................................................................
Non-Eclipsing Binaries.............................................................
154
159
162
163
164
165
169
9 • Young Stars, Old Stars and Stellar Explosions ....... 171
Young Stars ...........................................................................
Pulsars ..................................................................................
Novae and Supernovae............................................................
Black Holes ............................................................................
171
173
178
204
10 • The Milky Way ........................................................ 208
Early Work ............................................................................
Dimensions and Structure ........................................................
The Interstellar Medium...........................................................
Nebulae in the Milky Way........................................................
vi
208
211
221
226
11 • Galaxies .................................................................... 230
The Nature and Distance of Spiral Nebulae .................................
Red Shifts ..............................................................................
Quasars .. .... .......... .......... ......................................................
Dwarf Galaxies .......................................................................
Galactic Evolution ...................................................................
230
236
237
246
247
12 • Cosmology ............................................................... 252
Early Cosmological Theories .....................................................
Revisions to the Hubble Constant..............................................
The Microwave Background Radiation .......................................
The Missing Mass ...................................................................
252
253
256
257
13 • Optical Telescopes and Observatories ................... 259
Early Telescopes .....................................................................
Early Observatories .................................................................
The Transition to Reflectors ......................................................
The Harvard College Observatory .............................................
Mount Wilson ........................................................................
Palomar Mountain and the 200 inch ...........................................
Schmidt Telescopes .......... ........ .......................... .....................
South Africa...........................................................................
Kitt Peak ... ........................ ........ ........ ....................................
The Multi-Mirror Telescope ......................................................
Mauna Kea ............................................................................
La Palma ...............................................................................
The Anglo-Australian Observatory ............................................
The European Southern Observatory .........................................
259
261
263
264
267
270
272
273
274
275
276
278
279
280
14 • Tools and Techniques ............................................. 283
Photography ..........................................................................
Spectroscopy ..........................................................................
Photometry ............................................................................
Other Tools and Techniques .. ...................................................
283
290
296
304
15 • Radio Astronomy .................................................... 310
Early Radio Astronomy............................................................ 310
Radio Telescopes ............ ........................................................ 314
16 • Space Research ........................................................ 320
Introduction ...........................................................................
Results from Early Sounding Rockets .........................................
Sputniks and the Formation of NASA ........................................
The Race to the Moon ..............................................................
Early Solar Plasma Research .....................................................
vii
320
320
322
324
326
Missions to the Terrestrial Planets .............................................
Pioneers 10 and 11 ..................................................................
Voyagers 1 and 2 ....................................................................
The Halley Intercepts ..............................................................
Orbital Observatories ..............................................................
327
331
333
339
341
17 • Modern Astronomy in Context .............................. 355
Introduction ...........................................................................
1890-1914 ..............................................................................
1914-1939 ...... : .......................................................................
1939-1970 ..............................................................................
1970 to the Present..................................................................
355
355
356
357
358
References and Further Reading ................................................
Units ....................................................................................
General Abbreviations Used .....................................................
The Greek Alphabet .................................................................
Subject Index .........................................................................
Name Index ...........................................................................
361
viii
364
366
367
369
379
Preface
The history of astronomy is, like most history, a multidimensional
story, and when writing about a specific period, the author has to
decide how to handle all the developments of earlier times in order
to set the scene. I have done this by starting most chapters of the
book with a summary of astronomical knowledge at the beginning
of our chosen period, together with a brief review of how such
knowledge had been gained. This story is not only interesting in
itself, but it will also assist those readers that would appreciate a
brief reminder of some of the basic elements of astronomy.
It is also necessary to decide when to start our history. Should it
be the year 1900 or 1890, or should it be linked to some key
development or investigation, e.g. the discovery of the electron by
J. J. Thomson in 1897, or the discovery of spectroscopic binary stars
by Pickering and Vogel (independently) in 1889, or maybe the year
1890 in which Thomas Edison tried unsuccessfully to detect radio
waves from the Sun and Johannes Rydberg published his formula
for atomic spectra?
I have, in fact, decided to start this history at about 1890, as it was
the year of publication of the Draper Memorial Catalogue of stellar
spectra which, together with its updates, provided essential data for
the understanding of stellar spectra until well into the twentieth
century. This date also gives a clear hundred years up to the present.
As astronomy is such an enormous subject, I have described
progress in each of the main subject areas of the Solar System, the
Stars and the Galaxies sequentially, rather than try to paint the
developing picture in all these areas together. Then follow parts on
the development of Instruments, Facilities and Techniques mainly
in the guise of Telescopes, Radio Astronomy and Space Research.
It is not practical, in one volume, to describe all the developments
in astronomy over the last one hundred years, and so some
selection of material is inevitable. My aim is to give an outline of
developments, and enable those who wish to investigate the
subject further, to do so by consulting the books listed at the end.
This book is written for the reader with a basic understanding of
astronomy, but if I have failed to convey the story clearly enough in
some areas, I would be grateful to receive any suggestions for
improvement.
I would like to express my special thanks and appreciation to
Alan Cooper, Roger Emery, Mike Inglis and Stuart Clark who had
the kindness and patience to read the text and suggest modifications of both fact and style, to make the book more accurate and
readable. If there are any errors of fact, misinterpretation or
misrepresentation remaining, however, they are entirely mine and
I apologise in advance.
Finally, in any project of this nature, the pressure does not stop
with the writer, and this book would not have been completed
except for the patience and encouragement of my wife Chris. She
deserves an extra vote of thanks, for putting up with me and piles of
books and papers all over the house, during the time that it has
taken to turn this book into a reality.
x
Introduction
Astronomy is the oldest and most fundamental science. It attempts
to explain not only what the Universe is today and how it works,
but also how it started (if indeed there was a starting point), how it
evolved to the present day and how it will develop in the future.
Astronomy is also about a Universe that can be seen, free of
charge, by anyone who cares to glance at the night sky, weather and
light pollution permitting. Can anyone looking at a really dark sky,
girdled by the Milky Way, not be impressed by what he sees, and
wonder how we on our small insignificant planet fit into all of this?
For many centuries man has observed the heavens and has tried
to explain what he sees. To us, with the benefit of hindsight, a great
many of the explanations are obvious, but in the past, many
excellent astronomers have held ideas which seemed logical to
them, but now seem strange to us. For example, William Herschel,
one of the greatest astronomers of all time, believed, at the end of
the eighteenth century, that the surface of the Sun was dark
underneath its bright atmosphere, and that it could be inhabited by
living beings. It was only in the mid nineteenth century that it was
realised that the Sun was gaseous throughout, and it required the
advent of atomic physics in the twentieth century to explain how
the Sun generates its heat.
There is no reason why many of our own theories should not be
inaccurate, or even wrong, of course, and it is interesting to
speculate how our knowledge of today may appear in time to come.
Will the Big Bang theory have been abandoned, and will black holes
have been shown to be just a figment of our imagination? Most
astronomers think not, but who knows?
The twentieth century, for so long synonymous with progress
and modern thinking, has but a short way to go before it becomes
the last century. It seems an appropriate time, therefore, to review
what has happened in the science of astronomy over the last
hundred years or so. A period in which travel and communications,
for example, have been revolutionised by scientific discoveries and
technological developments which appear to be occurring at an ever
increasing rate.
We tend to think of the period in which we live as completely
different from any other because of this fast rate of progress. Yet
this same feeling is prevalent in many astronomy books written
over the last hundred years, and for many years before then. In
1881, for example, Edmund Ledger wrote (Reference 1) "The
progress of astronomical science during the last five-and-twenty or
thirty years has been so rapid as almost to approach the marvellous." We are tempted to wonder what the situation will be 100
years from now. Looking backwards in time may help us to get
some perspective. Who knows what radical new theories are just
around the corner, and what theories that we think secure today
will turn out to be wrong in the future?
A hundred years ago, Newtonian physics ruled supreme.
Planck's Quantum Theory, Einstein's Theory of Relativity and
Heisenberg's Uncertainty Principle did not exist. The photographic
plate and spectroscopy were still relatively modern developments;
radio astronomy and space research were both some decades in the
future. What did people know, or rather not know, about the
Universe and how has this knowledge developed since then? That
is the story of this book.
xii
1
-
The Sun
Early Work*
Sunspots, Prominences and the Disturbed Sun
As long ago as the early seventeenth century, the famous Italian astronomer
Galileo Galilei had discovered that the Sun was rotating on its axis by
observing the motion of sunspots across the Sun's disc. In 1859 Richard
Carrington, an English amateur astronomer and son of a wealthy brewer,
found that the surface of the Sun was rotating faster at the equator than at
middle latitudes. This was correctly interpreted by the Jesuit priest and
astronomer, Angelo Secchi, as showing that the Sun was gaseous.
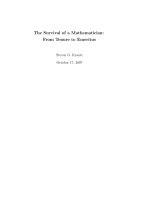
Close observation of the surface of the Sun showed that, not only was it
speckled with sunspots (Figure 1.1), but it had a generally granulated
structure which gave the appearance of bright clouds over a darker
substrate. Sunspots were thought, by some astronomers, to be nothing
more than holes in the bright photosphere through which this darker
substrate could be seen. The problem was that the lower layers of the Sun
ought to be hotter and lighter than the surface, rather than darker. Herve
Faye, of the Ecole Poly technique, sidestepped this problem by proposing
that a sunspot is a whirlpool, sucking into it cooler and hence darker gases,
mainly hydrogen, from the outer regions of the Sun. There did not appear
to be any vorticular motion around the sunspots, however, so Secchi
suggested in 1872 that matter was ejected from the Sun at the edges of the
spot. This matter then cooled and fell back into the centre of the spot,
producing its dark central region.
Large loops and filaments of rapidly moving gas, were seen at the edge of
the Sun during total solar eclipses. These prominences, as they were called,
*Sections headed "Early Work" outline the state of knowledge in about 1890.
Figure 1.1 Drawing of the Sun made in 1870 by Tacchini at Palermo showing
sunspots and bright markings, or faculae. (From Memoirs of the Italian Spectroscopical Society, Vol. vi.)
had first been seen in 1733, but it was not until 1860 that they were proved to
be connected with the Sun, rather than the Moon, when it was observed
that they did not follow the Moon as it crossed the solar disc during an
eclipse. But what were the prominences?
P. Jules Janssen, a French astronomer working at Meudon Observatory
near Paris, went to India to observe the total solar eclipse of 18th August
1868, where he was able to examine the spectrum of a large prominence
visible at totality. He and other eclipse watchers found that the spectrum
consisted of a number of bright hydrogen lines (see Section 14.2), showing
for the first time that prominences consisted of hot hydrogen gas. They also
found, in the same spectrum, a bright yellow line that was initially taken to
be the D line of sodium, but which was afterwards found to be of a slightly
different wavelength. Janssen decided to see how long after totality he
could see these bright prominence lines, finding, much to his surprise, that
they could still be seen when the eclipse was completely over.
Independently, 2 months later, J. Norman Lockyer in England also found
that he could see the bright line spectrum of prominences in full sunshine,
something that he had long suspected should be possible and, by a strange
coincidence, the notification of his discovery reached the French Academy
of Sciences on the same day as that of Janssen. Lockyer also saw the yellow
line in the prominence spectrum, suggesting that it was due to a new
element which he called helium, after helios, the Greek word for the Sun.
Not all astronomers accepted that this yellow line was due to a new
element, however, and in 1890 the origin of the line was still unresolved.
The most spectacular (or eruptive) prominences were seen to be con2
nected with sunspots, whereas the more cloud-like prominences were
associated with faculae, or very bright markings, on the surface of the Sun
(they can be seen near the edge of the Sun in Figure 1.1). The eruptive
prominences contained hydrogen, helium and various metallic elements, of
which iron, titanium, calcium, barium, strontium, sodium and magnesium
were the most evident, whereas the cloud-like prominences, associated
with faculae, consisted almost entirely of hydrogen, helium and calcium.
Sunspots tended to occur in zones from about 10° to 40° latitude on either
side of the equator and were rarely seen outside these zones, whereas
faculae were seen at any latitude.
Over a period of 6 months in 1852, Edward Sabine in England, Rudolf
Wolf in Switzerland and Alfred Gautier in France independently concluded
that there was a strong correlation between the occurrence of large sunspots
and disturbances in the Earth's magnetic field (and the visibility of the
aurora borealis). The actual mechanism for the link between the Sun and
these disturbances was unknown, although the existence of such a link
indicated that sunspots may be connected with electric disturbances on the
Sun.
In the late eighteenth century, the great English astronomer William
Herschel had suggested that the heat output of the Sun should be increased
when there were many sunspots, and he attempted to find a correlation
between sunspots and the Earth's weather. In the absence of good
meteorological data, he tried to correlate sunspot numbers with the price of
wheat, which should depend on the weather, but with no success. In 1843
Heinrich Schwabe of Dessau in Germany discovered that the number of
sunspots on the Sun varied with a period of about 10 years. Rudolf Wolf
then showed, by looking through historical records, that the average period
between maxima was about 11.1 years, but with a range varying from 7 to 17
years. The reason for this sunspot cycle was unknown, and no-one was able
to detect any associated variation in the solar heat output. There continued
to be much speculation about a possible link between sunspot numbers and
the Earth's weather, although there was little evidence of an 11 year
weather cycle. Although no such weather cycle could be found, E. Walter
Maunder at Greenwich did find that sunspots had been virtually nonexistent between 1645 and 1715, coinciding with a period of relatively cold
winters in the Earth's northern hemisphere. No other correlations of
sunspots with the weather were known.
Carrington found that the solar latitudes at which sunspots were seen
gradually changed over the 11 year sunspot cycle, starting at about 30° to 40°
latitude immediately after sunspot minimum, and gradually reducing as the
cycle progressed. Sunspots were at about 15° latitude when the cycle went
through its maximum, and at about 6° latitude when the minimum of the
cycle was reached. After the minimum, sunspots then started to appear at
mid latitudes once more.
The spectrum of the Sun as a whole was known to consist of a bright
continuous spectrum, crossed by numerous dark lines called Fraunhofer
absorption lines, after the German physicist Joseph Fraunhofer who first
3
investigated them in the early nineteenth century (see Section 14.2). Gustav
Kirchhoff, working in Heidelberg, published the first analysis of these
Fraunhofer absorption lines in the solar spectrum in 1861. Then, 5 years
later, Lockyer discovered that these absorption lines were often broader for
light coming from sunspots than for normal sunlight, because the material
in sunspots is in more rapid motion than for the remainder of the Sun. There
were also very sharp bright lines in the middle of the hydrogen and calcium
absorption lines for light coming from sunspot areas. These bright lines
were generally attributed to high layers of hot gas above sunspots.
The Quiet Sun
Charles Young, who was professor of Astronomy at Princeton, New Jersey,
discovered a most remarkable effect when he observed the limb of the Sun
through his spectroscope during the total solar eclipse of December 1870. At
the moment when the Moon cut off light coming from the visible disc of the
Sun, the previous bright continuous solar spectrum with dark absorption
lines was replaced instantaneously by a bright line emission spectrum. The
bright lines were in apparently the same places as the previous dark ones.
This "flash spectrum", as it was known, was seen for only a second or two,
disappearing when the Moon covered the thin "reversing" layer that
generated these bright lines just above the visible surface of the Sun. Clearly
the hot gas of the reversing layer was emitting a bright line spectrum in its
own right but, as it was cooler than the surface of the Sun, it also absorbed
these same wavelengths from the light emitted by the surface, causing the
Fraunhofer absorption lines in the normal solar spectrum.
So the lowest level that can be seen on the Sun was known to be the
compressed gas of the hot photosphere which gives the continuous part of
the solar spectrum. Above that is the cooler reversing layer, which produces
most of the Fraunhofer absorption lines, then comes the chromosphere and
prominences and, finally, the corona and the zodiacal light, which are
discussed below.
By 1890 it was known that hydrogen, calcium, magnesium, carbon,
sodium, iron, titanium and various other metals, making a total of 34
elements, were present in gaseous form in the reversing layer, and that
hydrogen, helium and calcium were present in the chromosphere. The
proportions of the elements in the various layers of the Sun were unknown,
although it was assumed that the layers of the Sun were cooler the further
from the centre they were, with the corona being the coolest part of all.
The bright solar corona, which was seen to surround the Sun during total
solar eclipses, was known to extend for millions of kilometres from the Sun,
but in the words of Professor Young (Reference 2), little was known about it
other than it was "an inconceivably attenuated cloud of gas, fog, and dust,
surrounding the Sun, formed and shaped by solar forces". During the total
solar eclipse of 1868 the corona was seen to have a faint continuous
spectrum, indicating that it was scattering sunlight, and this was confirmed
by Janssen in 1871 when he found faint Fraunhofer absorption lines in its
4
continuous spectrum. In the meantime, during the total solar eclipse of 7th
August 1869, the Americans Charles Young and William Harkness had
independently discovered a bright green spectral line in the corona,
indicating that the corona was also self-luminous. The bright green line was
thought to be due to iron.
The presence of the heavy element iron in the corona provided a major
problem, as astronomers generally believed that the heavy elements like
iron were only in the lower reversing layer of the solar atmosphere, with the
cooler, more tenuous higher layers containing only the lighter elements. In
1876 Young showed that the line of iron in the laboratory was a doublet,
while the coronal line was single, casting doubt on the cause of the coronal
line, although in 1890 most astronomers still thought that the line was due
to iron.
The two total solar eclipses of 1889 proved that the solar corona is more
uniform in shape at times of solar maximum than at times of solar
minimum. Sometimes, in the latter case, the corona could be seen to extend
up to 15 million km from the Sun, in the plane of the Sun's equator.
The zodiacal light is seen just after sunset, or just before sunrise, as a faint
band of light which is brightest near to the horizon. Nineteenth century
astronomers concluded that it was aligned along the ecliptic, and that it
extended from the Sun to beyond the Earth's orbit. Giovanni Cassini, the
director of the Paris Observatory, had suggested that the zodiacal light was
due to a very large cloud of dust-like particles, but others, including the
French mathematician Pierre Laplace, had thought that it was due to a very
tenuous gas. Neither theory was proven.
The Colour and Temperature of the Sun
One of the biggest problems facing astronomers in 1890 was the lack of a
coherent theory of radiation to enable them to understand the Sun and
stars. (Wien's black body radiation law, for example, relating the wavelength of peak energy output to temperature, was not discovered until
1893).
In 1879 it was found experimentally by the Austrian physicist Joseph
Stefan that the total radiation energy output for a perfect emitter (or "black
body") is proportional to the fourth power of its absolute temperature. This
was a major step forward in the theory of heat, and it limited the wild
guesses of the surface temperature of the Sun produced in previous
decades. In order to produce an accurate estimate of the surface temperature of the Sun, however, it was necessary to know how much energy was
absorbed by both the solar and Earth's atmospheres.
The Sun was known to appear brighter at the centre than the edge, and
this was attributed to the absorption of the Sun's atmosphere. Hermann
Vogel in Germany, and Samuel Langley and Edward Pickering in America
independently estimated this absorption from measurements made at
various wavelengths at a number of points across the solar disc. These
indicated that the Sun's atmosphere absorbed significantly more blue light
5
than red, leading to the belief that the surface of the Sun was both brighter
and bluer than it appeared to be.
The French astronomer Jules Violle studied the absorption of the Earth's
atmosphere in 1875, comparing sea level measurements of the Sun with
those taken from the summit of Mont Blanc. A few years later, Langley
analysed similar measurements made from the summit of Mount Whitney
in the United States. These studies indicated a preferential absorption of
blue light by the Earth's atmosphere, leading to the conclusion that the Sun
would look distinctly blue, and be three or four times brighter, if the solar
and Earth's atmospheres were removed. The surface temperature of the
Sun was then estimated to be about 10,000 K*.
The Generation of Heat
The biggest question about the Sun that exercised the minds of nineteenth
century astronomers was, how does the Sun generate its heat? It was
known that the Sun could not generate enough heat by mere combustion,
as this would have allowed it to exist for only a few thousand years. So how
could the Sun have produced heat and light for at least the age of the Earth,
which was thought to be measured in hundreds of millions of years?
The generally accepted theory was first proposed by the Scottish engineer
John Waterston, who suggested that the Sun was generating heat by its
gravitational contraction. His idea was developed by Hermann von Helmholtz in 1854, who calculated that the reduction in diameter required to
produce its present heat output was about 75 m per year, but even this
mechanism could only have kept the Sun producing heat at the required
level for something like 25 million years. Unfortunately, this did not seem to
be long enough, as geological analysis of the surface of the Earth indicated
that the Earth had been receiving heat from the Sun for much longer than
that.
So the 1890 astronomers had a problem. Were Helmholtz's calculations
correct, or was there a completely different mechanism which had not been
discovered that could have provided the Sun's heat for a much longer time?
Was the Earth really much older than 25 million years? The answers to these
questions were uncertain in 1890, although most geologists were convinced
that the answer to the last question was "yes".
The Temperature of the Sun and its Generation of
Energy
The temperature of the Sun had been estimated by 1890, using the StefanBoltzmann law of radiation, as about 10,000 K. In 1893 Wien showed that
*Temperatures are generally quoted in kelvin, abbreviated to K. They are degrees
above absolute zero, which is -273°C.
6
the wavelength of the maximum energy radiated from a perfect black body
is inversely proportional to its temperature, and this enabled a much more
accurate estimate of the solar temperature to be made of 6,000 K.
The American engineer James Homer Lane and the German physicists
Arthur Ritter and Robert Emden, like many other researchers, had assumed
that heat was transported from the interior to the exterior of the Sun by
convection, but in 1894 the British astronomer R. A. Sampson suggested
that the primary mechanism in the Sun's atmosphere was radiation. Karl
Schwarzschild, the director of Gottingen Observatory, then used this
concept to explain the limb darkening of the Sun. Arthur Eddington (Figure
1.2) working at Cambridge University extended the concept of radiative
equilibrium to the internal structure of the Sun and stars (see Section 7.7)
and deduced, in 1926, that the Sun's central temperature was a startling 39
million K.
Cecilia Payne, in her doctoral thesis at Harvard, made the revolutionary
proposal that hydrogen and helium were the main constituents of the
atmospheres of the Sun and stars. Her suggestion was not immediately
accepted and she met with some resistance, until Albrecht Unsold, a young
German astrophysicist working at the Mount Wilson Observatory, persuaded Henry Norris Russell of Princeton University that hydrogen was
present in the solar atmosphere in enormous quantities. Russell, whose
views were widely respected, published his definitive paper on the subject
in 1929, concluding that hydrogen was the main constituent of the solar
atmosphere. Three years later, Eddington concluded that hydrogen was the
main constituent in the Sun as a whole. This required modifications to
Figure 1.2 Pioneering astronomers of the 1920s taken during an International
Astronomical outing to Plymouth, Mass. in 1932. left to right: A. S. Eddington, J. S.
Plaskett, W. S. Adams, J. H. Oort, H. N. Russell, H. Shapley, W. K. Miller, F. W.
Dyson, F. Slocum and B. Lindblad. (Courtesy Sky and Telescope Magazine.)
7
Eddington'S estimate of the central temperature of the Sun, which he
reduced to 19 million K in 1935.
In the nineteenth century the best theory of energy production in the Sun
was the Waterston-Helmholtz contraction theory described above, but this
could only explain a solar lifetime of about 25 million years or so, which
even at that time appeared to be too short.
Eddington suggested two alternative mechanisms for energy generation
in the Sun in 1920, based on Ernest Rutherford's and Francis Aston's recent
research into atomic structure at Cambridge University. Energy could be
produced either by the mutual annihilation of protons and electrons, or
when hydrogen atoms fuse to make helium atoms and atoms of higher
mass. The Sun could go on shining using either process for billions* of
years. Then, in 1938, Hans Bethe in America and Carl von Weizsacker in
Germany independently proposed a fusion theory that was so convincing
that the alternative mass annihilation theory rapidly fell out of favour. They
suggested that solar energy is produced by hydrogen nuclei being transformed into helium nuclei, with carbon as a catalyst (see Section 7.8), and
Bethe estimated that the central temperature of the Sun would be 18.5
million K, assuming a composition by weight of 35% hydrogen. This was
virtually identical with Eddington's estimate of 19 million K, which was
based on gas dynamics and was independent of the energy-production
process. Bethe also estimated that the Sun would continue to produce
energy for another 12 billion years.
Further work has shown that these estimates of the core temperature of
the Sun were somewhat too high, and a more likely temperature of 15
million K was established. This in turn meant that the proton-proton cycle
proposed by Charles Critchfield (see Section 7.8) is dominant in the Sun,
rather than the carbon cycle assumed by Bethe and von Weizsacker.
In 1931 the distinguished Austrian physicist Wolfgang Pauli had proposed the existence of a massless particle, called a neutrino, to explain the
conservation of energy in a nuclear process called beta decay, but it was not
until the 1950s that the first concrete evidence was found for the existence of
the neutrino. At this time the possible nuclear processes in the Sun were
also being analysed in more detail, and it was shown that there were three
different proton-proton (PP) reactions contributing to the Sun's energy.
Although most of this energy is emitted by the Sun in the form of
electromagnetic radiation (like light), a small amount is carried away by
neutrinos, so in the early 1960s Raymond Davis of the Brookhaven National
Laboratory decided to try to measure these neutrinos to check on the theory
of energy generation. But how could these neutrinos be detected?
Theory showed that if neutrinos with a minimum energy of 0.81 MeVt
react with the isotope chlorine 37 they will produce argon 37. Unfortun-
*1 have used the American definition of billion as 1,000 million in this book, with
apologies to British traditionalists, as this is now the general practice in astronomy.
tMillion electron volts. 1 MeV == 1.6 x 10- 13 J.
8
ately, of the three PP reactions in the Sun, only the so-called PP III reaction
produced neutrinos with energies significantly above this 0.81 MeV threshold, and this reaction was expected to be the rarest of the three in the Sun.
Nevertheless, in 1967 the Brookhaven National Laboratory commissioned a
neutrino detector which consisted of an 85,000 gallon (380,000 litre) tank of
dry-cleaning fluid, perchloroethylene, to detect these PP III neutrinos, by
measuring the amount of argon produced. The tank was large as the
number of neutrinos expected to be detected was very small (only about one
every three days even with this tank), and it was placed deep underground
in the Homestake gold mine in South Dakota to reduce spurious signals
from energetic cosmic rays.
Early results produced by Davis showed a neutrino flux that was too low
but, as it was close to the detection limit of the system, improvements were
made in 1970 to allow more accurate results to be produced. These
confirmed that the number of neutrinos was too low by at least a factor of
two. One possibility was that there was something wrong with Davis'
equipment, but his results were confirmed in the late 1980s by Kamiokande
II, which was a different type of detector located in the Japanese Alps.
Even today the discrepancy between the observed and expected flux of
neutrinos coming from the Sun has not been satisfactorily explained. It is
expected that the cause of the problem will be some subtle twist in the
theory of neutrinos or in the theory of energy generation and transfer
through the Sun. But it would not be the first time in history that an
apparently small nagging inconsistency between theory and experiment
has resulted in the major modification, or even abandonment, of a major
theory which is convincing in so many other respects - in this case the
theory of energy generation in the Sun and stars.
The Corona
Young and Harkness had discovered a bright green emission line in the
spectrum of the Sun's corona in 1869, which was thought to be due to iron.
In 1898, however, it was shown that the wavelength of this coronal line was
530.3 nm, * and not 531. 7 nm as previously measured. No known terrestrial
line fitted this new wavelength, and so a previously unknown element
called coronium was proposed as the cause. Early in the twentieth century,
this was becoming a more and more unlikely possibility, as the gaps in the
periodic table of the elements were filled.
Ira Bowen, of the California Institute of Technology (Caltech), had solved
a similar problem with emission lines in nebulae in 1927, when he found
that they were caused by ionised oxygen and nitrogen which made what are
*Nanometres. 1 nm
=
10- 9 m or 10
A.
9
called "forbidden transitions". * Similar explanations failed with the coronal
line which, by now, had increased to 19 different lines. None of these lines
could be explained.
In the early twentieth century, astronomers assumed that the Sun was
hottest in the centre, becoming cooler as the Sun and its atmosphere was
traversed all the way out to the corona. Mitchell's work on the flash
spectrum of the Sun in the early part of this century showed, however, that
the solar atmosphere was more ionised the further it was from the surface.
Using Bohr's theory of the atom (see Section 14.2), this seemed to indicate
that the higher layers of the atmosphere were at a higher temperature. The
Bengali physicist Megh Saha showed in 1920, however, that high ionisation
can also be explained by low gas pressure and, as the gas pressure in the
corona was known to be low, the concept of the temperature of the Sun's
atmosphere decreasing with increasing height returned. The corona, which
surrounds the atmosphere, was still thought to be cool, but not for long.
Walter Grotrian, of the Potsdam Astrophysical Observatory, concluded
in 1934 that the coronal temperature must be an astonishing 350,000 K, in
order to explain its spectrum. Then, 3 years later, Grotrian read a report by
the Swedish physicist Bengt Edlen describing the emission spectra of iron
atoms stripped of nine or ten of their electrons by high voltage sparks.
These spectra could explain two of the coronal lines, so he wrote to Edlen
explaining his idea, suggesting that Edlen looked into the matter further.
Edlen sent a polite reply, but didn't investigate Grotrian's suggestion.
Grotrian decided, in 1939, to go into print with his ideas, and this
persuaded Edlen to check through his unpublished spark spectra, where he
found that calcium atoms, stripped of 11 or 12 of their electrons, appeared to
produce two more of the coronal lines. After further work, he finally found
that 13 times ionised iron atoms produced the intense 530.3 nm coronal line.
So, in 1941, Edlen concluded that the coronal lines are produced by highly
ionised iron, calcium and nickel atoms, in a corona with a temperature of at
least 2 million K, but how such a temperature could be produced when the
photosphere had a temperature of only 6,000 K was a mystery. In 1963
Herbert Friedman and his team at the American Naval Research Laboratory
recorded the X-ray spectrum of highly ionised iron in the solar corona
confirming Edlen's conclusion.
Observations of the corona in the nineteenth century had showed that it
*When an atom is excited, one of its electrons goes from a low energy state to a high
energy state. It usually stays in the latter for a very short period of time (typically
about 10-8 s), before it spontaneously reverts to a lower energy state, releasing
energy. Some atoms have some energy states with very long lifetimes (the so-called
metastable states), and, in laboratory conditions, these atoms lose energy by
collision with other atoms, before they have had time to spontaneously lose energy.
In the very tenuous gas of a nebula, however, the collision frequencies are very low,
and such atoms lose energy spontaneously by so-called "forbidden transitions"
from the metastable states, thus producing emission lines not observable in
laboratory conditions.
10
appeared to emit a continuous spectrum with Fraunhofer absorption lines,
in addition to the emission line spectrum discussed above. It was thought
that this continuous spectrum was due to sunlight scattered by particles in
the corona, but it could have been produced by sunlight being scattered in
the Earth's atmosphere. It was not until the early twentieth century that the
coronal origin was proven.
Sunspots and the Disturbed Sun
Charles Young discovered in 1892 that, at very high dispersions, many
absorption lines in the sunspot spectrum appeared to have a sharp bright
line in their centre. Shortly afterwards, the Dutch physicist Pieter Zeeman
showed, in the laboratory, that spectral lines can be split into two when they
originate in the presence of a magnetic field, with each of the lines
oppositely polarised.
In 1908, George Ellery Hale and Walter Adams found, at the Mount
Wilson Solar Observatory, that photographs of the Sun taken in light of the
656.3 nm hydrogen line showed patterns around sunspots that looked like
iron filings in a magnetic field. Hale wondered if the patterns could be
caused by magnetic fields associated with sunspots. If so, maybe the Young
effect, mentioned above, could be caused by Zeeman splitting of the
absorption lines. To check on this, Hale examined sunspot spectra, after the
light had been passed through a polariser, and found that the two
components of the spectral line pairs had opposite polarisations, confirming that they were caused by Zeeman splitting in a magnetic field. By
comparing the splitting of the spectral lines with those produced in the
laboratory, he was also able to estimate the magnitude of the magnetic fields
associated with the sunspots as about 3,000 gauss, or 10,000 times that of
the Earth's magnetic field measured at the surface of the Earth.
Hale and his colleagues at Mount Wilson started monitoring the polarities
of sunspots, hoping to find a pattern, but they found spots of both polarities
on both sides of the equator. They then noticed that the spots generally
occurred in pairs, with one spot of the pair almost always having a different
polarity to the other. In addition, the sunspots that were in the lead of the
pair as they moved across the disc, the so-called preceding or p spots, were
all found to have the same polarity in one hemisphere, but the opposite
polarity in the other hemisphere. This pattern was well established by 1912,
when the observers at Mount Wilson noticed that the polarities of the p
spots had reversed in both hemispheres at the solar minimum that year.
Hale had used the new 60 ft (20 m) high solar tower telescope to discover
the magnetic fields in sunspots and, on the strength of that work, he had
obtained funding from the Carnegie Institution for an even larger tower
telescope (see Section 13.5). This new telescope came into operation just
after the polarity reversal had been discovered. Armed with these two
magnificent instruments, Hale and his staff continued to monitor sunspot
polarities, expecting them to reverse again, possibly at the solar maximum
11
expected in 1917. No change was observed at that maximum, and so the
next solar minimum, expected in 1922, was awaited with great interest. On
24th June 1922, a single spot of the new cycle was found by Ferdinand
Ellerman, one of Hale's colleagues, to have a reversed polarity. (Single spots
normally have the polarity of a lead spot). The evidence was not conclusive,
but by the following year the polarity reversal had become clear, leading
Hale to suggest that the solar cycle should be considered as a 22 year cycle,
rather than an 11 year cycle, as it would take 22 years for the spots to revert
to their original polarities.
In 1908, Alfred Fowler of London University and Hale independently
proved (see Section 1.7) that sunspots are cooler than the surrounding Sun.
In the same year, John Evershed at the Kodaikanal Solar Observatory in
India found that gas flows outwards from sunspots. Then, five years later,
C. Edward St John, one of Hale's colleagues, found that the gas moves back
inwards towards the spots at higher levels in the atmosphere, thus
confirming Secchi's theory of the nineteenth century.
Hale developed Secchi's theory in the early part of the twentieth century
to explain how sunspots occur in pairs, with one spot having an opposite
polarity to the other. He suggested that the two members of a pair are at the
top of the two sides of a U-shaped tube, which is joined together under the
surface of the Sun. Gas spirals inside this U-shaped tube so, as seen from
above, the gas rotation is in opposite senses at either end of the tube, thus
producing spots of opposite polarities. Hale's theory was further developed
by the Norwegian meteorologist Vilhelm Bjerknes who suggested, in 1926,
that all the spots in one hemisphere are part of a single tubular vortex that
runs under the surface of the Sun. From place to place, this tube breaks
through the surface, producing one spot, and travels a short distance before
diving below the surface once again, producing a second spot. This theory
explained why the preceding spots in one hemisphere have the same
polarity as each other.
Bjerknes also pictured the tubular vortex as gradually moving towards
the equator as the sunspot cycle progresses, thus explaining the observed
change in the preferred latitude for spots through the cycle. It was also
suggested that there were two tubular vortices in each hemisphere, one
being near the surface, as outlined above causing sunspots, and one being
much further down, so that it does not break through the surface. While the
upper vortex moves towards the equator during the sunspot cycle, the
lower one moves from the equator towards higher latitudes. When the
upper one reaches the equatorial region it falls deep into the Sun, while the
lower one, which has now reached high latitudes, rises to the surface and
starts a new solar cycle.
Sabine, Wolf and Gautier had found a correlation, in the mid-nineteenth
century, between sunspots and disturbances in the Earth's magnetic field
(and visibility of the aurora). Maunder then showed in 1913 that the larger
magnetic storms on Earth start about 30 hours after a large sunspot crosses
the centre of the solar disc. Smaller storms did not seem to be generally
associated with sunspots, however, but Chree and Stagg showed in 1927
12
that they had a tendency, not shown by the greater storms, to have a
recurrence frequency of 27 days, which is the Sun's synodic period of
rotation. The German geophysicist Julius Bartels called the invisible source
on the Sun of these smaller magnetic storms, M regions. Both the larger
magnetic storms (called flare storms) and the smaller storms (called
M storms) were assumed to be caused by particles ejected by the Sun that
had a travel time of about a day.
In the mid-1920s, as short-wave communications became important, a
number of radio engineers also noticed brief, sudden fade-outs in radio
reception. As the sunspot cycle was near to its maximum, some engineers
wondered if these fade-outs were solar-related, and then E. Hans Mogel, a
young radio engineer in Berlin, showed that they only occurred on the
daylight side of the Earth. In 1935 near the next solar maximum J. Howard
Dellinger, of the American Bureau of Standards, investigated four major
radio fade-outs that had occurred that year. He checked on solar activity
with the Mount Wilson solar observatory and, much to his delight,
discovered that major solar flares had occurred just before two of the fadeouts. Unfortunately, astronomers at the Mount Wilson Observatory were
not observing the Sun at the time of the other two fade-outs.
Over the next two years, Dellinger investigated over 100 radio fade-outs,
but found that, although there was a correlation with solar flares, that
correlation was by no means perfect. He suggested that some unknown
solar phenomenon was generating invisible radiation that penetrated the
Earth's ionosphere which is responsible for reflecting short-wave radio
signals. This invisible radiation then ionised atoms at lower levels in the
atmosphere, causing the radio signals to be absorbed, rather than transmitted.
In 1942 James Hey, a physicist working in the British Army Research
Group, found that the Sun emitted radio waves which interfered with radar
signals and, 3 years later in Australia, Joe Pawsey, Ruby Payne-Scott and
Lindsay McCready found that the radio emissions from the Sun increased
with greater sunspot numbers.
Horace Babcock, of the Mount Wilson Observatory, designed and built a
solar magnetograph in 1952 to measure weak magnetic fields on the Sun, at
the request of his father Harold Babcock, a retired solar physicist. Their
magnetograph measured the magnitude of the Zeeman effect across the
Sun, and with it they were able to detect magnetically disturbed regions of
the Sun, both before and after the appearance of sunspot groups. In 1954
they were also able to measure the general magnetic field of the quiet Sun as
about 1 gauss (or 10- 4 tesla).
The Babcocks noticed that there were both bipolar and unipolar regions
on the Sun. In the bipolar regions the magnetic flux leaving the Sun was
about equal to that entering it, and in the unipolar regions the magnetic flux
was either leaving or entering the Sun. They found that the bipolar regions
could last for as long as 9 months, with sunspots forming and disperSing
within them, whereas the unipolar regions did not appear to be connected
with sunspots at all.
13
They suggested that ions and electrons leaving the Sun in bipolar regions
would follow the field lines above those regions, and would collide over the
Sun, generating radio noise and forming visible prominences. Ions and
electrons (called corpuscular radiation) leaving the Sun in unipolar regions,
on the other hand, would stream away from the Sun, and some of them
would reach the Earth, causing radio interference. Corpuscular radiation
would also leave the Sun near the poles and follow the Sun's general field
lines, but how far out in space these field lines went was unknown.
Horace Babcock returned to his work on magnetic stars in 1955, while
Harold continued to observe the Sun, discovering the reversal of its general
field 2 years later, during solar maximum.
In 1963 Conway Snyder and Marcia Neugebauer of NASA's Jet Propulsion Laboratory (JPL) showed, using data from the American Mariner 2
spacecraft, that there was an excellent correlation between the velocity of
the high-speed ions of the solar wind and the level of geomagnetic activity
on Earth, thus proving that magnetic storms on Earth are caused by highspeed ions from the Sun. These ions were the invisible ionising radiation
postulated by Dellinger, and the corpuscular radiation deduced by Harold
and Horace Babcock. Try as they might, however, Snyder and Neugebauer
were unable to pinpoint the sources on the Sun of these high-speed
streams, the areas that Bartels called M regions, and which the Babcocks
had identified as unipolar regions.
The breakthrough in the search for the solar M regions came in 1973 with
the launch of the American solar observatory, Skylab, when Allen Krieger,
Adrienne Timothy, and Edmond Roelof compared X-ray intensities of the
Figure 1.3 The Sun in X-rays taken by Skylab in 1973. The dark region near the top
of the disc is a coronal hole. (Courtesy NASA/Smithsonian Astrophysical Laboratory.)
14