Some experiences in teaching students to describe a chart in texbooks
Bạn đang xem bản rút gọn của tài liệu. Xem và tải ngay bản đầy đủ của tài liệu tại đây (319.1 KB, 20 trang )
PART I: INTRODUCTION
1.1 The reason of selecting the topic
As we know English is the global language, it is widely used everywhere in the
world. Used in many different fields such as science, economic and trade, media,
tourism .... The psychologist confirmed that the process of formation and
development of man through and through active communication. Teaching and
learning a foreign language is a form of human activity, hence it is full of
fundamental properties of activity in general, the language of the particular activity.
Wanting to use language as a tool of communication is not one way or the other is
going through and by the communication activities such as listening, speaking
reading and writing. In the four skills of writing skills, it seems that the most
difficult skills students often lead to boredom in the process of learning to write.
Especially describing a chart. There are many causes of boredom, such as lack of
method, vocabulary, tragedies…
So how to inspire students in a class to describe a chart well is not easy. Actually,
there are a few description chart in the textbook. Students are afraid of this writing
style. So students are not confident, lack of knowledge to write this kind of lesson.
Therefore, in my initiated experience, I want to share “Some experiences in
teaching students to describe a chart in texbooks”.
1.2The aims of reseach.
In the process I found teaching writing is one of the four skills: listening, speaking,
reading and writing that students need to be trained carefully. If teachers do not
have good stragedies, the students feel bored with the lesson.
Stemming from the fact, I have chosen the theme “Some experiences in teaching
students to describe a chart in texbooks” with the aim of finding the most effective
teaching for myself and inspire students. The results show significant changes in
the formation and development of writing skills for students, and significantly
improved learning atmosphere and attitude of students in writing lesson. Here are
some of the experiences that I have compiled during the research and experimental
teaching, I would like to present the initiative as an experience. Look forward to the
comments of his colleagues to be more complete article.
1.3 Object of research
The writing parts in textbook, English 10 , 11, 12 - Basic Edition.
1.4 Range research:
1
Students in grades 11B6, 11B5, at Trieu Son 4 high school - Thanh Hoa.
2. PROBLEM SOLVING
2.1. Rationale and reality
2.1.1. Rationale
In many subject areas you may need to refer to numbers, statistics and other
data during the course of your studies. This is likely to be data collected by other
people which you will use to support your written work, but it may be data that you
have collected yourself as part of your studies. Data is generally presented in the
form of tables, charts and graphs, which makes it easier for readers to understand.
However, it is often necessary to reproduce and refer to this type of information in
words, as part of a report or written assignment. If you include a graph, chart or
table in your writing, you must explain very clearly what the data in it means, and
why it is relevant to your report or assignment.
That is to say, to have good writing skills is very important. For every
grades, it is more important because having good writing skills is one of the core
elements to help them achieve high marks in the examinations.
2.1.2. Reality
During learning process, students at Trieu Son 4 high school have
complained that describing a chart in general is extremely difficult because this
skill not only asks students to write but also describe it academically. I have found
that when doing this kind of tasks, most of them get bad result. I wonder what the
reasons are. At the beginning of the first semester - school year 2017 - 2018, I
conducted a small survey with 84 students in 2 classes 11B5 and 11B6 - to find out
the ways they did the test and why a lot of them got bad result.
From my research, I see that the majority of the students are not good at
writing skill. Most of them feel anxious, overwhelmed when facing with this
problem because of their lack of words, structures, models. Therefore, they are not
only difficult for good students but also far more difficult for average and poor
students who only take gifted examination.
PART II: CONTENT
SOME BASIC KNOWLEDGE ABOUT THE CHART.
I.
SOME NOTES FOR DESCRIPTION
- Before describing the chart we must be sure that students learnt about the writing
on the symbol, icon name, content found in the chart. What is the trend of the
2
chart? What is the relationship between the information in the chart? Specify the
specified time description in the chart: the present, past tense or future.
- Read the request of the chart description:
What is the aim of the chart description? What is the remarkable thing in the
description?. From the specified the target entry index will determine the following
ones for the writing. No description to all details in the chart, pay attention to the
trend, increase or decrease, the fluctuation.
-
The past tense is used to describe the chart.
Use formal writing, suitable words to describle the chart.
Give unprejudiced and describe which appear in the chart.
Don’t give personal points.
Don’t use pronouns: We, us, me, my, our, I, you, your…
Example: Don’t write: “As we can see from the chart,………..”
We rewrite: “As it can be seen from the chart………”.
- There are 3 parts in description: Introduction, body, overview.
- Use the specific figures to make the writing more persuadable.
II. WORDS AND STRUCTURES ARE USUALLY USED:
To help students to describe well the chart, the teacher must know the structures,
the phrases as well as basic vocabulary used in the description. To describe the
new chart to execute the following steps:
1. Introduce the genaral chart:
We can use some structures:
-The table illustrates /describes /reveals / shows / indicates the information /
propotion / rate …..
-As can be seen from the chart/table that the data on……….
- It can be seen from the chart/table that the data on……….
-As can be seen the bar chart/ table /pie chart is well described/ illustrated the
number of/the data on....
- It is clear from the chart/table that ……….
-From the chart/ table it is clear…….
3
- As the chart/table shows….
- As is shown in the chart/table that ……….
-As is illustrated by the table/ the chart…….
2. Describe the detail chart:
2.1. About time:
- from (year)….. to (year)……….
- During the period of ….years….
- Since
-Between ... and...
- In/during/over the first/last/next years, months
2. 2 Giving the fingures:
To account for /to make up/to constitute
Example:
- Friench visitors account for 20,5%.
- American visitors account for 79,5%.
2.3. Describe the changes in the chart:
The number of the Chart represented by 4 trends:
- The number or figures grow upward movement:
- The index or numbers has shrinking (downward movement: )
- stable number (not movement: not grow, not reduced)
- The boosting or extracting number.
* Some popular adjectives and adverbs:
Adjectives
Adverbs
slight/ slow
slightly/ slowly
steady
steadily
moderate
moderately
sharp
sharply
4
gradual
gradually
significant/ considerable
Significantly/ considerablely/
vast/huge
vastly/hugely
dramatic/ rapid/ quick
dramatically/ rapidly/ quickly
Looking to description with the image. We can see adjectives as well as adverbs to
express the level and the speed of figures
Beside adjectives and adverbs, we can use some verbs and nouns to describe the
increasing and decreasing trends.
*Increasing trend:
Verbs
Nouns
(to) increase
(an) increase
(to) rise
(a) , a rise
(to) go/be up
(an) upswing
(to) grow
(a) growth
(to) jump, (to) skyrocket (increasing sharply)
(a) jump
5
(to) reach a peak, (to) peak (increasing (a) peak
sharply)
Example: The French visitors in Viet nam rose steadily from 2001 to 2002.
V
adv
There was an slight increase in the number visitor arrivals in Vet nam
Adj
N
from 2001 to 2002.
Express the falling trend:
Verbs
Nouns
(to) decrease
(a) decrease
(to) fall (off)
(a) fall
(to) drop (off)
(a) drop
(to) go down
(a) downswing
(to) decline
(a) decline
(to) collapse (decrease sharply)
(a) collapse (dramatic fall)
(to) slump (decrease sharply)
(a) slump
Example:
- Married men without children a gradual decrease in the number of domestic
chores
Adj
N.
- The rate went down sharply between married men without children and with
V
Adv
three or more chilren.
Express the stable fingures:
Verbs
Nouns
(to) remain stable
6
(to) stay constant
(to) stabilize
Stability
(to) remain steady
Express the inverse falling or rising:
Verbs
(to) stop falling/rising
Nouns
(a) change
(to) stop falling and start rising
(to) stop rising and start falling
We can use some model sentences:
There
(be) a quick/slow/sharp/rapid/considerable/steady
increase/
grow/
reduction/ rise/ fall/
drop.
There (be) an upward trend +in
There (be) a downward trend +in
-There (be) a fluctuation
Due to time for each period is limited and the students’abilities. So the teacher can
not teach all knowledge. Teacher must find the most important and useful data to
teach students.Of all important, teacher should spend time finding the effective
ways to provide students with knowledge .
Here are some notes and vocabulary considered “hardware data”help us easily to
develop writing lesson. However, to reach to the finally target is to have students’
“writing product”. Teacher should give the following prompts, design more tasks
for students to approach the lesson. There are some ways I applied in teaching
description the chart.
PART III: SOME PROCEDURES IN TEACHING PERIOD.
After a lot of teaching periods to describe the chart. I myself find some suitable
methods such as: providing the model writing, setting questions, completing the
7
sentences or short paragraph, reodering the sentences, building the senteces based
on the hint.
I. PROVIDING THE MODEL WRITING METHOD:
Target of this method is the settings of the architecture about a description form as
building for some the phrase from or pattern structure. I usually apply this method
for students in grade 10 because these students is new occurrence with the chart.
When teaching UNIT 16: HISTORICAL PLACES Period 98: Writing (Textbook
10). I provide student a model description and a chart. Then asks students to scan
the description then analysis
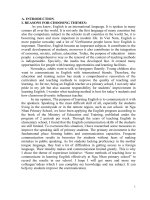
The bar chart illustrates the amount of money spent on five consumer goods (car,
computers, books, perfume and cameras) in France and the UK in 2010. Units are
measured in pounds sterling.
Overall, the UK spent more money on consumer goods than France in the period
given. Both the British and the French spent most of their money on cars whereas
the least amount of money was spent on perfume in the UK compared to cameras in
France. Futhermore, the most significant difference in expenditure between the two
countries was on cameras.
8
In terms of car, people in the UK spent about £450,000 on this as apposed to the
French who spent £400,000. Similarly, the British spent more money on books than
the French (around £400,000 and £300,000 respectively. In the UK, expenditure on
cameras (just over £350,000) was double that of France, which was only 150,000.
On the other hand, the amount spent on the remaining goods was higher in France.
Above £350,000 was spent by the French on computers which was slightly more
than the British who spent exactly £350,000. Neither of the countries spent much
on perfume which accounted for £200,000 of expenditure in France but under
£150,000 in the UK.
From this post template, student students will have the basic architecture about the
text to be post the description of a chart:
- This chart shows…………..
- It is clear that…………
- According to the chart……………….
- To have the largest………..
- whereas the smallest………….
- To have the smallest ……. in……….
- nearly …..greater than ……..
- On the other hand.............................
- overall............................
- In term of .......................
Known deeply about the text structure and the use of the language students will be
automatical than when progress the steps in your description.
II.BUILDING SENTENCES METHOD:
When teaching UNIT 15: SOCIAL IN SOCIETY (Textbook 12)
This textbook has provided full questions. However, use this data is only applied
for the gilfted students. It is difficult fot the rest. In this case I apply the providing
data method like:
9
Task: Study the chart and write complete sentences with the given
prompts:
- Married men/ have/ do/ housework/ they/ have/ more children.
- Women/ spend/ 30 hours per week/ do/ housework/ this number/ be/ 20
hours for men when they have no children.
- The chart/ suggest/ married men should spend/ time/ share/ housework/
their wives.
- Married women/ have/ do/ housework/ they/ have/ more children.
- The numbers of weekly housework hours / men and women with three or
more children/ do/ be / 10 and 55 hours respectively.
- In general/ married women/ do/ housework/ men/ do.
- It/ take/ men and women with one or two children/ 15/ 50 hours/
respectively/ do/ housewwork/ every week.
Remind students to use suitable tenses to complete the above sentences.
After finishing this Task student can answer thee questions in Task 1.
III. USING HINT WORDS METHOD:
The target of this process is students understand information in the chart to fill in
the words or phrases.
When teaching UNIT 7: WORLD POPULATION (Texbook 11). Teacher must
guide students to describe the pie. We can see the distribution of world population
by region. The hintary data is only some phrases, if we request students to write a
description based on this data number, the students is not able to write. In this
details after when extracted one dynamic from the word and provided from the
“Useful language” section that will be added the following tasks:
10
Task 1: Study the chart about the distribution of world population by
region and fill in the gaps with given words or phrases:
Ranks first
ranks last
distributed
accounts for
approximately
unevenly
greatest
more than double
1.
It can be seen that the world population is ……………………..
2.
The South Asian which ….………accounts for nearly half of the world
population with 32%.
3.
The region with the smallest population
which…………..only 2% of world population
4.
Compared with the Oceania which……..in the chart, Latin has …..8%
of the world population while Northern American has lower rate with
only 6%.
5.
East Asia has……..the population of Africa with 26% for the former and
15% for the later.
6
As can be seen, the …….. concentration of the world population is in
Asia, with Europe far behind.
Keys : 1. distributed unevenly
is
Oceania,
4. ranks last - approximately
2. ranks first
5. more than double
3. accounts for
6. greatest
IV. DETERMINED AND ARRANGED INFORMATION METHOD :
For some hard problems that usually apply this method in this process. Target item
for verify the learning information in the map and the sort of a logical information.
EXAMPLE: UNIT 7 (Textbook 12). Or we can design any lessons as this form
11
Task : Study the information given in the table and decide whether the given
statements are true(T) or false(F). If they are false, corect them.
1. Before 1980 the economy in Tango was not under-developed and
stagnant.
2. All five main production sectors agriculture, fishery, forestry, industry
and constructon were in ruins.
3. Before 1980 people could see a lot of activities of export in the country.
Export value was equal to zero.
4. From 1980 to 2000 all branch of economy decreased considerably and
continuously.
5. It was said that the Government and the people of Tango had carried out
economic reforms such as spending more money on agriculture, fishery,
forestry and industry to raise the production of economy.
6. Especially, construction was improved dramatically from 1975 to2000.
7. After 1980 Tango started to increase co-operation with the rest of the
world by trading a large amount of goods.
8. By conducting a lot of positive measures, the economy of Tango now see
a big leap in comparison with twenty years before.
9. Average increasing rate per year was more than 4.5% in all sectors,
among which construction has the lowest growth of 6.4% in 2000.
Keys: 1. False. (was not………was)
6. False.(1975……1980)
2. True.
7. True.
3. False. ( a lot of………no)
8. True.
4. False. (decreased…….increased)
9. False. (lowest…….highest)
5. True.
V. MAKING QUESTION METHODS:
Target of this method is the direction for the students information to be described,
students are not disturbed by many messages in the information.
Example: Unit 16: HISTORICAL PLACES (textbook 10)
VISITOR ARRIVALS IN VIETNAM
(From the USA, France and Australia)
12
300000
200000
USA
FRANCE
AUSTRALIA
100000
0
2001
2002
Task : Study the chart and answer the following questions :
1. According to the chart, which country had the biggest number of visitors to
Vietnam in 2001?
2. How many French visitors arrived Vietnam in 2001?
3. Which country had the smallest number of visitors to Vietnam in 2002?
4. Is the number of Australian visitors coming to Vietnam in 2002?
5. Which country, France or Australia, had moreisitors to Vietnam in 2001?
6. How did the number of American visitors to Vietnam in 2002 increase in
comparision with that in 2001?
Answering these questions students have enough information to complete
writing.
From these analysis above. I give a lesson plan as a model plan.
13
UNIT 7: WORLD POPULATION
Period 41st : WRITING
I. Objectives:
1.Educational aim: Students will write descriptions of pie charts
2.General knowledge: Students learn how to write a descriptions of a chart
- Language: students should interpret statistics on population from a chart
- New words: Words related to the topic
3. Skills: Writing descriptions of pie charts
II. Method: Integrated, mainly communicative
III. Teaching aids: Student’s book, notebook, projector, computer…
IV. Procedure:
Teacher’s activities
Students’ activities
14
Warm up
Look at the picture and answer:
2. Books closed
T shows Ss a pie or a piece of paper with a pie
and asks questions:
T: What’s this?
T: Yes, it’s a pie cake. It’s round. Now look at
S: It’s a cake.
S: You are cutting the cake.
what I am doing.
T: Yes, I am dividing it into parts. What do you S: They are the same size. They
think about the parts?
are equal
T: Now open your books and you can see
another one. This chart is round so it is a pie
S: No, they are not equal.
chart. Are the patts in the pie chart equal?
T: Yes, these parts stand for the distribution of
population in the world, and it is not equal
15
among regions.
Listen to the teacher
T asks Ss to work in pairs: ask and answer
about the information in the chart
T presents Useful language and explains:
- The chart shows the distribution of world
population by region
Ss work in pairs, read the
information in the chart and use
Useful language to write the
- It can be seen that
- distributed unevenly
- account for …… per cent
- more than double the population of
paragraph
Ss practice writing in groups of 3
or 4.
Ss present their writing on the
board.
- half as much as
- nearly half of
Suggested paragraph(1)
- rank first / last
The chart shows the distribution
T instructs Ss how to use Useful language to
describe the chart
of world population by region. It
can be seen from the chart that the
T goes round the class and provide help when
world population is distributed
necessary
unevenly in the South-East Asia. It
T gives some suggested sentences :
accounts for 58% of the world
population.
- The world population is not distributed
evenly / is distributed unevenly.
Especially,
the
population of East Asia is more
than double the population of
- The South Asia ranks first with 32% / ( The
Africa.
South Asia has the most people / has the
Northern American is nearly half
largest population).
of the population of Africa. In
The
population
of
16
- Very few people live in the Oceania. / The
comparison with the other region,
Oceania is the least populated / The Oceania
the Ocean ranks last, about 2%.
has the least population.
Finally the population of Latin
- Less than that in South Asia is East Asia with
only 26%.
- Africa and Europe have fewer people with
11% for the former and 15% for the later.
- Compared with the Oceania which ranks last
America is 2% more than the one
of Northern American, about 8%.
Suggested paragraph(2)
The chart show the distribution of
world population by region.
in the table, Latin has approximately 8% of the As seen from the chart, the world
world population whereas Northern America
population
has a lower rate with only 6%. Nowadays 15%
evenly. South Asia has the largest
the world population is living in Europe.
population with 32% while the
T corrects mistakes and gives suggested
answer.
is
not
distributed
Oceania is the least populated
with only 2%. A bit higher than
that of the Oceania are the rates
T asks Ss to write a paragraph of their own at
home.
Homework: - write a paragraph at home
- Prepare for LANGUAGE FOCUS
of Latin America and Northern
America with 8% for the former
and 6% for the latter. / ( wth 8%
and 6% respectively). Europe
accounts for 15% of the world
population and Africa is a bit
lower with only 11%.
To sum up, more people are found
in Asia than in other parts of the
world.
17
PART IV: THE RESULT OF RESEARCH AND CONCLUSION.
I. THE RESULT OF RESEARCH
1. To have a basic comparison, give out the exact conclusion for the studying
process and applying the topic to teach writing skill at Trieu Son 4 high school, I
implemented to examine and collect the result of class 11B6 and 11B5 (They have
the same level) , the academic year 2017 -2018.
+ Class 11B6 was applied the above topic for 2 grades 10, 11
+ Class 11B5 was not applied the above topic.
2. After applying a new experience to teach in the second year in class 11B6 and
still apply the old methods for 11B5 : I set a survey and a in tracking number of the
rating points as following:
-Group 1: This is the group of students that are not good at writing.
- Group 2: These students want to join the lesson but they are afraid of limited
language (grammar, vocabulary…).
-Group 3: These students sometimes believe in themselves, they can use the simple
language element to display the idea in their article.
-Group 4: These students can use language well. They are good at writing.
After upon tracking, I got the following results:
3. The result:
Group 1
Group
Control
group
(11B5)
Experimen
t
( 11B6)
Numbe
r
Group 2
%
Numbe
r
4
2
12
28,5
%
4
2
5
11,9% 8
16
Group 3
%
Numbe
r
Group 4
%
Numbe
r
%
38
%
10
23,8
%
4
9%
19
%
19
45,2
%
10
23,8
%
18
Looking to the total table we easily found: With two classes are the same levels.
But after applying the differences methods in teaching to write a description of the
chart, I have the clear results.When applying the new experience to teach , the
previous students who are not good at writing, fall down dramatically. In contrast,
there has increased the number of good writing students.
- The number of students is interested in writing lesson falls from 24% to
11% (Group 1).
- The number of students is afraid of the limit of language falls from 38% to
18% (Group 2).
- The number of students is confident, able to use simple structures to
describe the chart increase from 29% to 49% (Group 3).
- The number of students is able to use languge quite well, they themselves
develop their own description increase from 9% to 22%. (Group 4).
II. CONCLUSION AND PROPOSAL:
The ability to apply this experience in teaching is very large. Howerver, to apply
this experience in teaching, teachers must spend time studying the lessons carefully,
sellect suitable methods for the lesson plan and students. The result we can see is
students are more active, they can use language more suitably, the aim of the lesson
is completed. To enrich our own experiences, teachers should study more and more,
upgrade training and teaching method.
Here is my experience. Because of time limitation, I do not avoid errors. I would
like to receive feedback from my colleagues, especially teachers who teach English
to make my initiatives more complete and widely applied in teaching process.
I sincerely thank you!
CONFIRMED BY PRINCIPAL
Trieu Son, 25th May 2018
I assure that this is my experience initiative,
do not copy other people's content.
Written by
19
Le Thi Diep
20