IT training kernel based data fusion for machine learning methods and applications in bioinformatics and text mining yu, tranchevent, de moor moreau 2011 03 26
Bạn đang xem bản rút gọn của tài liệu. Xem và tải ngay bản đầy đủ của tài liệu tại đây (3.26 MB, 228 trang )
Shi Yu, Léon-Charles Tranchevent, Bart De Moor, and Yves Moreau
Kernel-based Data Fusion for Machine Learning
Studies in Computational Intelligence, Volume 345
Editor-in-Chief
Prof. Janusz Kacprzyk
Systems Research Institute
Polish Academy of Sciences
ul. Newelska 6
01-447 Warsaw
Poland
E-mail:
Further volumes of this series can be found on our
homepage: springer.com
Vol. 321. Dimitri Plemenos and Georgios Miaoulis (Eds.)
Intelligent Computer Graphics 2010
ISBN 978-3-642-15689-2
Vol. 322. Bruno Baruque and Emilio Corchado (Eds.)
Fusion Methods for Unsupervised Learning Ensembles, 2010
ISBN 978-3-642-16204-6
Vol. 323. Yingxu Wang, Du Zhang, and Witold Kinsner (Eds.)
Advances in Cognitive Informatics, 2010
ISBN 978-3-642-16082-0
Vol. 324. Alessandro Soro, Vargiu Eloisa, Giuliano Armano,
and Gavino Paddeu (Eds.)
Information Retrieval and Mining in Distributed
Environments, 2010
ISBN 978-3-642-16088-2
Vol. 325. Quan Bai and Naoki Fukuta (Eds.)
Advances in Practical Multi-Agent Systems, 2010
ISBN 978-3-642-16097-4
Vol. 326. Sheryl Brahnam and Lakhmi C. Jain (Eds.)
Advanced Computational Intelligence Paradigms in
Healthcare 5, 2010
ISBN 978-3-642-16094-3
Vol. 333. Fedja Hadzic, Henry Tan, and Tharam S. Dillon
Mining of Data with Complex Structures, 2011
ISBN 978-3-642-17556-5
Vol. 334. Álvaro Herrero and Emilio Corchado (Eds.)
Mobile Hybrid Intrusion Detection, 2011
ISBN 978-3-642-18298-3
Vol. 335. Radomir S. Stankovic and Radomir S. Stankovic
From Boolean Logic to Switching Circuits and Automata, 2011
ISBN 978-3-642-11681-0
Vol. 336. Paolo Remagnino, Dorothy N. Monekosso, and
Lakhmi C. Jain (Eds.)
Innovations in Defence Support Systems – 3, 2011
ISBN 978-3-642-18277-8
Vol. 337. Sheryl Brahnam and Lakhmi C. Jain (Eds.)
Advanced Computational Intelligence Paradigms in
Healthcare 6, 2011
ISBN 978-3-642-17823-8
Vol. 338. Lakhmi C. Jain, Eugene V. Aidman, and
Canicious Abeynayake (Eds.)
Innovations in Defence Support Systems – 2, 2011
ISBN 978-3-642-17763-7
Vol. 339. Halina Kwasnicka, Lakhmi C. Jain (Eds.)
Innovations in Intelligent Image Analysis, 2010
ISBN 978-3-642-17933-4
Vol. 327. Slawomir Wiak and
Ewa Napieralska-Juszczak (Eds.)
Computational Methods for the Innovative Design of
Electrical Devices, 2010
ISBN 978-3-642-16224-4
Vol. 340. Heinrich Hussmann, Gerrit Meixner, and
Detlef Zuehlke (Eds.)
Model-Driven Development of Advanced User Interfaces, 2011
ISBN 978-3-642-14561-2
Vol. 328. Raoul Huys and Viktor K. Jirsa (Eds.)
Nonlinear Dynamics in Human Behavior, 2010
ISBN 978-3-642-16261-9
Vol. 341. Stéphane Doncieux, Nicolas Bredeche, and
Jean-Baptiste Mouret(Eds.)
New Horizons in Evolutionary Robotics, 2011
ISBN 978-3-642-18271-6
Vol. 329. Santi Caball´e, Fatos Xhafa, and Ajith Abraham (Eds.)
Intelligent Networking, Collaborative Systems and
Applications, 2010
ISBN 978-3-642-16792-8
Vol. 330. Steffen Rendle
Context-Aware Ranking with Factorization Models, 2010
ISBN 978-3-642-16897-0
Vol. 342. Federico Montesino Pouzols, Diego R. Lopez, and
Angel Barriga Barros
Mining and Control of Network Traffic by Computational
Intelligence, 2011
ISBN 978-3-642-18083-5
Vol. 343. XXX
Vol. 331. Athena Vakali and Lakhmi C. Jain (Eds.)
New Directions in Web Data Management 1, 2011
ISBN 978-3-642-17550-3
Vol. 344. Atilla El¸ci, Mamadou Tadiou Koné, and
Mehmet A. Orgun (Eds.)
Semantic Agent Systems, 2011
ISBN 978-3-642-18307-2
Vol. 332. Jianguo Zhang, Ling Shao, Lei Zhang, and
Graeme A. Jones (Eds.)
Intelligent Video Event Analysis and Understanding, 2011
ISBN 978-3-642-17553-4
Vol. 345. Shi Yu, Léon-Charles Tranchevent,
Bart De Moor, and Yves Moreau
Kernel-based Data Fusion for Machine Learning, 2011
ISBN 978-3-642-19405-4
Shi Yu, Léon-Charles Tranchevent, Bart De Moor, and
Yves Moreau
Kernel-based Data Fusion for
Machine Learning
Methods and Applications in Bioinformatics and
Text Mining
123
Dr. Shi Yu
Prof. Dr. Bart De Moor
University of Chicago
Katholieke Universiteit Leuven
Department of Medicine
Department of Electrical Engineering
Institute for Genomics and Systems Biology
SCD-SISTA
Knapp Center for Biomedical Discovery
Kasteelpark Arenberg 10
900 E. 57th St. Room 10148
Heverlee-Leuven, B3001
Chicago, IL 60637
Belgium
USA
E-mail:
E-mail:
Dr. Léon-Charles Tranchevent
Katholieke Universiteit Leuven
Department of Electrical Engineering
Bioinformatics Group, SCD-SISTA
Kasteelpark Arenberg 10
Heverlee-Leuven, B3001
Belgium
Prof. Dr. Yves Moreau
Katholieke Universiteit Leuven
Department of Electrical Engineering
Bioinformatics Group, SCD-SISTA
Kasteelpark Arenberg 10
Heverlee-Leuven, B3001
Belgium
E-mail:
E-mail:
ISBN 978-3-642-19405-4
e-ISBN 978-3-642-19406-1
DOI 10.1007/978-3-642-19406-1
Studies in Computational Intelligence
ISSN 1860-949X
Library of Congress Control Number: 2011923523
c 2011 Springer-Verlag Berlin Heidelberg
This work is subject to copyright. All rights are reserved, whether the whole or part
of the material is concerned, specifically the rights of translation, reprinting, reuse
of illustrations, recitation, broadcasting, reproduction on microfilm or in any other
way, and storage in data banks. Duplication of this publication or parts thereof is
permitted only under the provisions of the German Copyright Law of September 9,
1965, in its current version, and permission for use must always be obtained from
Springer. Violations are liable to prosecution under the German Copyright Law.
The use of general descriptive names, registered names, trademarks, etc. in this
publication does not imply, even in the absence of a specific statement, that such
names are exempt from the relevant protective laws and regulations and therefore
free for general use.
Typeset & Cover Design: Scientific Publishing Services Pvt. Ltd., Chennai, India.
Printed on acid-free paper
987654321
springer.com
Preface
The emerging problem of data fusion offers plenty of opportunities, also raises
lots of interdisciplinary challenges in computational biology. Currently, developments in high-throughput technologies generate Terabytes of genomic data
at awesome rate. How to combine and leverage the mass amount of data sources
to obtain significant and complementary high-level knowledge is a state-of-art
interest in statistics, machine learning and bioinformatics communities.
To incorporate various learning methods with multiple data sources is a
rather recent topic. In the first part of the book, we theoretically investigate
a set of learning algorithms in statistics and machine learning. We find that
many of these algorithms can be formulated as a unified mathematical model
as the Rayleigh quotient and can be extended as dual representations on the
basis of Kernel methods. Using the dual representations, the task of learning
with multiple data sources is related to the kernel based data fusion, which
has been actively studied in the recent five years.
In the second part of the book, we create several novel algorithms for supervised learning and unsupervised learning. We center our discussion on the
feasibility and the efficiency of multi-source learning on large scale heterogeneous data sources. These new algorithms are encouraging to solve a wide
range of emerging problems in bioinformatics and text mining.
In the third part of the book, we substantiate the values of the proposed algorithms in several real bioinformatics and journal scientometrics applications.
These applications are algorithmically categorized as ranking problem and
clustering problem. In ranking, we develop a multi-view text mining methodology to combine different text mining models for disease relevant gene prioritization. Moreover, we solidify our data sources and algorithms in a gene
prioritization software, which is characterized as a novel kernel-based approach
to combine text mining data with heterogeneous genomic data sources using
phylogenetic evidence across multiple species. In clustering, we combine multiple text mining models and multiple genomic data sources to identify the disease relevant partitions of genes. We also apply our methods in scientometric
field to reveal the topic patterns of scientific publications. Using text mining
technique, we create multiple lexical models for more than 8000 journals retrieved from Web of Science database. We also construct multiple interaction
graphs by investigating the citations among these journals. These two types
VI
Preface
of information (lexical /citation) are combined together to automatically construct the structural clustering of journals. According to a systematic benchmark study, in both ranking and clustering problems, the machine learning
performance is significantly improved by the thorough combination of heterogeneous data sources and data representations.
The topics presented in this book are meant for the researcher, scientist
or engineer who uses Support Vector Machines, or more generally, statistical
learning methods. Several topics addressed in the book may also be interesting to computational biologist or bioinformatician who wants to tackle data
fusion challenges in real applications. This book can also be used as reference material for graduate courses such as machine learning and data mining.
The background required of the reader is a good knowledge of data mining,
machine learning and linear algebra.
This book is the product of our years of work in the Bioinformatics group,
the Electrical Engineering department of the Katholieke Universiteit Leuven. It has been an exciting journey full of learning and growth, in a relaxing
and quite Gothic town. We have been accompanied by many interesting colleagues and friends. This will go down as a memorable experience, as well
as one that we treasure. We would like to express our heartfelt gratitude to
Johan Suykens for his introduction of kernel methods in the early days. The
mathematical expressions and the structure of the book were significantly
improved due to his concrete and rigorous suggestions. We were inspired by
the interesting work presented by Tijl De Bie on kernel fusion. Since then,
we have been attracted to the topic and Tijl had many insightful discussions
with us on various topics, the communication has continued even after he
moved to Bristol. Next, we would like to convey our gratitude and respect
to some of our colleagues. We wish to particularly thank S. Van Vooren, B.
Coessen, F. Janssens, C. Alzate, K. Pelckmans, F. Ojeda, S. Leach, T. Falck,
A. Daemen, X. H. Liu, T. Adefioye, E. Iacucci for their insightful contributions on various topics and applications. We are grateful to W. Gl¨
anzel for
his contribution of Web of Science data set in several of our publications.
This research was supported by the Research Council KUL (ProMeta, GOA
Ambiorics, GOA MaNet, CoE EF/05/007 SymBioSys, KUL PFV/10/016),
FWO (G.0318.05, G.0553.06, G.0302.07, G.0733.09, G.082409), IWT (Silicos,
SBO-BioFrame, SBO-MoKa, TBM-IOTA3), FOD (Cancer plans), the Belgian
Federal Science Policy Office (IUAP P6/25 BioMaGNet, Bioinformatics and
Modeling: from Genomes to Networks), and the EU-RTD (ERNSI: European
Research Network on System Identification, FP7-HEALTH CHeartED).
Chicago,
Leuven,
Leuven,
Leuven,
November 2010
Shi Yu
L´eon-Charles Tranchevent
Bart De Moor
Yves Moreau
Contents
1
2
Introduction . . . . . . . . . . . . . . . . . . . . . . . . . . . . . . . . . . . . . . . . . . . . .
1.1 General Background . . . . . . . . . . . . . . . . . . . . . . . . . . . . . . . . . . .
1.2 Historical Background of Multi-source Learning and Data
Fusion . . . . . . . . . . . . . . . . . . . . . . . . . . . . . . . . . . . . . . . . . . . . . . .
1.2.1 Canonical Correlation and Its Probabilistic
Interpretation . . . . . . . . . . . . . . . . . . . . . . . . . . . . . . . . . . .
1.2.2 Inductive Logic Programming and the Multi-source
Learning Search Space . . . . . . . . . . . . . . . . . . . . . . . . . . .
1.2.3 Additive Models . . . . . . . . . . . . . . . . . . . . . . . . . . . . . . . .
1.2.4 Bayesian Networks for Data Fusion . . . . . . . . . . . . . . . .
1.2.5 Kernel-based Data Fusion . . . . . . . . . . . . . . . . . . . . . . . .
1.3 Topics of This Book . . . . . . . . . . . . . . . . . . . . . . . . . . . . . . . . . . .
1.4 Chapter by Chapter Overview . . . . . . . . . . . . . . . . . . . . . . . . . .
References . . . . . . . . . . . . . . . . . . . . . . . . . . . . . . . . . . . . . . . . . . . . . . . .
Rayleigh Quotient-Type Problems in Machine
Learning . . . . . . . . . . . . . . . . . . . . . . . . . . . . . . . . . . . . . . . . . . . . . . . . .
2.1 Optimization of Rayleigh Quotient . . . . . . . . . . . . . . . . . . . . . . .
2.1.1 Rayleigh Quotient and Its Optimization . . . . . . . . . . . .
2.1.2 Generalized Rayleigh Quotient . . . . . . . . . . . . . . . . . . . .
2.1.3 Trace Optimization of Generalized Rayleigh
Quotient-Type Problems . . . . . . . . . . . . . . . . . . . . . . . . .
2.2 Rayleigh Quotient-Type Problems in Machine Learning . . . .
2.2.1 Principal Component Analysis . . . . . . . . . . . . . . . . . . . .
2.2.2 Canonical Correlation Analysis . . . . . . . . . . . . . . . . . . . .
2.2.3 Fisher Discriminant Analysis . . . . . . . . . . . . . . . . . . . . . .
2.2.4 k-means Clustering . . . . . . . . . . . . . . . . . . . . . . . . . . . . . .
2.2.5 Spectral Clustering . . . . . . . . . . . . . . . . . . . . . . . . . . . . . .
2.2.6 Kernel-Laplacian Clustering . . . . . . . . . . . . . . . . . . . . . .
1
1
4
4
5
6
7
9
18
21
22
27
27
27
28
28
30
30
30
31
32
33
33
VIII
Contents
2.2.7 One Class Support Vector Machine . . . . . . . . . . . . . . . .
2.3 Summary . . . . . . . . . . . . . . . . . . . . . . . . . . . . . . . . . . . . . . . . . . . . .
References . . . . . . . . . . . . . . . . . . . . . . . . . . . . . . . . . . . . . . . . . . . . . . . .
3
4
Ln -norm Multiple Kernel Learning and Least Squares
Support Vector Machines . . . . . . . . . . . . . . . . . . . . . . . . . . . . . . . .
3.1 Background . . . . . . . . . . . . . . . . . . . . . . . . . . . . . . . . . . . . . . . . . . .
3.2 Acronyms . . . . . . . . . . . . . . . . . . . . . . . . . . . . . . . . . . . . . . . . . . . .
3.3 The Norms of Multiple Kernel Learning . . . . . . . . . . . . . . . . . .
3.3.1 L∞ -norm MKL . . . . . . . . . . . . . . . . . . . . . . . . . . . . . . . . .
3.3.2 L2 -norm MKL . . . . . . . . . . . . . . . . . . . . . . . . . . . . . . . . . .
3.3.3 Ln -norm MKL . . . . . . . . . . . . . . . . . . . . . . . . . . . . . . . . . .
3.4 One Class SVM MKL . . . . . . . . . . . . . . . . . . . . . . . . . . . . . . . . . .
3.5 Support Vector Machine MKL for Classification . . . . . . . . . . .
3.5.1 The Conic Formulation . . . . . . . . . . . . . . . . . . . . . . . . . .
3.5.2 The Semi Infinite Programming Formulation . . . . . . . .
3.6 Least Squares Support Vector Machines MKL for
Classification . . . . . . . . . . . . . . . . . . . . . . . . . . . . . . . . . . . . . . . . .
3.6.1 The Conic Formulation . . . . . . . . . . . . . . . . . . . . . . . . . .
3.6.2 The Semi Infinite Programming Formulation . . . . . . . .
3.7 Weighted SVM MKL and Weighted LSSVM MKL . . . . . . . . .
3.7.1 Weighted SVM . . . . . . . . . . . . . . . . . . . . . . . . . . . . . . . . . .
3.7.2 Weighted SVM MKL . . . . . . . . . . . . . . . . . . . . . . . . . . . .
3.7.3 Weighted LSSVM . . . . . . . . . . . . . . . . . . . . . . . . . . . . . . .
3.7.4 Weighted LSSVM MKL . . . . . . . . . . . . . . . . . . . . . . . . . .
3.8 Summary of Algorithms . . . . . . . . . . . . . . . . . . . . . . . . . . . . . . . .
3.9 Numerical Experiments . . . . . . . . . . . . . . . . . . . . . . . . . . . . . . . .
3.9.1 Overview of the Convexity and Complexity . . . . . . . . .
3.9.2 QP Formulation Is More Efficient than SOCP . . . . . . .
3.9.3 SIP Formulation Is More Efficient than QCQP . . . . . .
3.10 MKL Applied to Real Applications . . . . . . . . . . . . . . . . . . . . . .
3.10.1 Experimental Setup and Data Sets . . . . . . . . . . . . . . . .
3.10.2 Results . . . . . . . . . . . . . . . . . . . . . . . . . . . . . . . . . . . . . . . . .
3.11 Discussions . . . . . . . . . . . . . . . . . . . . . . . . . . . . . . . . . . . . . . . . . . .
3.12 Summary . . . . . . . . . . . . . . . . . . . . . . . . . . . . . . . . . . . . . . . . . . . . .
References . . . . . . . . . . . . . . . . . . . . . . . . . . . . . . . . . . . . . . . . . . . . . . . .
Optimized Data Fusion for Kernel k-means
Clustering . . . . . . . . . . . . . . . . . . . . . . . . . . . . . . . . . . . . . . . . . . . . . . .
4.1 Introduction . . . . . . . . . . . . . . . . . . . . . . . . . . . . . . . . . . . . . . . . . .
4.2 Objective of k-means Clustering . . . . . . . . . . . . . . . . . . . . . . . . .
4.3 Optimizing Multiple Kernels for k-means . . . . . . . . . . . . . . . . .
4.4 Bi-level Optimization of k-means on Multiple Kernels . . . . . .
4.4.1 The Role of Cluster Assignment . . . . . . . . . . . . . . . . . . .
4.4.2 Optimizing the Kernel Coefficients as KFD . . . . . . . . .
34
35
37
39
39
40
42
42
43
44
46
48
48
50
53
53
54
56
56
56
57
58
58
59
59
59
60
63
63
67
83
84
84
89
89
90
92
94
94
94
Contents
IX
4.4.3 Solving KFD as LSSVM Using Multiple Kernels . . . . . 96
4.4.4 Optimized Data Fusion for Kernel k-means
Clustering (OKKC) . . . . . . . . . . . . . . . . . . . . . . . . . . . . . . 98
4.4.5 Computational Complexity . . . . . . . . . . . . . . . . . . . . . . . 98
4.5 Experimental Results . . . . . . . . . . . . . . . . . . . . . . . . . . . . . . . . . . 99
4.5.1 Data Sets and Experimental Settings . . . . . . . . . . . . . . 99
4.5.2 Results . . . . . . . . . . . . . . . . . . . . . . . . . . . . . . . . . . . . . . . . . 101
4.6 Summary . . . . . . . . . . . . . . . . . . . . . . . . . . . . . . . . . . . . . . . . . . . . . 103
References . . . . . . . . . . . . . . . . . . . . . . . . . . . . . . . . . . . . . . . . . . . . . . . . 105
5
Multi-view Text Mining for Disease Gene Prioritization
and Clustering . . . . . . . . . . . . . . . . . . . . . . . . . . . . . . . . . . . . . . . . . . .
5.1 Introduction . . . . . . . . . . . . . . . . . . . . . . . . . . . . . . . . . . . . . . . . . .
5.2 Background: Computational Gene Prioritization . . . . . . . . . . .
5.3 Background: Clustering by Heterogeneous Data Sources . . . .
5.4 Single View Gene Prioritization: A Fragile Model with
Respect to the Uncertainty . . . . . . . . . . . . . . . . . . . . . . . . . . . . .
5.5 Data Fusion for Gene Prioritization: Distribution Free
Method . . . . . . . . . . . . . . . . . . . . . . . . . . . . . . . . . . . . . . . . . . . . . .
5.6 Multi-view Text Mining for Gene Prioritization . . . . . . . . . . .
5.6.1 Construction of Controlled Vocabularies from
Multiple Bio-ontologies . . . . . . . . . . . . . . . . . . . . . . . . . . .
5.6.2 Vocabularies Selected from Subsets of Ontologies . . . .
5.6.3 Merging and Mapping of Controlled Vocabularies . . . .
5.6.4 Text Mining . . . . . . . . . . . . . . . . . . . . . . . . . . . . . . . . . . . .
5.6.5 Dimensionality Reduction of Gene-By-Term Data
by Latent Semantic Indexing . . . . . . . . . . . . . . . . . . . . . .
5.6.6 Algorithms and Evaluation of Gene Prioritization
Task . . . . . . . . . . . . . . . . . . . . . . . . . . . . . . . . . . . . . . . . . . .
5.6.7 Benchmark Data Set of Disease Genes . . . . . . . . . . . . .
5.7 Results of Multi-view Prioritization . . . . . . . . . . . . . . . . . . . . . .
5.7.1 Multi-view Performs Better than Single View . . . . . . .
5.7.2 Effectiveness of Multi-view Demonstrated on
Various Number of Views . . . . . . . . . . . . . . . . . . . . . . . .
5.7.3 Effectiveness of Multi-view Demonstrated on
Disease Examples . . . . . . . . . . . . . . . . . . . . . . . . . . . . . . .
5.8 Multi-view Text Mining for Gene Clustering . . . . . . . . . . . . . .
5.8.1 Algorithms and Evaluation of Gene Clustering
Task . . . . . . . . . . . . . . . . . . . . . . . . . . . . . . . . . . . . . . . . . . .
5.8.2 Benchmark Data Set of Disease Genes . . . . . . . . . . . . .
5.9 Results of Multi-view Clustering . . . . . . . . . . . . . . . . . . . . . . . . .
5.9.1 Multi-view Performs Better than Single View . . . . . . .
5.9.2 Dimensionality Reduction of Gene-By-Term
Profiles for Clustering . . . . . . . . . . . . . . . . . . . . . . . . . . . .
109
109
110
111
112
112
116
116
119
119
122
122
123
124
124
124
126
127
130
130
132
133
133
135
X
Contents
5.9.3 Multi-view Approach Is Better than Merging
Vocabularies . . . . . . . . . . . . . . . . . . . . . . . . . . . . . . . . . . . .
5.9.4 Effectiveness of Multi-view Demonstrated on
Various Numbers of Views . . . . . . . . . . . . . . . . . . . . . . . .
5.9.5 Effectiveness of Multi-view Demonstrated on
Disease Examples . . . . . . . . . . . . . . . . . . . . . . . . . . . . . . .
5.10 Discussions . . . . . . . . . . . . . . . . . . . . . . . . . . . . . . . . . . . . . . . . . . .
5.11 Summary . . . . . . . . . . . . . . . . . . . . . . . . . . . . . . . . . . . . . . . . . . . . .
References . . . . . . . . . . . . . . . . . . . . . . . . . . . . . . . . . . . . . . . . . . . . . . . .
6
7
Optimized Data Fusion for k-means Laplacian
Clustering . . . . . . . . . . . . . . . . . . . . . . . . . . . . . . . . . . . . . . . . . . . . . . .
6.1 Introduction . . . . . . . . . . . . . . . . . . . . . . . . . . . . . . . . . . . . . . . . . .
6.2 Acronyms . . . . . . . . . . . . . . . . . . . . . . . . . . . . . . . . . . . . . . . . . . . .
6.3 Combine Kernel and Laplacian for Clustering . . . . . . . . . . . . .
6.3.1 Combine Kernel and Laplacian as Generalized
Rayleigh Quotient for Clustering . . . . . . . . . . . . . . . . . .
6.3.2 Combine Kernel and Laplacian as Additive Models
for Clustering . . . . . . . . . . . . . . . . . . . . . . . . . . . . . . . . . . .
6.4 Clustering by Multiple Kernels and Laplacians . . . . . . . . . . . .
6.4.1 Optimize A with Given θ . . . . . . . . . . . . . . . . . . . . . . . . .
6.4.2 Optimize θ with Given A . . . . . . . . . . . . . . . . . . . . . . . . .
6.4.3 Algorithm: Optimized Kernel Laplacian
Clustering . . . . . . . . . . . . . . . . . . . . . . . . . . . . . . . . . . . . . .
6.5 Data Sets and Experimental Setup . . . . . . . . . . . . . . . . . . . . . .
6.6 Results . . . . . . . . . . . . . . . . . . . . . . . . . . . . . . . . . . . . . . . . . . . . . . .
6.7 Summary . . . . . . . . . . . . . . . . . . . . . . . . . . . . . . . . . . . . . . . . . . . . .
References . . . . . . . . . . . . . . . . . . . . . . . . . . . . . . . . . . . . . . . . . . . . . . . .
Weighted Multiple Kernel Canonical Correlation . . . . . . . .
7.1 Introduction . . . . . . . . . . . . . . . . . . . . . . . . . . . . . . . . . . . . . . . . . .
7.2 Acronyms . . . . . . . . . . . . . . . . . . . . . . . . . . . . . . . . . . . . . . . . . . . .
7.3 Weighted Multiple Kernel Canonical Correlation . . . . . . . . . .
7.3.1 Linear CCA on Multiple Data Sets . . . . . . . . . . . . . . . .
7.3.2 Multiple Kernel CCA . . . . . . . . . . . . . . . . . . . . . . . . . . . .
7.3.3 Weighted Multiple Kernel CCA . . . . . . . . . . . . . . . . . . .
7.4 Computational Issue . . . . . . . . . . . . . . . . . . . . . . . . . . . . . . . . . . .
7.4.1 Standard Eigenvalue Problem for WMKCCA . . . . . . .
7.4.2 Incomplete Cholesky Decomposition . . . . . . . . . . . . . . .
7.4.3 Incremental Eigenvalue Solution for WMKCCA . . . . .
7.5 Learning from Heterogeneous Data Sources by
WMKCCA . . . . . . . . . . . . . . . . . . . . . . . . . . . . . . . . . . . . . . . . . . .
7.6 Experiment . . . . . . . . . . . . . . . . . . . . . . . . . . . . . . . . . . . . . . . . . . .
7.6.1 Classification in the Canonical Spaces . . . . . . . . . . . . . .
7.6.2 Efficiency of the Incremental EVD Solution . . . . . . . . .
137
137
137
139
140
141
145
145
146
149
149
150
151
153
153
155
156
158
170
171
173
173
174
175
175
175
177
178
178
179
180
181
183
183
185
Contents
XI
7.6.3 Visualization of Data in the Canonical Spaces . . . . . . . 185
7.7 Summary . . . . . . . . . . . . . . . . . . . . . . . . . . . . . . . . . . . . . . . . . . . . . 189
References . . . . . . . . . . . . . . . . . . . . . . . . . . . . . . . . . . . . . . . . . . . . . . . . 190
8
9
Cross-Species Candidate Gene Prioritization with
MerKator . . . . . . . . . . . . . . . . . . . . . . . . . . . . . . . . . . . . . . . . . . . . . . .
8.1 Introduction . . . . . . . . . . . . . . . . . . . . . . . . . . . . . . . . . . . . . . . . . .
8.2 Data Sources . . . . . . . . . . . . . . . . . . . . . . . . . . . . . . . . . . . . . . . . .
8.3 Kernel Workflow . . . . . . . . . . . . . . . . . . . . . . . . . . . . . . . . . . . . . .
8.3.1 Approximation of Kernel Matrices Using
Incomplete Cholesky Decomposition . . . . . . . . . . . . . . .
8.3.2 Kernel Centering . . . . . . . . . . . . . . . . . . . . . . . . . . . . . . . .
8.3.3 Missing Values . . . . . . . . . . . . . . . . . . . . . . . . . . . . . . . . . .
8.4 Cross-Species Integration of Prioritization Scores . . . . . . . . . .
8.5 Software Structure and Interface . . . . . . . . . . . . . . . . . . . . . . . .
8.6 Results and Discussion . . . . . . . . . . . . . . . . . . . . . . . . . . . . . . . . .
8.7 Summary . . . . . . . . . . . . . . . . . . . . . . . . . . . . . . . . . . . . . . . . . . . . .
References . . . . . . . . . . . . . . . . . . . . . . . . . . . . . . . . . . . . . . . . . . . . . . . .
191
191
192
194
194
195
197
197
200
201
203
204
Conclusion . . . . . . . . . . . . . . . . . . . . . . . . . . . . . . . . . . . . . . . . . . . . . . 207
Index . . . . . . . . . . . . . . . . . . . . . . . . . . . . . . . . . . . . . . . . . . . . . . . . . . . . . . . . 209
Acronyms
1-SVM
AdacVote
AL
ARI
BSSE
CCA
CL
CSPA
CV
CVs
EAC
EACAL
ESI
EVD
FDA
GO
HGPA
ICD
ICL
IDF
ILP
KCCA
KEGG
KFDA
KL
KM
LDA
LSI
LS-SVM
MCLA
MEDLINE
One class Support Vector Machine
Adaptive cumulative Voting
Average Linkage Clustering
Adjusted Rand Index
Between Clusters Sum of Squares Error
Canonical Correlation Analysis
Complete Linkage
Cluster based Similarity Partition Algorithm
Controlled Vocabulary
Controlled Vocabularies
Evidence Accumulation Clustering
Evidence Accumulation Clustering with Average Linkage
Essential Science Indicators
Eigenvalue Decomposition
Fisher Discriminant Analysis
The Gene Ontology
Hyper Graph Partitioning Algorithm
Incomplete Cholesky Decomposition
Inductive Constraint Logic
Inverse Document Frequency
Inductive Logic Programming
Kernel Canonical Correlation Analysis
Kyoto Encyclopedia of Genes and Genomes
Kernel Fisher Discriminant Analysis
Kernel Laplacian Clustering
K means clustering
Linear Discriminant Analysis
Latent Semantic Indexing
Least Squares Support Vector Machine
Meta Clustering Algorithm
Medical Literature Analysis and Retrieval System Online
XIV
MKCCA
MKL
MSV
NAML
NMI
PCA
PPI
PSD
QCLP
QCQP
OKKC
OKLC
QMI
QP
RBF
RI
SC
SDP
SILP
SIP
SL
SMO
SOCP
SVD
SVM
TF
TF-IDF
TSSE
WL
WMKCCA
WoS
WSSE
Acronyms
Multiple Kernel Canonical Correlation Analysis
Multiple Kernel Learning
Mean Silhouette Value
Nonlinear Adaptive Metric Learning
Normalized Mutual Information
Principal Component Analysis
Protein Protein Interaction
Positive Semi-definite
Quadratic Constrained Linear Programming
Quadratic Constrained Quadratic Programming
Optimized data fusion for Kernel K-means Clustering
Optimized data fusion for Kernel Laplacian Clustering
Quadratic Mutual Information Clustering
Quadratic Programming
Radial Basis Function
Rand Index
Spectral Clustering
Semi-definite Programming
Semi-infinite Linear Programming
Semi-infinite Programming
Single Linkage Clustering
Sequential Minimization Optimization
Second Order Cone Programming
Singular Value Decomposition
Support Vector Machine
Term Frequency
Term Frequency - Inverse Document Frequency
Total Sum of Squares Error
Ward Linkage
Weighted Multiple Kernel Canonical Correlation Analysis
Web of Science
Within Cluster Sum of Squares Error
Chapter 1
Introduction
When I have presented one point of a subject and the student cannot from it,
learn the other three, I do not repeat my lesson, until one is able to.
– “The Analects, VII.”, Confucius (551 BC - 479 BC) –
1.1
General Background
The history of learning has been accompanied by the pace of evolution and the
progress of civilization. Some modern ideas of learning (e.g., pattern analysis and
machine intelligence) can be traced back thousands of years in the analects of
oriental philosophers [16] and Greek mythologies (e.g., The Antikythera Mechanism [83]). Machine learning, a contemporary topic rooted in computer science and
engineering, has always being inspired and enriched by the unremitting efforts of
biologists and psychologists in their investigation and understanding of the nature.
The Baldwin effect [4], proposed by James Mark Baldwin 110 years ago, concerns
the the costs and benefits of learning in the context of evolution, which has greatly
influenced the development of evolutionary computation. The introduction of perceptron and the backpropagation algorithm have aroused the curiosity and passion
of mathematicians, scientists and engineers to replicate the biological intelligence
by artificial means. About 15 years ago, Vapnik [81] introduced the support vector
method on the basis of kernel functions [1], which has offered plenty of opportunities to solve complicated problems. However, it has also brought lots of interdisciplinary challenges in statistics, optimization theory and applications therein. Though
the scientific fields have witnessed many powerful methods proposed for various
complicated problems, to compare these methods or problems with the primitive
biochemical intelligence exhibited in a unicellular organism, one has to concede
that the expedition of human beings to imitate the adaptability and the exquisiteness
of learning, has just begun.
S. Yu et al.: Kernel-based Data Fusion for Machine Learning, SCI 345, pp. 1–26.
springerlink.com
© Springer-Verlag Berlin Heidelberg 2011
2
1 Introduction
Learning from Multiple Sources
Our brains are amazingly adept at learning from multiple sources. As shown in
Figure 1.1, information travels from multiple senses is integrated and prioritized by
complex calculations using biochemical energy at the brain. These types of integration and prioritization are extraordinarily adapted to environment and stimulus.
For example, a student in the auditorium is listening to a talk of a lecturer, the most
important information comes from the visual and auditory senses. Though at the
very moment the brain is also receiving inputs from the other senses (e.g., the temperature, the smell, the taste), it exquisitely suppresses these less relevant senses
and keeps the concentration on the most important information. This prioritization
also occurs in the senses of the same category. For instance, some sensitive parts of
the body (e.g., fingertips, toes, lips) have much stronger representations than other
less sensitive areas. For human, some abilities of multiple-source learning are given
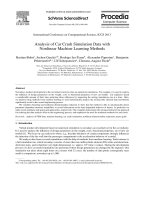
by birth, whereas some others are established by professional training. Figure 1.2
illustrates a mechanical drawing of a simple component in a telescope, which is
composed of projections in several perspectives. Before manufacturing it, an experienced operator of the machine tool investigates all the perspectives in this drawing
and combines these multiple 2-D perspectives into a 3-D reconstruction of the component in his/her mind. These kinds of abilities are more advanced and professional
than the body senses. In the past two centuries, the communications between the
designers and the manufactories in the mechanical industry have been relying on
this type of multi-perspective representation and learning. Whatever products either
tiny components or giant mega-structures are all designed and manufactured in this
Nose
Tongue
Eyes
Ears
Somatosensory
cortex
Touch input
Visual input
Prefrontal
Lobe
Skin
Sensory integration,
Complex Calculations,
Cognition
Auditory input
Gustatory input
Olfactory input
Fig. 1.1 The decision of human beings relies on the integration of multiple senses. Information travels from the eyes is forwarded to the occipital lobes of the brain. Sound information
is analyzed by the auditory cortex in the temporal lobes. Smell and taste are analyzed in
the olfactory bulb contained in prefrontal lobes. Touch information passes to the somatosensory cortex laying out along the brain surface. Information comes from different senses is
integrated and analyzed at the frontal and prefrontal lobes of the brain, where the most complex calculations and cognitions occur. The figure of human body is adapted courtesy of The
Widen Clinic ( Brain figure reproduced courtesy of Barking,
Havering & Redbridge University Hospitals NHS Trust ().
1.1 General Background
3
manner. Currently, some specialized computer softwares (e.g., AutoCAD, TurboCAD) are capable to resemble the human-like representation and reconstruction
process using advanced images and graphics techniques, visualization methods, and
geometry algorithms. However, even with these automatic softwares, the human experts are still the most reliable sources thus human intervention is still indispensable
in any production line.
Fig. 1.2 The method of multiview orthographic projection applied in modern mechanical drawing origins from the applied geometry method developed by Gaspard Monge in
1780s [77]. To visualize a 3-D structure, the component is projected on three orthogonal
planes and different 2-D views are obtained. These views are known as the right side view,
the front view, and the top view in the inverse clockwise order. The drawing of the telescope
component is reproduced courtesy of Barry [5].
In machine learning, we are motivated to imitate the amazing functions of the
brain to incorporate multiple data sources. Human brains are powerful in learning
abstractive knowledge but computers are good at detecting statistical significance
and numerical patterns. In the era of information overflow, data mining and machine learning are indispensable tools to extract useful information and knowledge
from the immense amount of data. To achieve this, many efforts have been spent
on inventing sophisticated methods and constructing huge scale database. Beside
these efforts, an important strategy is to investigate the dimension of information
and data, which may enable us to coordinate the data ocean into homogeneous
threads thus more comprehensive insights could be gained. For example, a lot of
4
1 Introduction
data is observed continuously on a same subject at different time slots such as the
stock market data, the weather monitoring data, the medical records of a patient,
and so on. In research of biology, the amount of data is ever increasing due to the
advances in high throughput biotechnologies. These data sets are often representations of a same group of genomic entities projected in various facets. Thus, the
idea of incorporating more facets of genomic data in analysis may be beneficial, by
reducing the noise, as well as improving statistical significance and leveraging the
interactions and correlations between the genomic entities to obtain more refined
and higher-level information [79], which is known as data fusion.
1.2
1.2.1
Historical Background of Multi-source Learning and Data
Fusion
Canonical Correlation and Its Probabilistic Interpretation
The early approaches of multi-source learning can be dated back to the statistical
methods extracting a set of features for each data source by optimizing a dependency
criterion, such as Canonical correlation Analysis (CCA) [38] and other methods that
optimize mutual information between extracted features [6]. CCA is known to be
solved analytically as a generalized eigenvalue problem. It can also be interpreted as
a probabilistic model [2, 43]. For example, as proposed by Bach and Jordan [2], the
maximum likelihood estimates of the parameters W1 ,W2 ,Ψ1 ,Ψ2 , μ1 , μ2 of the model
illustrated in Figure 1.3:
z ∼ N (0, Id ), min{m1 , m2 } ≥ d ≥ 1
x1 |z ∼ N (W1 z + μ1, Ψ1 ), W1 ∈ Rm1 ×d , Ψ1
x2 |z ∼ N (W2 z + μ2, Ψ2 ), W2 ∈ R
m2 ×d
, Ψ2
0
0
are
W1 = Σ˜ 11U1d M1
W2 = Σ˜ 22U2d M2
Ψ1 = Σ˜ 11 − W1W1T
Ψ2 = Σ˜ 22 − W2W2T
μˆ 1 = μ˜ 1
μˆ 2 = μ˜ 2 ,
where M1 ,M2 ∈ Rd×d are arbitrary matrices such that M1 M2T = Pd and the spectral
norms of M1 and M2 are smaller than one. The i-th columns of U1d and U2d are the
first d canonical directions, and Pd is the diagonal matrix of the first d canonical
correlations.
1.2 Historical Background of Multi-source Learning and Data Fusion
5
x1
z
x2
Fig. 1.3 Graphical model for canonical correlation analysis.
The analytical model and the probabilistic interpretation of CCA enable the use
of local CCA models to identify common underlying patterns or same distributions
from data consist of independent pairs of related data points. The kernel variants of
CCA [35, 46] and multiple CCA are also presented so the common patterns can be
identified in the high dimensional space and more than two data sources.
1.2.2
Inductive Logic Programming and the Multi-source
Learning Search Space
Inductive logic programming(ILP) [53] is a supervised machine learning method
which combines automatic learning and first order logic programming [50]. The
automatic solving and deduction machinery requires three main sets of information
[65]:
1. a set of known vocabulary, rules, axioms or predicates, describing the domain
knowledge base K ;
2. a set of positive examples E + that the system is supposed to describe or characterize with the set of predicates of K ;
3. a set of negative examples E − that should be excluded from the deducted
description or characterization.
Given these data, an ILP solver then finds a set of hypotheses H expressed with
the predicates and terminal vocabulary of K such that the largest possible subset
of E + verifies H , and such that the largest possible subset of E − does not verify
H . The hypotheses in H are searched in a so-called hypothesis space. Different
strategies can be used to explore the hypothesis search space (e.g., the Inductive
constraint logic (ICL) proposed by De Raedt & Van Laer [23]). The search stops
when it reaches a clause that covers no negative example but covers some positive
examples. At each step, the best clause is refined by adding new literals to its body
or applying variable substitutions. The search space can be restricted by a so-called
language bias (e.g., a declarative bias used by ICL [22]).
In ILP, data points indexed by the same identifier are represented in various data
sources and then merged by an aggregation operation, which can be simply a set
6
1 Introduction
union function associated to the inconsistency elimination. However, the aggregation may result in searching a huge space, which in many situations is too computational demanding [32]. Fromont et al. thus propose a solution to learn rules independently from each sources; then the learned rules are used to bias a new learning
process from the aggregated data [32].
1.2.3
Additive Models
The idea of using multiple classifiers has received increasing attentions as it has
been realized that such approaches can be more robust (e.g., less sensitive to the
tuning of their internal parameters, to inaccuracies and other defects in the data)
and be more accurate than a single classifier alone. These approaches are characterized as to learn multiple models independently or dependently and then to learn
a unified “powerful” model using the aggregation of learned models, known as the
additive models. Bagging and boosting are probably the most well known learning
techniques based on additive models.
Bootstrap aggregation, or bagging, is a technique proposed by Breiman [11] that
can be used with many classification methods and regression methods to reduce the
variance associated with prediction, and thereby improve the prediction process. It is
a relatively simple idea: many bootstrap samples are drawn from the available data,
some prediction method is applied to each bootstrap sample, and then the results are
combined, by averaging for regression and simple voting for classification, to obtain
the overall prediction, with the variance being reduced due to the averaging [74].
Boosting, like bagging, is a committee-based approach that can be used to improve the accuracy of classification or regression methods. Unlike bagging, which
uses a simple averaging of results to obtain an overall prediction, boosting uses a
weighted average of results obtained from applying a prediction method to various
samples [74]. The motivation for boosting is a procedure that combines the outputs
of many “weak” classifiers to produce a powerful “committee”. The most popular boosting framework is proposed by Freund and Schapire called “AdaBoost.M1”
[29]. The “weak classifier” in boosting can be assigned as any classifier (e.g., when
applying the classification tree as the “base learner” the improvements are often dramatic [10]). Though boosting is originally proposed to combine “weak classifiers”,
some approaches also involve “strong classifiers” in the boosting framework (e.g.,
the ensemble of Feed-forward neural networks [26][45]).
In boosting, the elementary objective function is extended from a single source
to multiple sources through additive expansion. More generally, the basis function
expansions take the form
p
f (x) =
∑ θ j b(x; γ j ),
(1.1)
j=1
where θ j is the expansion coefficient, j = 1, ..., p is the number of models, and
b(x; γ ) ∈ R are usually simple functions of the multivariate input x, characterized
1.2 Historical Background of Multi-source Learning and Data Fusion
7
by a set of parameters γ [36]. The notion of additive expansions in mono-source can
be straightforwardly extended to multi-source learning as
p
∑ θ j b(x j ; γ j ),
f (x j ) =
(1.2)
j=1
where the input x j as multiple representations of a data point. The prediction function is therefore given by
p
P(x) = sign
∑ θ j Pj (x j )
,
(1.3)
j=1
where Pj (x j ) is the prediction function of each single data source. The additive
expansions in this form are the essence of many machine learning techniques proposed for enhanced mono-source learning or multi-source learning.
1.2.4
Bayesian Networks for Data Fusion
Bayesian networks [59] are probabilistic models that graphically encode probabilistic dependencies between random variables [59]. The graphical structure of the
model imposes qualitative dependence constraints. A simple example of Bayesian
network is shown in Figure 1.4. A directed arc between variables z and x1 denotes
conditional dependency of x1 on z, as determined by the direction of the arc. The
dependencies in Bayesian networks are measured quantitatively. For each variable
and its parents this measure is defined using a conditional probability function or a
table (e.g., the Conditional Probability Tables). In Figure 1.4, the measure of dependency of x1 on z is the probability p(x1 |z). The graphical dependency structure and
p( z )
0.2
z
x1
x2
x3
p ( x1 | z )
0.25
p ( x2 | z )
0.003
p ( x3 | z )
0.95
p ( x1 | z )
0.05
p ( x2 | z )
0.8
p ( x3 | z )
0.0005
Fig. 1.4 A simple Bayesian network
8
1 Introduction
the local probability models completely specify a Bayesian network probabilistic
model. Hence, Figure 1.4 defines p(z, x1 , x2 , x3 ) to be
p(z, x1 , x2 , x3 ) = p(x1 |z)p(x2 |z)p(x3 |z)p(z).
(1.4)
To determine a Bayesian network from the data, one need to learn its structure
(structural learning) and its conditional probability distributions (parameter learning) [34]. To determine the structure, the sampling methods based on Markov Chain
Monte Carlo (MCMC) or the variational methods are often adopted. The two key
components of a structure learning algorithm are searching for “good” structures
and scoring these structures. Since the number of model structures is large (superexponential), a search method is required to decide which structures to score. Even
with few nodes, there are too many possible networks to exhaustively score each
one. When the number of nodes is large, the task becomes very challenging. Efficient structure learning algorithm design is an active research area. For example, the
K2 greedy search algorithm [17] starts with an initial network (possibly with no (or
full) connectivity) and iteratively adding, deleting, or reversing an edge, measuring
the accuracy of the resulting network at each stage, until a local maxima is found.
Alternatively, a method such as simulated annealing guides the search to the global
maximum [34, 55]. There are two common approaches used to decide on a “good”
structure. The first is to test whether the conditional independence assertions implied by the network structure are satisfied by the data. The second approach is to
assess the degree to which the resulting structure explains the data. This is done using a score function which is typically based on approximations of the full posterior
distribution of the parameters for the model structure is computed. In real applications, it is often required to learn the structure from incomplete data containing
missing values. Several specific algorithms are proposed for structural learning with
incomplete data, for instance, the AMS-EM greedy search algorithm proposed by
Friedman [30], the combination of evolutionary algorithms and MCMC proposed
by Myers [54], the Robust Bayesian Estimation proposed by Ramoni and Sebastiani [62], the Hybrid Independence Test proposed by Dash and Druzdzel [21], and
so on.
The second step of Bayesian network building consists of estimating the parameters that maximize the likelihood that the observed data came from the given
dependency structure. To consider the uncertainty about parameters θ in a prior distribution p(θ ), one uses data d to update this distribution, and hereby obtains the
posterior distribution p(θ |d) using Bayes’ theorem as
p(θ |d) =
p(d|θ )p(θ )
, θ ∈ Θ,
p(d)
(1.5)
where Θ is the parameter space, d is a random sample from the distribution p(d) and
p(d|θ ) is likelihood of θ . To maximize the posterior, the Expectation-Maximization
(EM) algorithm [25] is often used. The prior distribution describes one’s state of
knowledge (or lack of it) about the parameter values before examining the data. The
prior can also be incorporated in structural learning. Obviously, the choice of the
1.2 Historical Background of Multi-source Learning and Data Fusion
9
prior is a critical issue in Bayesian network learning, in practice, it rarely happens
that the available prior information is precise enough to lead to an exact determination of the prior distribution. If the prior distribution is too narrow it will dominate
the posterior and can be used only to express the precise knowledge. Thus, if one
has no knowledge at all about the value of a parameter prior to observing the data,
the chosen prior probability function should be very broad (non-informative prior)
and at relatively to the expected likelihood function.
By far we have very briefly introduced the Bayesian networks. As probabilistic
models, Bayesian networks provide a convenient framework for the combination
of evidences from multiple sources. The data can be integrated as full integration,
partial integration and decision integration [34], which are briefly concluded as
follows.
Full Integration
In full integration, the multiple data sources are combined at the data level as one
data set. In this manner the developed model can contain any type of relationship
among the variables in different data sources [34].
Partial Integration
In partial integration, the structure learning of Bayesian network is performed separately on each data, which results in multiple dependency structures have only one
variable (the outcome) in common. The outcome variable allows joining the separate
structures into one structure. In the parameter learning step, the parameter learning
proceeds as usual because this step is independent of how the structure was built.
Partial integration forbids link among variables of multiple sources, which is similar to imposing additional restrictions in full integration where no links are allowed
among variables across data sources [34].
Decision Integration
The decision integration method learns a sperate model for each data source and the
probabilities predicted for the outcome variable are combined using the weighted
coefficients. The weighted coefficients are trained using the model building data set
with randomizations [34].
1.2.5
Kernel-based Data Fusion
In the learning phase of Bayesian networks, a set of training data is used either to
obtain the point estimate of the parameter vector or to determine a posterior distribution over this vector. The training data is then discarded, and predictions for
new inputs are based purely on the learned structure and parameter vector [7]. This
approach is also used in nonlinear parametric models such as neural networks [7].