IT training statistical learning with sparsity the lasso and generalizations hastie, tibshirani wainwright 2015 06 18 1
Bạn đang xem bản rút gọn của tài liệu. Xem và tải ngay bản đầy đủ của tài liệu tại đây (16.9 MB, 367 trang )
Monographs on Statistics and Applied Probability 143
Statistical Learning
with Sparsity
The Lasso and
Generalizations
Trevor Hastie
Stanford University
USA
Robert Tibshirani
Stanford University
USA
Martin Wainwright
University of California, Berkeley
USA
© 2015 by Taylor & Francis Group, LLC
K25103_FM.indd 1
4/3/15 11:45 AM
MONOGRAPHS ON STATISTICS AND APPLIED PROBABILITY
General Editors
F. Bunea, V. Isham, N. Keiding, T. Louis, R. L. Smith, and H. Tong
1.
2.
3.
4.
5.
6.
7.
8.
9.
10.
11.
12.
13.
14.
15.
16.
17.
18.
19.
20.
21.
22.
23.
24.
25.
26.
27.
28.
29.
30.
31.
32.
33.
34.
35.
36.
37.
38.
39.
40.
41.
42.
43.
44.
45.
46.
47.
Stochastic Population Models in Ecology and Epidemiology M.S. Barlett (1960)
Queues D.R. Cox and W.L. Smith (1961)
Monte Carlo Methods J.M. Hammersley and D.C. Handscomb (1964)
The Statistical Analysis of Series of Events D.R. Cox and P.A.W. Lewis (1966)
Population Genetics W.J. Ewens (1969)
Probability, Statistics and Time M.S. Barlett (1975)
Statistical Inference S.D. Silvey (1975)
The Analysis of Contingency Tables B.S. Everitt (1977)
Multivariate Analysis in Behavioural Research A.E. Maxwell (1977)
Stochastic Abundance Models S. Engen (1978)
Some Basic Theory for Statistical Inference E.J.G. Pitman (1979)
Point Processes D.R. Cox and V. Isham (1980)
Identification of Outliers D.M. Hawkins (1980)
Optimal Design S.D. Silvey (1980)
Finite Mixture Distributions B.S. Everitt and D.J. Hand (1981)
Classification A.D. Gordon (1981)
Distribution-Free Statistical Methods, 2nd edition J.S. Maritz (1995)
Residuals and Influence in Regression R.D. Cook and S. Weisberg (1982)
Applications of Queueing Theory, 2nd edition G.F. Newell (1982)
Risk Theory, 3rd edition R.E. Beard, T. Pentikäinen and E. Pesonen (1984)
Analysis of Survival Data D.R. Cox and D. Oakes (1984)
An Introduction to Latent Variable Models B.S. Everitt (1984)
Bandit Problems D.A. Berry and B. Fristedt (1985)
Stochastic Modelling and Control M.H.A. Davis and R. Vinter (1985)
The Statistical Analysis of Composition Data J. Aitchison (1986)
Density Estimation for Statistics and Data Analysis B.W. Silverman (1986)
Regression Analysis with Applications G.B. Wetherill (1986)
Sequential Methods in Statistics, 3rd edition G.B. Wetherill and K.D. Glazebrook (1986)
Tensor Methods in Statistics P. McCullagh (1987)
Transformation and Weighting in Regression R.J. Carroll and D. Ruppert (1988)
Asymptotic Techniques for Use in Statistics O.E. Bandorff-Nielsen and D.R. Cox (1989)
Analysis of Binary Data, 2nd edition D.R. Cox and E.J. Snell (1989)
Analysis of Infectious Disease Data N.G. Becker (1989)
Design and Analysis of Cross-Over Trials B. Jones and M.G. Kenward (1989)
Empirical Bayes Methods, 2nd edition J.S. Maritz and T. Lwin (1989)
Symmetric Multivariate and Related Distributions K.T. Fang, S. Kotz and K.W. Ng (1990)
Generalized Linear Models, 2nd edition P. McCullagh and J.A. Nelder (1989)
Cyclic and Computer Generated Designs, 2nd edition J.A. John and E.R. Williams (1995)
Analog Estimation Methods in Econometrics C.F. Manski (1988)
Subset Selection in Regression A.J. Miller (1990)
Analysis of Repeated Measures M.J. Crowder and D.J. Hand (1990)
Statistical Reasoning with Imprecise Probabilities P. Walley (1991)
Generalized Additive Models T.J. Hastie and R.J. Tibshirani (1990)
Inspection Errors for Attributes in Quality Control N.L. Johnson, S. Kotz and X. Wu (1991)
The Analysis of Contingency Tables, 2nd edition B.S. Everitt (1992)
The Analysis of Quantal Response Data B.J.T. Morgan (1992)
Longitudinal Data with Serial Correlation—A State-Space Approach R.H. Jones (1993)
© 2015 by Taylor & Francis Group, LLC
K25103_FM.indd 2
4/3/15 11:45 AM
48.
49.
50.
51.
52.
53.
54.
55.
56.
57.
58.
59.
60.
61.
62.
63.
64.
65.
66.
67.
68.
69.
70.
71.
72.
73.
74.
75.
76.
77.
78.
79.
80.
81.
82.
83.
84.
85.
86.
87.
88.
89.
90.
91.
92.
93.
94.
Differential Geometry and Statistics M.K. Murray and J.W. Rice (1993)
Markov Models and Optimization M.H.A. Davis (1993)
Networks and Chaos—Statistical and Probabilistic Aspects
O.E. Barndorff-Nielsen, J.L. Jensen and W.S. Kendall (1993)
Number-Theoretic Methods in Statistics K.-T. Fang and Y. Wang (1994)
Inference and Asymptotics O.E. Barndorff-Nielsen and D.R. Cox (1994)
Practical Risk Theory for Actuaries C.D. Daykin, T. Pentikäinen and M. Pesonen (1994)
Biplots J.C. Gower and D.J. Hand (1996)
Predictive Inference—An Introduction S. Geisser (1993)
Model-Free Curve Estimation M.E. Tarter and M.D. Lock (1993)
An Introduction to the Bootstrap B. Efron and R.J. Tibshirani (1993)
Nonparametric Regression and Generalized Linear Models P.J. Green and B.W. Silverman (1994)
Multidimensional Scaling T.F. Cox and M.A.A. Cox (1994)
Kernel Smoothing M.P. Wand and M.C. Jones (1995)
Statistics for Long Memory Processes J. Beran (1995)
Nonlinear Models for Repeated Measurement Data M. Davidian and D.M. Giltinan (1995)
Measurement Error in Nonlinear Models R.J. Carroll, D. Rupert and L.A. Stefanski (1995)
Analyzing and Modeling Rank Data J.J. Marden (1995)
Time Series Models—In Econometrics, Finance and Other Fields
D.R. Cox, D.V. Hinkley and O.E. Barndorff-Nielsen (1996)
Local Polynomial Modeling and its Applications J. Fan and I. Gijbels (1996)
Multivariate Dependencies—Models, Analysis and Interpretation D.R. Cox and N. Wermuth (1996)
Statistical Inference—Based on the Likelihood A. Azzalini (1996)
Bayes and Empirical Bayes Methods for Data Analysis B.P. Carlin and T.A Louis (1996)
Hidden Markov and Other Models for Discrete-Valued Time Series I.L. MacDonald and W. Zucchini (1997)
Statistical Evidence—A Likelihood Paradigm R. Royall (1997)
Analysis of Incomplete Multivariate Data J.L. Schafer (1997)
Multivariate Models and Dependence Concepts H. Joe (1997)
Theory of Sample Surveys M.E. Thompson (1997)
Retrial Queues G. Falin and J.G.C. Templeton (1997)
Theory of Dispersion Models B. Jørgensen (1997)
Mixed Poisson Processes J. Grandell (1997)
Variance Components Estimation—Mixed Models, Methodologies and Applications P.S.R.S. Rao (1997)
Bayesian Methods for Finite Population Sampling G. Meeden and M. Ghosh (1997)
Stochastic Geometry—Likelihood and computation
O.E. Barndorff-Nielsen, W.S. Kendall and M.N.M. van Lieshout (1998)
Computer-Assisted Analysis of Mixtures and Applications—Meta-Analysis, Disease Mapping and Others
D. Böhning (1999)
Classification, 2nd edition A.D. Gordon (1999)
Semimartingales and their Statistical Inference B.L.S. Prakasa Rao (1999)
Statistical Aspects of BSE and vCJD—Models for Epidemics C.A. Donnelly and N.M. Ferguson (1999)
Set-Indexed Martingales G. Ivanoff and E. Merzbach (2000)
The Theory of the Design of Experiments D.R. Cox and N. Reid (2000)
Complex Stochastic Systems O.E. Barndorff-Nielsen, D.R. Cox and C. Klüppelberg (2001)
Multidimensional Scaling, 2nd edition T.F. Cox and M.A.A. Cox (2001)
Algebraic Statistics—Computational Commutative Algebra in Statistics
G. Pistone, E. Riccomagno and H.P. Wynn (2001)
Analysis of Time Series Structure—SSA and Related Techniques
N. Golyandina, V. Nekrutkin and A.A. Zhigljavsky (2001)
Subjective Probability Models for Lifetimes Fabio Spizzichino (2001)
Empirical Likelihood Art B. Owen (2001)
Statistics in the 21st Century Adrian E. Raftery, Martin A. Tanner, and Martin T. Wells (2001)
Accelerated Life Models: Modeling and Statistical Analysis
Vilijandas Bagdonavicius and Mikhail Nikulin (2001)
© 2015 by Taylor & Francis Group, LLC
K25103_FM.indd 3
4/3/15 11:45 AM
95.
96.
97.
98.
99.
100.
101.
102.
103.
104.
105.
106.
107.
108.
109.
110.
111.
112.
113.
114.
115.
116.
117.
118.
119.
120.
121.
122.
123.
124.
125.
126.
127.
128.
129.
130.
131.
132.
133.
134.
135.
Subset Selection in Regression, Second Edition Alan Miller (2002)
Topics in Modelling of Clustered Data Marc Aerts, Helena Geys, Geert Molenberghs, and Louise M. Ryan (2002)
Components of Variance D.R. Cox and P.J. Solomon (2002)
Design and Analysis of Cross-Over Trials, 2nd Edition Byron Jones and Michael G. Kenward (2003)
Extreme Values in Finance, Telecommunications, and the Environment
Bärbel Finkenstädt and Holger Rootzén (2003)
Statistical Inference and Simulation for Spatial Point Processes
Jesper Møller and Rasmus Plenge Waagepetersen (2004)
Hierarchical Modeling and Analysis for Spatial Data
Sudipto Banerjee, Bradley P. Carlin, and Alan E. Gelfand (2004)
Diagnostic Checks in Time Series Wai Keung Li (2004)
Stereology for Statisticians Adrian Baddeley and Eva B. Vedel Jensen (2004)
Gaussian Markov Random Fields: Theory and Applications H˚avard Rue and Leonhard Held (2005)
Measurement Error in Nonlinear Models: A Modern Perspective, Second Edition
Raymond J. Carroll, David Ruppert, Leonard A. Stefanski, and Ciprian M. Crainiceanu (2006)
Generalized Linear Models with Random Effects: Unified Analysis via H-likelihood
Youngjo Lee, John A. Nelder, and Yudi Pawitan (2006)
Statistical Methods for Spatio-Temporal Systems
Bärbel Finkenstädt, Leonhard Held, and Valerie Isham (2007)
Nonlinear Time Series: Semiparametric and Nonparametric Methods Jiti Gao (2007)
Missing Data in Longitudinal Studies: Strategies for Bayesian Modeling and Sensitivity Analysis
Michael J. Daniels and Joseph W. Hogan (2008)
Hidden Markov Models for Time Series: An Introduction Using R
Walter Zucchini and Iain L. MacDonald (2009)
ROC Curves for Continuous Data Wojtek J. Krzanowski and David J. Hand (2009)
Antedependence Models for Longitudinal Data Dale L. Zimmerman and Vicente A. Núđez-Antón (2009)
Mixed Effects Models for Complex Data Lang Wu (2010)
Intoduction to Time Series Modeling Genshiro Kitagawa (2010)
Expansions and Asymptotics for Statistics Christopher G. Small (2010)
Statistical Inference: An Integrated Bayesian/Likelihood Approach Murray Aitkin (2010)
Circular and Linear Regression: Fitting Circles and Lines by Least Squares Nikolai Chernov (2010)
Simultaneous Inference in Regression Wei Liu (2010)
Robust Nonparametric Statistical Methods, Second Edition
Thomas P. Hettmansperger and Joseph W. McKean (2011)
Statistical Inference: The Minimum Distance Approach
Ayanendranath Basu, Hiroyuki Shioya, and Chanseok Park (2011)
Smoothing Splines: Methods and Applications Yuedong Wang (2011)
Extreme Value Methods with Applications to Finance Serguei Y. Novak (2012)
Dynamic Prediction in Clinical Survival Analysis Hans C. van Houwelingen and Hein Putter (2012)
Statistical Methods for Stochastic Differential Equations
Mathieu Kessler, Alexander Lindner, and Michael Sørensen (2012)
Maximum Likelihood Estimation for Sample Surveys
R. L. Chambers, D. G. Steel, Suojin Wang, and A. H. Welsh (2012)
Mean Field Simulation for Monte Carlo Integration Pierre Del Moral (2013)
Analysis of Variance for Functional Data Jin-Ting Zhang (2013)
Statistical Analysis of Spatial and Spatio-Temporal Point Patterns, Third Edition Peter J. Diggle (2013)
Constrained Principal Component Analysis and Related Techniques Yoshio Takane (2014)
Randomised Response-Adaptive Designs in Clinical Trials Anthony C. Atkinson and Atanu Biswas (2014)
Theory of Factorial Design: Single- and Multi-Stratum Experiments Ching-Shui Cheng (2014)
Quasi-Least Squares Regression Justine Shults and Joseph M. Hilbe (2014)
Data Analysis and Approximate Models: Model Choice, Location-Scale, Analysis of Variance, Nonparametric
Regression and Image Analysis Laurie Davies (2014)
Dependence Modeling with Copulas Harry Joe (2014)
Hierarchical Modeling and Analysis for Spatial Data, Second Edition Sudipto Banerjee, Bradley P. Carlin,
and Alan E. Gelfand (2014)
© 2015 by Taylor & Francis Group, LLC
K25103_FM.indd 4
4/3/15 11:45 AM
136. Sequential Analysis: Hypothesis Testing and Changepoint Detection Alexander Tartakovsky, Igor Nikiforov,
and Michèle Basseville (2015)
137. Robust Cluster Analysis and Variable Selection Gunter Ritter (2015)
138. Design and Analysis of Cross-Over Trials, Third Edition Byron Jones and Michael G. Kenward (2015)
139. Introduction to High-Dimensional Statistics Christophe Giraud (2015)
140. Pareto Distributions: Second Edition Barry C. Arnold (2015)
141. Bayesian Inference for Partially Identified Models: Exploring the Limits of Limited Data Paul Gustafson (2015)
142. Models for Dependent Time Series Granville Tunnicliffe Wilson, Marco Reale, John Haywood (2015)
143. Statistical Learning with Sparsity: The Lasso and Generalizations Trevor Hastie, Robert Tibshirani, and
Martin Wainwright (2015)
© 2015 by Taylor & Francis Group, LLC
K25103_FM.indd 5
4/3/15 11:45 AM
CRC Press
Taylor & Francis Group
6000 Broken Sound Parkway NW, Suite 300
Boca Raton, FL 33487-2742
© 2015 by Taylor & Francis Group, LLC
CRC Press is an imprint of Taylor & Francis Group, an Informa business
No claim to original U.S. Government works
Version Date: 20150316
International Standard Book Number-13: 978-1-4987-1217-0 (eBook - PDF)
This book contains information obtained from authentic and highly regarded sources. Reasonable
efforts have been made to publish reliable data and information, but the author and publisher cannot
assume responsibility for the validity of all materials or the consequences of their use. The authors and
publishers have attempted to trace the copyright holders of all material reproduced in this publication
and apologize to copyright holders if permission to publish in this form has not been obtained. If any
copyright material has not been acknowledged please write and let us know so we may rectify in any
future reprint.
Except as permitted under U.S. Copyright Law, no part of this book may be reprinted, reproduced,
transmitted, or utilized in any form by any electronic, mechanical, or other means, now known or
hereafter invented, including photocopying, microfilming, and recording, or in any information storage or retrieval system, without written permission from the publishers.
For permission to photocopy or use material electronically from this work, please access www.copyright.com ( or contact the Copyright Clearance Center, Inc. (CCC), 222
Rosewood Drive, Danvers, MA 01923, 978-750-8400. CCC is a not-for-profit organization that provides licenses and registration for a variety of users. For organizations that have been granted a photocopy license by the CCC, a separate system of payment has been arranged.
Trademark Notice: Product or corporate names may be trademarks or registered trademarks, and are
used only for identification and explanation without intent to infringe.
Visit the Taylor & Francis Web site at
and the CRC Press Web site at
© 2015 by Taylor & Francis Group, LLC
To our parents:
Valerie and Patrick Hastie
Vera and Sami Tibshirani
Patricia and John Wainwright
and to our families:
Samantha, Timothy, and Lynda
Charlie, Ryan, Jess, Julie, and Cheryl
Haruko and Hana
© 2015 by Taylor & Francis Group, LLC
© 2015 by Taylor & Francis Group, LLC
Contents
Preface
xv
1 Introduction
1
2 The
2.1
2.2
2.3
2.4
Lasso for Linear Models
Introduction
The Lasso Estimator
Cross-Validation and Inference
Computation of the Lasso Solution
2.4.1 Single Predictor: Soft Thresholding
2.4.2 Multiple Predictors: Cyclic Coordinate Descent
2.4.3 Soft-Thresholding and Orthogonal Bases
2.5 Degrees of Freedom
2.6 Uniqueness of the Lasso Solutions
2.7 A Glimpse at the Theory
2.8 The Nonnegative Garrote
2.9 q Penalties and Bayes Estimates
2.10 Some Perspective
Exercises
7
7
8
13
14
15
16
17
17
19
20
20
22
23
24
3 Generalized Linear Models
3.1 Introduction
3.2 Logistic Regression
3.2.1 Example: Document Classification
3.2.2 Algorithms
3.3 Multiclass Logistic Regression
3.3.1 Example: Handwritten Digits
3.3.2 Algorithms
3.3.3 Grouped-Lasso Multinomial
3.4 Log-Linear Models and the Poisson GLM
3.4.1 Example: Distribution Smoothing
3.5 Cox Proportional Hazards Models
3.5.1 Cross-Validation
3.5.2 Pre-Validation
3.6 Support Vector Machines
3.6.1 Logistic Regression with Separable Data
29
29
31
32
35
36
37
39
39
40
40
42
43
45
46
49
ix
© 2015 by Taylor & Francis Group, LLC
x
3.7 Computational Details and glmnet
Bibliographic Notes
Exercises
4 Generalizations of the Lasso Penalty
4.1 Introduction
4.2 The Elastic Net
4.3 The Group Lasso
4.3.1 Computation for the Group Lasso
4.3.2 Sparse Group Lasso
4.3.3 The Overlap Group Lasso
4.4 Sparse Additive Models and the Group Lasso
4.4.1 Additive Models and Backfitting
4.4.2 Sparse Additive Models and Backfitting
4.4.3 Approaches Using Optimization and the Group Lasso
4.4.4 Multiple Penalization for Sparse Additive Models
4.5 The Fused Lasso
4.5.1 Fitting the Fused Lasso
4.5.1.1 Reparametrization
4.5.1.2 A Path Algorithm
4.5.1.3 A Dual Path Algorithm
4.5.1.4 Dynamic Programming for the Fused Lasso
4.5.2 Trend Filtering
4.5.3 Nearly Isotonic Regression
4.6 Nonconvex Penalties
Bibliographic Notes
Exercises
5 Optimization Methods
5.1 Introduction
5.2 Convex Optimality Conditions
5.2.1 Optimality for Differentiable Problems
5.2.2 Nondifferentiable Functions and Subgradients
5.3 Gradient Descent
5.3.1 Unconstrained Gradient Descent
5.3.2 Projected Gradient Methods
5.3.3 Proximal Gradient Methods
5.3.4 Accelerated Gradient Methods
5.4 Coordinate Descent
5.4.1 Separability and Coordinate Descent
5.4.2 Linear Regression and the Lasso
5.4.3 Logistic Regression and Generalized Linear Models
5.5 A Simulation Study
5.6 Least Angle Regression
5.7 Alternating Direction Method of Multipliers
© 2015 by Taylor & Francis Group, LLC
50
52
53
55
55
56
58
62
64
65
69
69
70
72
74
76
77
78
79
79
80
81
83
84
86
88
95
95
95
95
98
100
101
102
103
107
109
110
112
115
117
118
121
xi
5.8 Minorization-Maximization Algorithms
5.9 Biconvexity and Alternating Minimization
5.10 Screening Rules
Bibliographic Notes
Appendix
Exercises
123
124
127
131
132
134
6 Statistical Inference
6.1 The Bayesian Lasso
6.2 The Bootstrap
6.3 Post-Selection Inference for the Lasso
6.3.1 The Covariance Test
6.3.2 A General Scheme for Post-Selection Inference
6.3.2.1 Fixed-λ Inference for the Lasso
6.3.2.2 The Spacing Test for LAR
6.3.3 What Hypothesis Is Being Tested?
6.3.4 Back to Forward Stepwise Regression
6.4 Inference via a Debiased Lasso
6.5 Other Proposals for Post-Selection Inference
Bibliographic Notes
Exercises
139
139
142
147
147
150
154
156
157
158
158
160
161
162
7 Matrix Decompositions, Approximations, and Completion
7.1 Introduction
7.2 The Singular Value Decomposition
7.3 Missing Data and Matrix Completion
7.3.1 The Netflix Movie Challenge
7.3.2 Matrix Completion Using Nuclear Norm
7.3.3 Theoretical Results for Matrix Completion
7.3.4 Maximum Margin Factorization and Related Methods
7.4 Reduced-Rank Regression
7.5 A General Matrix Regression Framework
7.6 Penalized Matrix Decomposition
7.7 Additive Matrix Decomposition
Bibliographic Notes
Exercises
167
167
169
169
170
174
177
181
184
185
187
190
195
196
8 Sparse Multivariate Methods
8.1 Introduction
8.2 Sparse Principal Components Analysis
8.2.1 Some Background
8.2.2 Sparse Principal Components
8.2.2.1 Sparsity from Maximum Variance
8.2.2.2 Methods Based on Reconstruction
8.2.3 Higher-Rank Solutions
201
201
202
202
204
204
206
207
© 2015 by Taylor & Francis Group, LLC
xii
8.2.3.1 Illustrative Application of Sparse PCA
Sparse PCA via Fantope Projection
Sparse Autoencoders and Deep Learning
Some Theory for Sparse PCA
8.3
Canonical Correlation Analysis
Example: Netflix Movie Rating Data
8.4
Linear Discriminant Analysis
Normal Theory and Bayes’ Rule
Nearest Shrunken Centroids
Fisher’s Linear Discriminant Analysis
8.4.3.1 Example: Simulated Data with Five Classes
8.4.4 Optimal Scoring
8.4.4.1 Example: Face Silhouettes
8.5 Sparse Clustering
8.5.1 Some Background on Clustering
8.5.1.1 Example: Simulated Data with Six Classes
8.5.2 Sparse Hierarchical Clustering
8.5.3 Sparse K-Means Clustering
8.5.4 Convex Clustering
Bibliographic Notes
Exercises
8.2.4
8.2.5
8.2.6
Sparse
8.3.1
Sparse
8.4.1
8.4.2
8.4.3
9 Graphs and Model Selection
9.1 Introduction
9.2 Basics of Graphical Models
9.2.1 Factorization and Markov Properties
9.2.1.1 Factorization Property
9.2.1.2 Markov Property
9.2.1.3 Equivalence of Factorization and Markov
Properties
9.2.2 Some Examples
9.2.2.1 Discrete Graphical Models
9.2.2.2 Gaussian Graphical Models
9.3 Graph Selection via Penalized Likelihood
9.3.1 Global Likelihoods for Gaussian Models
9.3.2 Graphical Lasso Algorithm
9.3.3 Exploiting Block-Diagonal Structure
9.3.4 Theoretical Guarantees for the Graphical Lasso
9.3.5 Global Likelihood for Discrete Models
9.4 Graph Selection via Conditional Inference
9.4.1 Neighborhood-Based Likelihood for Gaussians
9.4.2 Neighborhood-Based Likelihood for Discrete Models
9.4.3 Pseudo-Likelihood for Mixed Models
9.5 Graphical Models with Hidden Variables
Bibliographic Notes
© 2015 by Taylor & Francis Group, LLC
209
210
210
212
213
215
217
217
218
221
222
225
226
227
227
228
228
230
231
232
234
241
241
241
241
242
243
243
244
244
245
246
247
248
251
252
253
254
255
256
259
261
261
xiii
Exercises
263
10 Signal Approximation and Compressed Sensing
10.1 Introduction
10.2 Signals and Sparse Representations
10.2.1 Orthogonal Bases
10.2.2 Approximation in Orthogonal Bases
10.2.3 Reconstruction in Overcomplete Bases
10.3 Random Projection and Approximation
10.3.1 Johnson–Lindenstrauss Approximation
10.3.2 Compressed Sensing
10.4 Equivalence between 0 and 1 Recovery
10.4.1 Restricted Nullspace Property
10.4.2 Sufficient Conditions for Restricted Nullspace
10.4.3 Proofs
10.4.3.1 Proof of Theorem 10.1
10.4.3.2 Proof of Proposition 10.1
Bibliographic Notes
Exercises
269
269
269
269
271
274
276
277
278
280
281
282
284
284
284
285
286
11 Theoretical Results for the Lasso
11.1 Introduction
11.1.1 Types of Loss Functions
11.1.2 Types of Sparsity Models
11.2 Bounds on Lasso 2 -Error
11.2.1 Strong Convexity in the Classical Setting
11.2.2 Restricted Eigenvalues for Regression
11.2.3 A Basic Consistency Result
11.3 Bounds on Prediction Error
11.4 Support Recovery in Linear Regression
11.4.1 Variable-Selection Consistency for the Lasso
11.4.1.1 Some Numerical Studies
11.4.2 Proof of Theorem 11.3
11.5 Beyond the Basic Lasso
Bibliographic Notes
Exercises
289
289
289
290
291
291
293
294
299
301
301
303
305
309
311
312
Bibliography
315
Author Index
337
Index
343
© 2015 by Taylor & Francis Group, LLC
© 2015 by Taylor & Francis Group, LLC
Preface
In this monograph, we have attempted to summarize the actively developing
field of statistical learning with sparsity. A sparse statistical model is one
having only a small number of nonzero parameters or weights. It represents a
classic case of “less is more”: a sparse model can be much easier to estimate
and interpret than a dense model. In this age of big data, the number of
features measured on a person or object can be large, and might be larger
than the number of observations. The sparsity assumption allows us to tackle
such problems and extract useful and reproducible patterns from big datasets.
The ideas described here represent the work of an entire community of
researchers in statistics and machine learning, and we thank everyone for
their continuing contributions to this exciting area. We particularly thank our
colleagues at Stanford, Berkeley and elsewhere; our collaborators, and our
past and current students working in this area. These include Alekh Agarwal,
Arash Amini, Francis Bach, Jacob Bien, Stephen Boyd, Andreas Buja, Emmanuel Candes, Alexandra Chouldechova, David Donoho, John Duchi, Brad
Efron, Will Fithian, Jerome Friedman, Max G’Sell, Iain Johnstone, Michael
Jordan, Ping Li, Po-Ling Loh, Michael Lim, Jason Lee, Richard Lockhart,
Rahul Mazumder, Balasubramanian Narashimhan, Sahand Negahban, Guillaume Obozinski, Mee-Young Park, Junyang Qian, Garvesh Raskutti, Pradeep
Ravikumar, Saharon Rosset, Prasad Santhanam, Noah Simon, Dennis Sun,
Yukai Sun, Jonathan Taylor, Ryan Tibshirani,1 Stefan Wager, Daniela Witten, Bin Yu, Yuchen Zhang, Ji Zhou, and Hui Zou. We also thank our editor
John Kimmel for his advice and support.
Stanford University
and
University of California, Berkeley
Trevor Hastie
Robert Tibshirani
Martin Wainwright
1 Some of the bibliographic references, for example in Chapters 4 and 6, are to
Tibshirani2 , R.J., rather than Tibshirani, R.; the former is Ryan Tibshirani, the latter
is Robert (son and father).
xv
© 2015 by Taylor & Francis Group, LLC
© 2015 by Taylor & Francis Group, LLC
Chapter 1
Introduction
“I never keep a scorecard or the batting averages. I hate statistics. What
I got to know, I keep in my head.”
This is a quote from baseball pitcher Dizzy Dean, who played in the major
leagues from 1930 to 1947.
How the world has changed in the 75 or so years since that time! Now large
quantities of data are collected and mined in nearly every area of science, entertainment, business, and industry. Medical scientists study the genomes of
patients to choose the best treatments, to learn the underlying causes of their
disease. Online movie and book stores study customer ratings to recommend
or sell them new movies or books. Social networks mine information about
members and their friends to try to enhance their online experience. And
yes, most major league baseball teams have statisticians who collect and analyze detailed information on batters and pitchers to help team managers and
players make better decisions.
Thus the world is awash with data. But as Rutherford D. Roger (and
others) has said:
“We are drowning in information and starving for knowledge.”
There is a crucial need to sort through this mass of information, and pare
it down to its bare essentials. For this process to be successful, we need to
hope that the world is not as complex as it might be. For example, we hope
that not all of the 30, 000 or so genes in the human body are directly involved
in the process that leads to the development of cancer. Or that the ratings
by a customer on perhaps 50 or 100 different movies are enough to give us a
good idea of their tastes. Or that the success of a left-handed pitcher against
left-handed batters will be fairly consistent for different batters.
This points to an underlying assumption of simplicity. One form of simplicity is sparsity, the central theme of this book. Loosely speaking, a sparse
statistical model is one in which only a relatively small number of parameters
(or predictors) play an important role. In this book we study methods that
exploit sparsity to help recover the underlying signal in a set of data.
The leading example is linear regression, in which we observe N observations of an outcome variable yi and p associated predictor variables (or
features) xi = (xi1 , . . . xip )T . The goal is to predict the outcome from the
1
© 2015 by Taylor & Francis Group, LLC
2
INTRODUCTION
predictors, both for actual prediction with future data and also to discover
which predictors play an important role. A linear regression model assumes
that
p
yi = β0 +
xij βj + ei ,
(1.1)
j=1
where β0 and β = (β1 , β2 , . . . βp ) are unknown parameters and ei is an error
term. The method of least squares provides estimates of the parameters by
minimization of the least-squares objective function
p
N
minimize
β0 ,β
i=1
(yi − β0 −
xij βij )2 .
(1.2)
j=1
Typically all of the least-squares estimates from (1.2) will be nonzero. This
will make interpretation of the final model challenging if p is large. In fact, if
p > N , the least-squares estimates are not unique. There is an infinite set of
solutions that make the objective function equal to zero, and these solutions
almost surely overfit the data as well.
Thus there is a need to constrain, or regularize the estimation process. In
the lasso or 1 -regularized regression, we estimate the parameters by solving
the problem
p
N
minimize
β0 ,β
i=1
(yi − β0 −
p
xij βij )2 subject to β
j=1
1
≤t
(1.3)
where β 1 = j=1 |βj | is the 1 norm of β, and t is a user-specified parameter.
We can think of t as a budget on the total 1 norm of the parameter vector,
and the lasso finds the best fit within this budget.
Why do we use the 1 norm? Why not use the 2 norm or any q norm? It
turns out that the 1 norm is special. If the budget t is small enough, the lasso
yields sparse solution vectors, having only some coordinates that are nonzero.
This does not occur for q norms with q > 1; for q < 1, the solutions are
sparse but the problem is not convex and this makes the minimization very
challenging computationally. The value q = 1 is the smallest value that yields
a convex problem. Convexity greatly simplifies the computation, as does the
sparsity assumption itself. They allow for scalable algorithms that can handle
problems with even millions of parameters.
Thus the advantages of sparsity are interpretation of the fitted model and
computational convenience. But a third advantage has emerged in the last
few years from some deep mathematical analyses of this area. This has been
termed the “bet on sparsity” principle:
Use a procedure that does well in sparse problems, since no procedure
does well in dense problems.
© 2015 by Taylor & Francis Group, LLC
STATISTICAL LEARNING WITH SPARSITY
3
h
tis
Te
s
ac
ft
So
m
St
o
te
Pr
os
ta
ea
s
y
cr
al
va
r
Pa
n
O
m
or
ng
ph
N
Ly
m
Lu
ve
r
Li
ey
on
dn
Ki
ol
S
C
st
N
C
Br
ea
Bl
a
dd
er
We can think of this in terms of the amount of information N/p per parameter. If p
N and the true model is not sparse, then the number of samples N
is too small to allow for accurate estimation of the parameters. But if the true
model is sparse, so that only k < N parameters are actually nonzero in the
true underlying model, then it turns out that we can estimate the parameters
effectively, using the lasso and related methods that we discuss in this book.
This may come as somewhat of a surprise, because we are able to do this even
though we are not told which k of the p parameters are actually nonzero. Of
course we cannot do as well as we could if we had that information, but it
turns out that we can still do reasonably well.
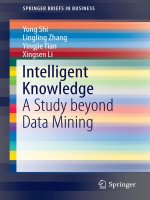
Figure 1.1 15-class gene expression cancer data: estimated nonzero feature weights
from a lasso-regularized multinomial classifier. Shown are the 254 genes (out of 4718)
with at least one nonzero weight among the 15 classes. The genes (unlabelled) run
from top to bottom. Line segments pointing to the right indicate positive weights,
and to the left, negative weights. We see that only a handful of genes are needed to
characterize each class.
For all of these reasons, the area of sparse statistical modelling is exciting—
for data analysts, computer scientists, and theorists—and practically useful.
Figure 1.1 shows an example. The data consists of quantitative gene expression
measurements of 4718 genes on samples from 349 cancer patients. The cancers
have been categorized into 15 different types such as “Bladder,” “Breast”,
© 2015 by Taylor & Francis Group, LLC
4
INTRODUCTION
“CNS,” etc. The goal is to build a classifier to predict cancer class based on
some or all of the 4718 features. We want the classifier to have a low error rate
on independent samples and would prefer that it depend only on a subset of
the genes, to aid in our understanding of the underlying biology.
For this purpose we applied a lasso-regularized multinomial classifier to
these data, as described in Chapter 3. This produces a set of 4718 weights or
coefficients for each of the 15 classes, for discriminating each class from the
rest. Because of the 1 penalty, only some of these weights may be nonzero
(depending on the choice of the regularization parameter). We used crossvalidation to estimate the optimal choice of regularization parameter, and
display the resulting weights in Figure 1.1. Only 254 genes have at least one
nonzero weight, and these are displayed in the figure. The cross-validated
error rate for this classifier is about 10%, so the procedure correctly predicts
the class of about 90% of the samples. By comparison, a standard support
vector classifier had a slightly higher error rate (13%) using all of the features.
Using sparsity, the lasso procedure has dramatically reduced the number of
features without sacrificing accuracy. Sparsity has also brought computational
efficiency: although there are potentially 4718 × 15 ≈ 70, 000 parameters to
estimate, the entire calculation for Figure 1.1 was done on a standard laptop
computer in less than a minute. For this computation we used the glmnet
procedure described in Chapters 3 and 5.
Figure 1.2 shows another example taken from an article by Cand`es and
Wakin (2008) in the field of compressed sensing. On the left is a megapixel
image. In order to reduce the amount of space needed to store the image,
we represent it in a wavelet basis, whose coefficients are shown in the middle
panel. The largest 25, 000 coefficients are then retained and the rest zeroed
out, yielding the excellent reconstruction in the right image. This all works
because of sparsity: although the image seems complex, in the wavelet basis it
is simple and hence only a relatively small number of coefficients are nonzero.
The original image can be perfectly recovered from just 96, 000 incoherent
measurements. Compressed sensing is a powerful tool for image analysis, and
is described in Chapter 10.
In this book we have tried to summarize the hot and rapidly evolving field
of sparse statistical modelling. In Chapter 2 we describe and illustrate the
lasso for linear regression, and a simple coordinate descent algorithm for its
computation. Chapter 3 covers the application of 1 penalties to generalized
linear models such as multinomial and survival models, as well as support
vector machines. Generalized penalties such as the elastic net and group lasso
are discussed in Chapter 4. Chapter 5 reviews numerical methods for optimization, with an emphasis on first-order methods that are useful for the
large-scale problems that are discussed in this book. In Chapter 6, we discuss methods for statistical inference for fitted (lasso) models, including the
bootstrap, Bayesian methods and some more recently developed approaches.
Sparse matrix decomposition is the topic of Chapter 7, and we apply these
methods in the context of sparse multivariate analysis in Chapter 8. Graph-
© 2015 by Taylor & Francis Group, LLC
√
μ( , ) = n · max | ϕk, ψ j |.
(3)
re x is the coefficient sequence of f , xi = f, ψ i . It will be
1≤k, j≤n
enient to express f as x (where
is the n × n matrix
ψ1 , . . . , ψn as columns). The implication of sparsity is
In plain English, the coherence measures the largest correlation
clear: when a signal has a sparse expansion, one can disbetween any two elements of and ; see also [5]. If and
the small coefficients without much perceptual loss.
contain correlated elements, the coherence is large. Otherwise,
mally, consider fS(t ) obtained by keeping only the terms
it is small. As for how large and how small, it follows from linear
√
esponding to the S largest values of (xi ) in the expansion
algebra that μ( , ) ∈ [1, n].
By definition, fS := xS , where here and below, xS is the
Compressive sampling is mainly concerned with low coherence pairs, and we now give examples of such pairs. In our first
or of coefficients (xi ) with all but the largest S set to zero.
example, is the canonical or spike basis ϕk(t ) = δ(t − k ) and
vector is sparse in a strict sense since all but a few of its
STATISTICAL
LEARNING
WITH SPARSITY
5
es are zero; we will call S-sparse
objects with at most S nonzero
ies. Since
is an orthonormal
Wavelet
s (or “orthobasis”), we have
× 104 Coefficients
2
fS 2 = x − xS 2 , and if x is
1.5
se or compressible in the sense
1
the sorted magnitudes of the (xi )
0.5
y quickly, then x is well approxi0
ed by xS and, therefore, the error
−0.5
fS 2 is small. In plain terms,
−1
0
2
4
6
8 10
can “throw away” a large fraction
× 105
he coefficients without much loss.
(a)
(b)
(c)
re 1(c) shows an example where
perceptual loss is hardly noticeable
a megapixel image to its approxi- [FIG1] (a) Original megapixel image with pixel values in the range [0,255] and (b) its
wavelet
coefficients
(arranged image
in random
enhanced
visibility).
Figure transform
1.2 (a) Original
megapixel
withorder
pixelforvalues
in the
range [0, 255]
ion obtained by throwing away Relatively few wavelet coefficients capture most of the signal energy; many such images
and (b) its wavelet transform coefficients (arranged in random order for enhanced
are highly compressible. (c) The reconstruction obtained by zeroing out all the coefficients
% of the coefficients.
visibility).
Relatively few wavelet coefficients capture most of the signal energy; many
the wavelet expansion but the 25,000 largest (pixel values are thresholded to the range
his principle is, of course, what in
such
images
are highlywith
compressible.
Theisreconstruction
obtained
by zeroing
[0,255]). The difference
the original (c)
picture
hardly noticeable.
As we describe
in out
erlies most modern lossy coders “Undersampling
all the coefficients
the wavelet
expansion
but
the 25,
largest (pixel
values
are
andin
Sparse
Signal Recovery,”
this
image
can000
be perfectly
recovered
from
96,000 incoherent
measurements.
h as JPEG-2000 [4] and many just
thresholded
to the range
[0, 255]). The differences from the original picture are hardly
noticeable.
IEEE SIGNAL PROCESSING MAGAZINE [23] MARCH 2008
ical models and their selection are discussed in Chapter 9 while compressed
sensing is the topic of Chapter 10. Finally, a survey of theoretical results for
the lasso is given in Chapter 11.
We note that both supervised and unsupervised learning problems are discussed in this book, the former in Chapters 2, 3, 4, and 10, and the latter in
Chapters 7 and 8.
Notation
We have adopted a notation to reduce mathematical clutter. Vectors are column vectors by default; hence β ∈ Rp is a column vector, and its transpose
β T is a row vector. All vectors are lower case and non-bold, except N -vectors
which are bold, where N is the sample size. For example xj might be the
N -vector of observed values for the j th variable, and y the response N -vector.
All matrices are bold; hence X might represent the N × p matrix of observed
predictors, and Θ a p × p precision matrix. This allows us to use xi ∈ Rp to
represent the vector of p features for observation i (i.e., xTi is the ith row of
X), while xk is the k th column of X, without ambiguity.
© 2015 by Taylor & Francis Group, LLC
© 2015 by Taylor & Francis Group, LLC
Chapter 2
The Lasso for Linear Models
In this chapter, we introduce the lasso estimator for linear regression. We
describe the basic lasso method, and outline a simple approach for its implementation. We relate the lasso to ridge regression, and also view it as a
Bayesian estimator.
2.1
Introduction
In the linear regression setting, we are given N samples {(xi , yi )}N
i=1 , where
each xi = (xi1 , . . . , xip ) is a p-dimensional vector of features or predictors, and
each yi ∈ R is the associated response variable. Our goal is to approximate
the response variable yi using a linear combination of the predictors
p
η(xi ) = β0 +
xij βj .
(2.1)
j=1
The model is parametrized by the vector of regression weights β =
(β1 , . . . , βp ) ∈ Rp and an intercept (or “bias”) term β0 ∈ R.
The usual “least-squares” estimator for the pair (β0 , β) is based on minimizing squared-error loss:
p
1 N
2
minimize
yi − β0 −
xij βj
.
(2.2)
2N
β0 ,β
i=1
j=1
There are two reasons why we might consider an alternative to the leastsquares estimate. The first reason is prediction accuracy: the least-squares
estimate often has low bias but large variance, and prediction accuracy can
sometimes be improved by shrinking the values of the regression coefficients,
or setting some coefficients to zero. By doing so, we introduce some bias but
reduce the variance of the predicted values, and hence may improve the overall
prediction accuracy (as measured in terms of the mean-squared error). The
second reason is for the purposes of interpretation. With a large number of
predictors, we often would like to identify a smaller subset of these predictors
that exhibit the strongest effects.
7
© 2015 by Taylor & Francis Group, LLC
8
THE LASSO FOR LINEAR MODELS
This chapter is devoted to discussion of the lasso, a method that combines
the least-squares loss (2.2) with an 1 -constraint, or bound on the sum of the
absolute values of the coefficients. Relative to the least-squares solution, this
constraint has the effect of shrinking the coefficients, and even setting some
to zero.1 In this way it provides an automatic way for doing model selection
in linear regression. Moreover, unlike some other criteria for model selection,
the resulting optimization problem is convex, and can be solved efficiently for
large problems.
2.2
The Lasso Estimator
Given a collection of N predictor-response pairs {(xi , yi )}N
i=1 , the lasso finds
the solution (β0 , β) to the optimization problem
p
1 N
(yi − β0 −
xij βj )2
minimize
2N
β0 ,β
i=1
j=1
(2.3)
p
subject to
j=1
|βj | ≤ t.
p
The constraint j=1 |βj | ≤ t can be written more compactly as the 1 -norm
constraint β 1 ≤ t. Furthermore, (2.3) is often represented using matrixvector notation. Let y = (y1 , . . . , yN ) denote the N -vector of responses, and
X be an N × p matrix with xi ∈ Rp in its ith row, then the optimization
problem (2.3) can be re-expressed as
minimize
β0 ,β
1
y − β0 1 − Xβ
2N
subject to β
1
2
2
(2.4)
≤ t,
where 1 is the vector of N ones, and · 2 denotes the usual Euclidean norm
on vectors. The bound t is a kind of “budget”: it limits the sum of the absolute values of the parameter estimates. Since a shrunken parameter estimate
corresponds to a more heavily-constrained model, this budget limits how well
we can fit the data. It must be specified by an external procedure such as
cross-validation, which we discuss later in the chapter.
Typically, we first standardize the predictors X so that each column is
N
N
centered ( N1 i=1 xij = 0) and has unit variance ( N1 i=1 x2ij = 1). Without
1A
lasso is a long rope with a noose at one end, used to catch horses and cattle. In
a figurative sense, the method “lassos” the coefficients of the model. In the original lasso
paper (Tibshirani 1996), the name “lasso” was also introduced as an acronym for “Least
Absolute Selection and Shrinkage Operator.”
Pronunciation: in the US “lasso” tends to be pronounced “lass-oh” (oh as in goat), while in
the UK “lass-oo.” In the OED (2nd edition, 1965): “lasso is pronounced l˘
asoo by those who
use it, and by most English people too.”
© 2015 by Taylor & Francis Group, LLC
THE LASSO ESTIMATOR
9
standardization, the lasso solutions would depend on the units (e.g., feet versus meters) used to measure the predictors. On the other hand, we typically
would not standardize if the features were measured in the same units. For
convenience, we also assume that the outcome values yi have been centered,
N
meaning that N1 i=1 yi = 0. These centering conditions are convenient, since
they mean that we can omit the intercept term β0 in the lasso optimization.
Given an optimal lasso solution β on the centered data, we can recover the
optimal solutions for the uncentered data: β is the same, and the intercept β0
is given by
p
β0 = y¯ −
x
¯j βj ,
j=1
where y¯ and {¯
xj }p1 are the original means.2 For this reason, we omit the
intercept β0 from the lasso for the remainder of this chapter.
It is often convenient to rewrite the lasso problem in the so-called Lagrangian form
minimize
p
β∈R
1
y − Xβ
2N
2
2
+λ β
1
,
(2.5)
for some λ ≥ 0. By Lagrangian duality, there is a one-to-one correspondence
between the constrained problem (2.3) and the Lagrangian form (2.5): for
each value of t in the range where the constraint β 1 ≤ t is active, there is
a corresponding value of λ that yields the same solution from the Lagrangian
form (2.5). Conversely, the solution βλ to problem (2.5) solves the bound
problem with t = βλ 1 .
We note that in many descriptions of the lasso, the factor 1/2N appearing
in (2.3) and (2.5) is replaced by 1/2 or simply 1. Although this makes no
difference in (2.3), and corresponds to a simple reparametrization of λ in
(2.5), this kind of standardization makes λ values comparable for different
sample sizes (useful for cross-validation).
The theory of convex analysis tells us that necessary and sufficient conditions for a solution to problem (2.5) take the form
−
1
xj , y − Xβ + λsj = 0, j = 1, . . . , p.
N
(2.6)
Here each sj is an unknown quantity equal to sign(βj ) if βj = 0 and some
value lying in [−1, 1] otherwise—that is, it is a subgradient for the absolute
value function (see Chapter 5 for details). In other words, the solutions βˆ
ˆ sˆ) to (2.6). This system is a
to problem (2.5) are the same as solutions (β,
form of the so-called Karush–Kuhn–Tucker (KKT) conditions for problem
(2.5). Expressing a problem in subgradient form can be useful for designing
2 This is typically only true for linear regression with squared-error loss; it’s not true, for
example, for lasso logistic regression.
© 2015 by Taylor & Francis Group, LLC