AHA statement triglycerides 2011 khotailieu y hoc
Bạn đang xem bản rút gọn của tài liệu. Xem và tải ngay bản đầy đủ của tài liệu tại đây (1.96 MB, 43 trang )
AHA Scientific Statement
Triglycerides and Cardiovascular Disease
A Scientific Statement From the American Heart Association
Michael Miller, MD, FAHA, Chair; Neil J. Stone, MD, FAHA, Vice Chair;
Christie Ballantyne, MD, FAHA; Vera Bittner, MD, FAHA; Michael H. Criqui, MD, MPH, FAHA;
Henry N. Ginsberg, MD, FAHA; Anne Carol Goldberg, MD, FAHA; William James Howard, MD;
Marc S. Jacobson, MD, FAHA; Penny M. Kris-Etherton, PhD, RD, FAHA;
Terry A. Lennie, PhD, RN, FAHA; Moshe Levi, MD, FAHA; Theodore Mazzone, MD, FAHA;
Subramanian Pennathur, MD, FAHA; on behalf of the American Heart Association Clinical Lipidology,
Thrombosis, and Prevention Committee of the Council on Nutrition, Physical Activity, and Metabolism,
Council on Arteriosclerosis, Thrombosis and Vascular Biology, Council on Cardiovascular Nursing,
and Council on the Kidney in Cardiovascular Disease
Table of Contents
1. Introduction . . . . . . . . . . . . . . . . . . . . .2293
2. Scope of the Problem: Prevalence of
Hypertriglyceridemia in the United States . . . . .2293
3. Epidemiology of Triglycerides in CVD Risk
Assessment . . . . . . . . . . . . . . . . . . . . . .2294
3.1. Methodological Considerations and Effect
Modification . . . . . . . . . . . . . . . . . .2295
3.2. Case-Control Studies, Including Angiographic
Studies. . . . . . . . . . . . . . . . . . . . . .2296
3.3. Prospective Population-Based Cohort Studies . . .2296
3.4. Insights From Clinical Trials . . . . . . . . . .2297
4. Pathophysiology of Hypertriglyceridemia. . . . . .2297
4.1. Normal Metabolism of TRLs. . . . . . . . . .2297
4.1.1. Lipoprotein Composition . . . . . . . .2297
4.2. Transport of Dietary Lipids on
Apo B48–Containing Lipoproteins . . . . . . .2298
4.3. Transport of Endogenous Lipids on
Apo B100–Containing Lipoproteins . . . . . .2298
4.3.1. Very Low-Density Lipoproteins . . . .2298
4.4. Metabolic Consequences of Hypertriglyceridemia . .2298
4.5. Atherogenicity of TRLs . . . . . . . . . . . .2298
4.5.1. Remnant Lipoprotein Particles . . . . .2299
4.5.2. Apo CIII . . . . . . . . . . . . . . . . . . .2299
4.5.3. Macrophage LPL . . . . . . . . . . . . . . .2300
5. Causes of Hypertriglyceridemia . . . . . . . . . . .2300
5.1. Familial Disorders With High Triglyceride Levels . .2300
5.2. Obesity and Sedentary Lifestyle . . . . . . . .2303
5.3. Lipodystrophic Disorders . . . . . . . . . . . .2303
5.3.1. Genetic Disorders . . . . . . . . . . . .2303
5.3.2. Acquired Disorders . . . . . . . . . . .2303
6. Diabetes Mellitus . . . . . . . . . . . . . . . . . .2304
6.1. Type 1 Diabetes Mellitus. . . . . . . . . . . .2304
6.1.1. Chylomicron Metabolism . . . . . . . .2304
6.1.2. VLDL Metabolism . . . . . . . . . . .2304
6.2. Type 2 Diabetes Mellitus. . . . . . . . . . . .2304
6.2.1. Chylomicron Metabolism . . . . . . . .2304
6.2.2. VLDL Metabolism . . . . . . . . . . .2304
6.2.3. Small LDL Particles. . . . . . . . . . .2304
6.2.4. Reduced HDL-C. . . . . . . . . . . . .2305
6.2.5. Summary. . . . . . . . . . . . . . . . .2305
7. Metabolic Syndrome . . . . . . . . . . . . . . . . .2305
7.1. Prevalence of Elevated Triglyceride
in MetS . . . . . . . . . . . . . . . . . . . . .2305
7.2. Prognostic Significance of Triglyceride
in MetS . . . . . . . . . . . . . . . . . . . . . . .2305
The American Heart Association makes every effort to avoid any actual or potential conflicts of interest that may arise as a result of an outside
relationship or a personal, professional, or business interest of a member of the writing panel. Specifically, all members of the writing group are required
to complete and submit a Disclosure Questionnaire showing all such relationships that might be perceived as real or potential conflicts of interest.
This statement was approved by the American Heart Association Science Advisory and Coordinating Committee on January 25, 2011. A copy of the
statement is available at by selecting either the “By Topic” link or the “By Publication Date” link. To purchase
additional reprints, call 843-216-2533 or e-mail
The American Heart Association requests that this document be cited as follows: Miller M, Stone NJ, Ballantyne C, Bittner V, Criqui MH, Ginsberg
HN, Goldberg AC, Howard WJ, Jacobson MS, Kris-Etherton PM, Lennie TA, Levi M, Mazzone T, Pennathur S; on behalf of the American Heart
Association Clinical Lipidology, Thrombosis, and Prevention Committee of the Council on Nutrition, Physical Activity and Metabolism, Council on
Arteriosclerosis, Thrombosis and Vascular Biology, Council on Cardiovascular Nursing, and Council on the Kidney in Cardiovascular Disease.
Triglycerides and cardiovascular disease: a scientific statement from the American Heart Association. Circulation. 2011;123:2292–2333.
Expert peer review of AHA Scientific Statements is conducted at the AHA National Center. For more on AHA statements and guidelines development,
visit and click on “Policies and Development.”
Permissions: Multiple copies, modification, alteration, enhancement, and/or distribution of this document are not permitted without the express
permission of the American Heart Association. Instructions for obtaining permission are located at />Copyright-Permission-Guidelines_UCM_300404_Article.jsp. A link to the “Permission Request Form” appears on the right side of the page.
(Circulation. 2011;123:2292-2333.)
© 2011 American Heart Association, Inc.
Circulation is available at
DOI: 10.1161/CIR.0b013e3182160726
Downloaded from />by guest on May 13, 2015
2292
Miller et al
8. Chronic Kidney Disease . . . . . . . . . . . . . . .2305
9. Interrelated Measurements and Factors That
Affect Triglycerides . . . . . . . . . . . . . . . . .2306
9.1. Non–HDL-C, Apo B, and Ratio of
Triglycerides to HDL-C . . . . . . . . . . . .2306
9.1.1. Non–HDL-C . . . . . . . . . . . . .2306
9.1.2. Apo B . . . . . . . . . . . . . . . . .2306
9.1.3. Ratio of Triglycerides to HDL-C . .2307
10. Factors That Influence Triglyceride Measurements . .2307
10.1. Postural Effects . . . . . . . . . . . . . . . .2307
10.2. Phlebotomy-Related Issues . . . . . . . . . .2307
10.3. Fasting Versus Nonfasting Levels . . . . . .2307
11. Special Populations . . . . . . . . . . . . . . . . .2308
11.1. Children and Adolescent Obesity . . . . . . .2308
11.1.1. Risk Factors for Hypertriglyceridemia
in Childhood . . . . . . . . . . . . .2309
11.1.2. Obesity and High Triglyceride
Levels in Childhood . . . . . . . . .2309
11.1.3. IR and T2DM in Childhood . . . . .2309
11.2. Triglycerides as a Cardiovascular Risk
Factor in Women . . . . . . . . . . . . . . .2309
11.2.1. Triglyceride Levels During the
Lifespan in Women. . . . . . . . . .2309
11.2.2. Prevalence of Hypertriglyceridemia
in Women . . . . . . . . . . . . . . .2309
11.2.3. Hormonal Influences . . . . . . . . .2309
11.3. Triglycerides in Ethnic Minorities . . . . . .2310
12. Classification of Hypertriglyceridemia . . . . . . .2311
12.1. Defining Levels of Risk per the National
Cholesterol Education Program ATP
Guidelines . . . . . . . . . . . . . . . . . . .2311
13. Dietary Management of Hypertriglyceridemia . . .2311
13.1. Dietary and Weight-Losing Strategies . . . .2311
13.1.1. Weight Status, Body Fat Distribution,
and Weight Loss . . . . . . . . . . .2311
13.2. Macronutrients. . . . . . . . . . . . . . . . .2311
13.2.1. Total Fat, CHO, and Protein . . . . .2311
13.2.2. Mediterranean-Style Dietary Pattern . . .2312
13.3. Type of Dietary CHO . . . . . . . . . . . . .2313
13.3.1. Dietary Fiber . . . . . . . . . . . . .2313
13.3.2. Added Sugars . . . . . . . . . . . . .2313
13.3.3. Glycemic Index/Load. . . . . . . . .2313
13.3.4. Fructose . . . . . . . . . . . . . . . .2313
13.4. Weight Loss and Macronutrient Profile
of the Diet . . . . . . . . . . . . . . . . . . .2314
13.5. Alcohol . . . . . . . . . . . . . . . . . . . .2314
13.6. Marine-Derived Omega-3 PUFA . . . . . . .2315
13.7. Nonmarine Omega-3 PUFA. . . . . . . . . .2315
13.8. Dietary Summary . . . . . . . . . . . . . . .2315
14. Physical Activity and Hypertriglyceridemia . . . .2315
15. Pharmacological Therapy in Patients With Elevated
Triglyceride Levels . . . . . . . . . . . . . . . . .2316
16. Preventive Strategies Aimed at Reducing High
Triglyceride Levels . . . . . . . . . . . . . . . . .2317
17. Statement Summary and Recommendations . . . .2318
Acknowledgments . . . . . . . . . . . . . . . . . . . .2318
References . . . . . . . . . . . . . . . . . . . . . . . .2320
Triglycerides and Cardiovascular Disease
2293
1. Introduction
A long-standing association exists between elevated triglyceride levels and cardiovascular disease* (CVD).1,2 However,
the extent to which triglycerides directly promote CVD or
represent a biomarker of risk has been debated for 3 decades.3
To this end, 2 National Institutes of Health consensus
conferences evaluated the evidentiary role of triglycerides in
cardiovascular risk assessment and provided therapeutic recommendations for hypertriglyceridemic states.4,5 Since 1993,
additional insights have been made vis-a`-vis the atherogenicity of triglyceride-rich lipoproteins (TRLs; ie, chylomicrons
and very low-density lipoproteins), genetic and metabolic
regulators of triglyceride metabolism, and classification and
treatment of hypertriglyceridemia. It is especially disconcerting that in the United States, mean triglyceride levels have
risen since 1976, in concert with the growing epidemic of
obesity, insulin resistance (IR), and type 2 diabetes mellitus
(T2DM).6,7 In contrast, mean low-density lipoprotein cholesterol (LDL-C) levels have receded.7 Therefore, the purpose of
this scientific statement is to update clinicians on the increasingly crucial role of triglycerides in the evaluation and
management of CVD risk and highlight approaches aimed at
minimizing the adverse public health–related consequences
associated with hypertriglyceridemic states. This statement
will complement recent American Heart Association scientific statements on childhood and adolescent obesity8 and
dietary sugar intake9 by emphasizing effective lifestyle strategies designed to lower triglyceride levels and improve
overall cardiometabolic health. It is not intended to serve as a
specific guideline but will be of value to the Adult Treatment
Panel IV (ATP IV) of the National Cholesterol Education
Program, from which evidence-based guidelines will ensue.
Topics to be addressed include epidemiology and CVD risk,
ethnic and racial differences, metabolic determinants, genetic
and family determinants, risk factor correlates, and effects
related to nutrition, physical activity, and lipid medications.
2. Scope of the Problem: Prevalence of
Hypertriglyceridemia in the United States
In the United States, the National Health and Nutrition
Examination Survey (NHANES) has monitored biomarkers
of CVD risk for Ͼ3 decades. Accordingly, increases in
fasting serum triglyceride levels observed between surveys
conducted in 1976 –1980 and 1999 –20026 coincided with
adjustments in the classification of hypertriglyceridemia4,10
(Table 1). Current designations are as follows: 150 to 199
mg/dL, borderline high; 200 to 499 mg/dL, high; and Ն500
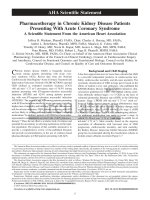
mg/dL, very high. The prevalence of hypertriglyceridemia by
ethnicity in NHANES 1988 –1994 and 1999 –2008 according
to these cut points is shown in Figure 1. Overall, 31% of the
adult US population has a triglyceride level Ն150 mg/dL,
with no appreciable change between NHANES 1988 –1994
and 1999 –2008. Among ethnicities, Mexican Americans
have the highest rates (34.9%), followed by non-Hispanic
whites (33%) and blacks (15.6%) in NHANES 1999 –2008
(Table 2). High (Ն200 mg/dL) and very high (Ն500 mg/dL)
*For the purpose of this statement, CVD is inclusive of coronary heart disease and
coronary artery disease.
Downloaded from by guest on May 13, 2015
2294
Circulation
May 24, 2011
Table 1. Triglyceride Classification Revisions Between 1984
and 2001
TG Designate
1984 NIH
Consensus Panel
1993 NCEP
Guidelines
2001 NCEP
Guidelines
Ͻ250
Ͻ200
Ͻ150
Desirable
Borderline-high
250–499
200–399
150–199
High
500–999
400–999
200–499
Ͼ1000
Ͼ1000
Ն500
Very high
TG indicates triglyceride; NIH, National Institutes of Health; and NCEP,
National Cholesterol Education Program.
Values are milligrams per deciliter.
fasting triglyceride levels were observed in 16.2% and
1.1% of adults, respectively, with Mexican Americans
being overrepresented at both cut points (19.5% and 1.4%,
respectively). Figure 2 illustrates the sex- and age-related
prevalence of triglyceride levels Ն150 mg/dL in NHANES
1999 –2008. Within each group, the highest prevalence
rates were observed in Mexican American men (50 to 59
years old, 58.8%) and Mexican American women (Ն70
years old, 50.5%), followed by non-Hispanic white men
and women (60 to 69 years old, 43.6% and 42.2%,
respectively) and non-Hispanic black men (40 to 49 years
old, 30.4%) and women (60 to 69 years old, 25.3%). The
prevalence of triglyceride levels Ն200 mg/dL was also
highest in Mexican American men (Ն30 years old) and
women (Ն40 years old; 21% to 36%), followed by
non-Hispanic white men (30 to 69 years old, 20% to 25%).
Although the prevalence of triglyceride levels Ն500
mg/dL was relatively low (1% to 2%), Mexican American
men 50 to 59 years of age exhibited the highest rate (9%)
in NHANES 1999 –2008.
Serum triglyceride levels by selected percentiles and geometric means are shown in Table 3. Because triglyceride
levels are not normally distributed in the population (Section
3.1), the geometric mean, as derived by log transformation, is
favored over the arithmetic mean to reduce the potential
impact of outliers that might otherwise overestimate triglyceride levels.11 Over the past 20 years, there were small
increases in median triglyceride levels in both men (122
versus 119 mg/dL) and women (106 versus 101 mg/dL).
However, the increases in triglycerides primarily were observed in younger age groups (20 to 49 years old), and
overall, triglyceride levels continue to be higher than in less
industrialized societies (Section 12.1). We now address the
epidemiological and putative pathophysiological consequences of high triglyceride levels.
3. Epidemiology of Triglycerides in CVD
Risk Assessment
The independent relationship of triglycerides to the risk of future
CVD events has long been controversial. An article published in
The New England Journal of Medicine in 1980 concluded that
the evidence for an independent effect of triglycerides was
“meager,”3 yet despite several decades of additional research,
the controversy persists. This may in part reflect conflicting
results in the quality of studies performed in the general
population and in clinical samples. Second, in studies demon-
40
% At or exceeding pre-specified TG cut-off
(150, 200, 500 mg/dL) as a funcƟon of ethnic
group over several decades
35
30
25
20
15
% 1988-1994
% 1999-2008
10
5
To
No
ta
nl
H
W
No hite
M
s
nex
ica H B
l
a
n
Am ck
er
ica
ns
To
No
ta
nl
H
W
h
i
No
te
M
s
nex
ica H B
l
a
n
Am ck
er
ica
ns
50
0+
To
No
ta
nl
H
W
h
i
No
te
M
s
nex
ica H B
la
n
Am ck
er
ica
ns
20
0+
15
0+
0
Figure 1. Prevalence of fasting triglyceride levels (Ն150, 200, and 500 mg/dL) in males and (non-pregnant) females Ն18 years of age
by ethnicity in the National Health and Nutrition Examination Survey (1988 –1994 and 1999 –2008). TG indicates triglycerides; Non-H,
non-Hispanic.
Downloaded from by guest on May 13, 2015
Miller et al
Triglycerides and Cardiovascular Disease
2295
Table 2. Overall Prevalence (%) of Hypertriglyceridemia Based
on 150, 200, and 500 mg/dL Cut Points by Age, Sex, and
Ethnicity in US Adults, NHANES 1999 –2008
Triglyceride Cut Points, mg/dL
Demographic
Ն150
Ն200
Ն500
Overall (age Ն20 y)
31.0
16.2
1.1
20.7
9.5
0.8
Age, y
20–29
30–39
25.8
14.1
0.7
40–49
32.8
16.7
1.6
50–59
36.7
20.1
1.8
60–69
41.6
22.6
1.0
Ն70
34.5
17.2
0.5
Men
35.4
19.8
1.8
Women*
26.8
12.7
0.5
Sex
Ethnicity
Mexican American
34.9
19.5
1.4
Non-Hispanic, black
15.6
7.6
0.4
Non-Hispanic, white
33.0
17.6
1.1
NHANES indicates National Health and Nutrition Examination Survey.
Data provided by the Epidemiology Branch, National Heart, Lung, and Blood
Institute.
*Excludes pregnant women.
Source: NHANES 1999 –2008.
strating a significant independent relationship of triglycerides to
CVD events, the effect size has typically been modest compared
with standard CVD risk factors, including other lipid and
lipoprotein parameters. Summarized below are methodological
considerations and results from representative studies that evaluated triglycerides in CVD risk assessment.
3.1. Methodological Considerations and
Effect Modification
Triglyceride has long been the most problematic lipid measure in
the evaluation of cardiovascular risk. First, the distribution is
markedly skewed, which necessitates categorical definitions or
log transformations. Second, variability is high (Section 10) and
increases with the level of triglyceride.12 Third, the strong
inverse association with high-density lipoprotein cholesterol
(HDL-C) and apolipoprotein (apo) AI, suggests an intricate
biological relationship that may not be most suitably represented
by the results of multivariate analysis. Finally, evidence from
prospective studies of the triglyceride association supports a
stronger link with CVD risk in people with lower levels of
HDL-C13,14 and LDL-C13,14 and with T2DM.15,16 Such an effect
modification could obscure a modest but significant effect, as
demonstrated recently.17
In addition to the inverse association with HDL-C, triglyceride levels are closely aligned with T2DM, even though
T2DM is not always examined as a confounding factor, and
when it is, the diagnosis is commonly based on history. Yet
at least 25% of subjects with T2DM are undiagnosed,18 and
they are often concentrated within a hypertriglyceridemic
population. Similarly, many subjects with high triglyceride
Figure 2. Prevalence of hypertriglyceridemia in males and nonpregnant females Ն18 years of age in NHANES 1999 –2008.
NHANES indicates National Health and Nutrition Examination Survey; TG, triglycerides; Non H, non-Hispanic; Mexican-Am,
Mexican-American.
levels and impaired fasting glucose who subsequently develop T2DM are not adjusted for in multivariate analysis.
Hence, these limitations restrict conclusions that support
triglyceride level as an independent CVD risk factor. Compounding the aforementioned problem is the argument that an
elevated triglyceride level is simply an epiphenomenon (ie, a
by-product) of IR or the metabolic syndrome (MetS). However, analysis of NHANES data evaluating the association of
all 5 MetS components with cardiovascular risk found the
strongest association with triglycerides.19
A pivotal consideration is how triglycerides may directly
impact the atherosclerotic process in view of epidemiological
studies that have failed to demonstrate a strong relationship
between very high triglyceride levels and increased CVD
death.13,20 As will be described in Section 4, hydrolysis of TRLs
(eg, chylomicrons, very low-density lipoproteins [VLDL]) re-
Downloaded from by guest on May 13, 2015
2296
Circulation
May 24, 2011
Table 3.
Serum Triglyceride Levels of US Adults >20 Years of Age, 1988 –1994 and 1999 –2008
1988 –1994
Geometric Mean
Age-Specific
1999 –2008
Selected Percentile
Geometric Mean
Age-Adjusted
5th
25th
50th
75th
95th
127.9
53
83
119
176
321
Age-Specific
Selected Percentile
Age-Adjusted
5th
25th
50th
75th
95th
128.3
52
85
122
182
361
Men
Ն20 y
20–29
95.1
45
65
88
126
237
106.2
45
70
100
150
305
30–39
118.8
52
79
113
169
298
122.1
50
80
119
175
324
40–49
138.4
58
91
133
190
349
143.8
57
94
134
201
473
50–59
146.6
61
95
137
223
394
140.6
61
93
133
197
388
60–69
146.7
64
101
140
200
378
138.2
59
96
133
196
372
Ն70
134.3
64
95
131
179
306
121.5
54
87
120
168
266
47
72
101
150
274
48
74
106
155
270
Women*
Ն20 y
109.7
110.0
20–29
83.8
42
60
84
111
182
88.7
39
63
83
123
205
30–39
91.3
43
62
83
121
267
95.8
42
64
91
138
243
40–49
103.0
48
70
102
139
251
105.5
49
73
102
146
249
50–59
129.2
55
84
126
186
325
124.7
55
84
120
176
305
60–69
143.9
61
97
137
203
380
135.9
63
96
137
192
299
Ն70
137.2
70
97
134
182
284
133.0
63
95
129
180
293
Race/ethnicity
Mexican-American
Men
138.6
53
83
120
185
387
140.8
53
89
126
196
392
Women
131.8
55
85
118
167
291
126.6
48
81
113
164
277
102.5
44
65
92
140
259
99.7
44
67
94
129
248
88.8
40
58
79
115
208
88.1
38
62
83
116
209
Non-Hispanic black
Men
Women
Non-Hispanic white
Men
131.3
55
85
123
182
323
130.3
53
87
126
188
368
Women
110.9
48
74
102
154
276
112.1
50
77
109
161
275
Percentile and geometric mean distribution of serum triglyceride (mg/dL).
*Excludes pregnant women.
Data provided by the Epidemiology Branch, National Heart, Lung, and Blood Institute.
Source: National Health and Nutrition Examination Survey III (1988 –1994) and Concurrent National Health and Nutrition Examination Survey (1999 –2008).
sults in atherogenic cholesterol-enriched remnant lipoprotein
particles (RLPs). Accordingly, recent evidence suggests that
nonfasting triglyceride is strongly correlated with RLPs,21 and in
2 recent studies, nonfasting triglyceride was a superior predictor
of incident CVD compared with fasting levels.21,22
3.2. Case-Control Studies, Including
Angiographic Studies
Triglyceride has routinely been identified as a “risk factor” in
case-control and angiographic studies, even after adjustment for
total cholesterol (TC) or LDL-C23–34 and HDL-C.24,27–29,33,34 In
another case-control study, case subjects were 3-fold more
likely to exhibit small, dense low-density lipoprotein (LDL)
particles, referred to as the “pattern B” phenotype.35 However, the triglyceride level explained most of the risk of the
pattern B phenotype and was a stronger covariate than
LDL-C, intermediate-density lipoprotein (IDL) cholesterol,
or HDL-C. Overall, data from case-control studies have
supported triglyceride level as an independent CVD risk
factor.
3.3. Prospective Population-Based Cohort Studies
Although many early cohort studies found a univariate
association of triglycerides with CVD, this association often
became nonsignificant after adjustment for either TC or
LDL-C. Most of these earlier studies did not measure
HDL-C. Two meta-analyses of the triglycerides-CVD question drew similar conclusions. The first, published in 1996,
considered 16 studies in men, 6 from the United States, 6
from Scandinavia, and 4 from elsewhere in Europe.36 In
univariate analysis, the relative risk per 1 mmol/L (88.5
mg/dL) of triglyceride for CVD in men was 1.32 (95%
confidence interval 1.26 to 1.39) and 1.14 (95% confidence
interval 1.05 to 1.28) after adjustment for HDL-C. In women,
the association was more robust in both univariate analysis
(relative risk 1.76 per mmol/L) and after adjustment for
HDL-C (relative risk 1.37, 95% confidence interval 1.13 to
1.66). The second meta-analysis evaluated 262 000 subjects
and found a higher relative risk (1.4) at the upper compared
with the lower triglyceride tertile; this estimate improved to
Downloaded from by guest on May 13, 2015
Miller et al
Triglycerides and Cardiovascular Disease
2297
Figure 3. Overview of triglyceride metabolism. Apo A-V indicates apolipoprotein
A-V; CMR, chylomicron remnant; FFAs,
free fatty acids; HTGL, hepatic triglyceride
lipase; IDL, intermediate-density lipoprotein; LDL, low-density lipoprotein; LDL-R,
low-density lipoprotein receptor; LPL,
lipoprotein lipase; LRP, LDL receptor–
related protein; VLDL, very low-density
lipoprotein; and VLDL-R, very low-density
lipoprotein receptor.
1.72 with correction for “regression dilution bias” (intraindividual triglyceride variation).2
A recent meta-analysis from the Emerging Risk Factors
Collaboration evaluated 302 430 people free of known vascular disease at baseline in 68 prospective studies.17 With
adjustment for age and sex, triglycerides showed a strong,
stepwise association with both CVD and ischemic stroke;
however, after adjustment for standard risk factors and for
HDL-C and non–HDL-C, the associations for both CVD and
stroke were no longer significant. The attenuation was primarily from the adjustment for HDL-C and non–HDL-C,
which led to the conclusion that “…for population-wide
assessment of vascular risk, triglyceride measurement provides no additional information about vascular risk given
knowledge of HDL-C and total cholesterol levels, although
there may be separate reasons to measure triglyceride concentration (eg, prevention of pancreatitis).”17
Additional data from studies involving young men have
provided new insight into the triglyceride risk status question.37
In 13 953 men 26 to 45 years old who were followed up for 10.5
years, there were significant correlations between adoption of a
favorable lifestyle (eg, weight loss, physical activity) and a
decrease in triglyceride levels. At baseline, triglyceride levels in
the top quintile were associated with a 4-fold increased risk of
CVD compared with the lowest triglyceride quintile, even after
adjustment for other risk factors, including HDL-C. Evaluation
of the change in triglyceride levels over the first 5 years and
incident CVD in the next 5 years found a direct correlation
between increases in triglyceride levels and CVD risk. These
observations add a dynamic element of triglyceride to CVD risk
assessment based on lifestyle intervention that will be elaborated
on later in this statement.
3.4. Insights From Clinical Trials
A related question is the ability of triglyceride levels to
predict clinical benefit from lipid therapy in outcome trials. In
many of these studies, subjects with elevated triglyceride
levels exhibited improvement in CVD risk, irrespective of
drug class or targeted lipid fraction,38 – 40 primarily because
elevated triglyceride level at baseline was commonly accompanied by high LDL-C and low HDL-C, and this combination
(ie, the atherogenic dyslipidemic triad) was associated with
the highest CVD risk. Taken together, the independence of
triglyceride level as a causal factor in promoting CVD
remains debatable. Rather, triglyceride levels appear to provide unique information as a biomarker of risk, especially
when combined with low HDL-C and elevated LDL-C.
4. Pathophysiology of Hypertriglyceridemia
4.1. Normal Metabolism of TRLs
4.1.1. Lipoprotein Composition
Lipoproteins are macromolecular complexes that carry various
lipids and proteins in plasma.41 Several major classes of lipoproteins have been defined by their physical and chemical
characteristics, particularly by their flotation characteristics during ultracentrifugation. However, lipoprotein particles form a
continuum, varying in composition, size, density, and function.
The lipids are mainly free and esterified cholesterol, triglycerides, and phospholipids. The hydrophobic triglyceride and cholesteryl esters (CEs) compose the core of the lipoproteins, which
is covered by a unilamellar surface that contains mainly the
amphipathic (both hydrophobic and hydrophilic) phospholipids
and smaller amounts of free cholesterol and proteins. Hundreds
to thousands of triglyceride and CE molecules are carried in the
core of different lipoproteins.
Apolipoproteins are the proteins on the surface of the lipoproteins. They not only participate in solubilizing core lipids but
also play critical roles in the regulation of plasma lipid and
lipoprotein transport. Apo B100 is required for the secretion of
hepatic-derived VLDL, IDL, and LDL. Apo B48 is a truncated
form of apo B100 that is required for secretion of chylomicrons
from the small intestine.
Downloaded from by guest on May 13, 2015
2298
Circulation
May 24, 2011
4.2. Transport of Dietary Lipids on
Apo B48–Containing Lipoproteins
Figure 3 provides an overview of triglyceride metabolism.
After ingestion of a meal, dietary fat and cholesterol are
absorbed into the cells of the small intestine and are incorporated into the core of nascent chylomicrons. Newly formed
chylomicrons, representing 80% to 95% triglyceride as a percentage of composition of lipids,41 are secreted into the lymphatic system and then enter the circulation at the junction of the
internal jugular and subclavian veins. In the lymph and blood,
chylomicrons acquire apo CII, apo CIII, and apo E. In the
capillary beds of adipose tissue and muscle, they bind to
glycosylphosphatidylinositol-anchored HDL-binding protein
1 (GPIHBP1),42 and core triglyceride is hydrolyzed by the
enzyme lipoprotein lipase (LPL) after activation by apo CII.43
The lipolytic products, free fatty acids (FFAs), can be taken
up by fat cells and reincorporated into triglyceride or into
muscle cells, where they can be used for energy. In addition
to apo CII, other activators of LPL include apo AIV,44 apo
AV,45 and lipase maturation factor 1 (LMF1),46 whereas apo
CIII47 and angiopoietin-like (ANGPTL) proteins 3 and 448
inhibit LPL. Human mutations in LPL, APOC2, GPIHBP1,
ANGPTL3, ANGPTL4, and APOA5 have all been implicated
in chylomicronemia (Section 5).
The consequence of triglyceride hydrolysis in chylomicrons is a relatively CE- and apo E– enriched chylomicron
remnant (CMR). Under physiological conditions, essentially
all CMRs are removed by the liver by binding to the LDL
receptor, the LDL receptor–related protein, hepatic triglyceride lipase (HTGL), and cell-surface proteoglycans.49 –51 Apo
AV facilitates hepatic clearance of CMRs through direct
interaction with SorLA.52 HTGL also plays a role in remnant
removal,49 and HTGL deficiency is associated with reduced
RLP clearance. However, studies53 have indicated that HTGL
is elevated in T2DM (Section 6) and may be an important
contributor to low HDL-C levels in this disease.
4.3. Transport of Endogenous Lipids on
Apo B100–Containing Lipoproteins
4.3.1. Very Low-Density Lipoproteins
VLDL is assembled in the endoplasmic reticulum of hepatocytes. VLDL triglyceride derives from the combination of
glycerol with fatty acids that have been taken up from plasma
(either as albumin-bound fatty acids or as triglyceride–fatty
acids in RLPs as they return to the liver) or newly synthesized
in the liver. VLDL cholesterol is either synthesized in the
liver from acetate or delivered to the liver by lipoproteins,
mainly CMRs. Apo B100 and phospholipids form the surface
of VLDL. Although apos CI, CII, CIII, and E are present on
nascent VLDL particles as they are secreted from the hepatocyte, the majority of these molecules are probably added to
VLDL after their entry into plasma. Regulation of the
assembly and secretion of VLDL by the liver is complex;
substrates, hormones, and neural signals all play a role.
Studies in cultured liver cells51,54 indicate that a significant
proportion of newly synthesized apo B100 may be degraded
before secretion and that this degradation is inhibited when
hepatic lipids are abundant.54
Once in the plasma, VLDL triglyceride is hydrolyzed by LPL,
generating smaller and denser VLDL and subsequently IDL.
IDL particles are physiologically similar to CMRs, but unlike
CMRs, not all are removed by the liver. IDL particles can also
undergo further catabolism to become LDL. Some LPL activity
appears necessary for normal functioning of the metabolic
cascade from VLDL to IDL to LDL. It also appears that apo E,
HTGL, and LDL receptors play important roles in this process.
Apo B100 is essentially the sole protein on the surface of LDL,
and the lifetime of LDL in plasma appears to be determined
mainly by the availability of LDL receptors. Overall, Ϸ70% to
80% of LDL catabolism from plasma occurs via the LDL
receptor pathway, whereas the remaining tissue uptake occurs by
nonreceptor or alternative-receptor pathways.41,53
4.4. Metabolic Consequences
of Hypertriglyceridemia
Hypertriglyceridemia that results from either increased production or decreased catabolism of TRL directly influences
LDL and HDL composition and metabolism. For example,
the hypertriglyceridemia of IR is a consequence of adipocyte
lipolysis that results in FFA flux to the liver and increased
VLDL secretion. Higher VLDL triglyceride output activates
cholesteryl ester transfer protein, which results in triglyceride
enrichment of LDL and HDL (Figure 4). The triglyceride
content within these particles is hydrolyzed by HTGL, which
results in small, dense LDL and HDL particles. Experimental
studies suggest that hypertriglyceridemic HDL may be dysfunctional,55,56 that small, dense LDL particles may be more
susceptible to oxidative modification,57,58 and that an increased number of atherogenic particles may adversely influence CVD risk59; however, no clinical outcome trials to date
have determined whether normalization of particle composition or reduction of particle number optimizes CVD risk
reduction beyond that achieved through LDL-C lowering.
An additional complication in hypertriglyceridemic states
is accurate quantification of atherogenic particles in the
circulation. That is, a high concentration of circulating
atherogenic particles is not reliably assessed simply by
measurement of TC and/or LDL-C. Moreover, as triglyceride
levels increase, the proportion of triglyceride/CE in VLDL
increases (ie, Ͼ5:1), which results in an underestimation of
LDL-C based on the Friedewald formula.60 Although this
scientific statement will address other variables to consider in
the hypertriglyceridemic patient (eg, apo B levels), it supports
the quantification of non–HDL-C.60,61
4.5. Atherogenicity of TRLs
In human observational studies, TRLs have been associated
with measures of coronary atherosclerosis.62 To provide a
pathophysiological underpinning for observations that relate
specific lipoprotein particles to human atherosclerosis or
CVD, experimental models have been developed to investigate the impact of specific lipoprotein fractions on isolated
vessel wall cells. For example, in macrophage-based studies,
lipoprotein particles that increase sterol delivery or reduce
sterol efflux or that promote an inflammatory response are
considered atherogenic. In endothelial cell models, lipopro-
Downloaded from by guest on May 13, 2015
Miller et al
Triglycerides and Cardiovascular Disease
2299
Figure 4. Metabolic consequences of hypertriglyceridemia. Apo A-I indicates apolipoprotein A-I; Apo B-100, apolipoprotein
B-100; CE, cholesteryl ester; CETP, cholesteryl ester transfer protein; DGAT, diacylglycerol acyltransferase; FFA, free fatty
acid; HDL, high-density lipoprotein; HTGL,
hepatic triglyceride lipase; LDL, low-density
lipoprotein; TG, triglyceride; and VLDL, very
low-density lipoprotein.
tein particles that promote inflammation, increase the expression of coagulation factors or leukocyte adhesion molecules,
or impair responses that produce vasodilation are also considered atherogenic. These experimental systems have been
used to understand the mechanisms by which modified LDL
particles are associated with atherosclerosis in humans and in
animals.
When one evaluates the usefulness of these systems, it is
important to recognize that triglyceride overload is not a
classic pathological feature of human atherosclerotic lesions,
because the end product, FFA, serves as an active energy
source for myocytes or as an inactive fuel reserve in adipocytes. However, the by-product of TRLs (ie, RLPs) may
lead to foam cell formation63 in a manner analogous to
modified LDL. In addition, TRLs share a number of constituents with classic atherogenic LDL particles. They include
the presence of apo B and CE. Although TRLs contain much
less CE than LDL particles on a per particle basis, there are
pathophysiological states (eg, poorly controlled diabetes mellitus [DM]) in which CEs can become enriched in this
fraction. TRLs also possess unique constituents that may
contribute to atherogenicity. For example, the action of LPL
on the triglycerides contained in these particles releases fatty
acid, which in microcapillary beds could be associated with
pathophysiological responses in macrophages and endothelial
cells. Apo CIII contained in TRLs has also been shown to
promote proatherogenic responses in macrophages and endothelial cells. In the following paragraphs, we will consider
selected aspects of the atherogenicity of TRL using in vitro
macrophage and endothelial cell models and associated in
vivo correlates.
4.5.1. Remnant Lipoprotein Particles
A number of experimental systems have demonstrated that
TRLs can produce proatherogenic responses in isolated endothelial cells. RLPs are a by-product of TRL that can be
isolated from the postprandial plasma of hypertriglyceridemic
subjects; they are intestinal (ie, CMRs) or liver-derived (eg,
VLDL remnants) TRLs that have undergone partial hydrolysis
by LPL. Liu et al64 have shown that these particles can accelerate
senescence and interfere with the function of endothelial progenitor cells; these cells play an important role in the organismal
reparative response to in vivo vessel wall injury. Postprandial
TRL (ppTG) has also been shown to increase the expression
of proinflammatory genes (eg, interleukin-6, intercellular
adhesion molecule-1, vascular cell adhesion molecule-1, and
monocyte chemotactic protein-1),65 induce apoptosis,66 and
accentuate the inflammatory response of cultured endothelial
cells to tumor necrosis factor-␣.67 After a high-fat meal,
ppTG may increase the level of circulating endothelial cell
microparticles, a measure of endothelial cell dysfunction in
vivo.68 That is, a high-fat diet increases the level of these
particles more effectively than a low-fat diet and is correlated
with ppTG levels. Moreover, Rutledge and colleagues have
shown that fatty acids released by lipolysis of TRL elicit
proinflammatory responses in endothelial cells.69 TRL may also
act to suppress the atheroprotective and antiinflammatory effects
of HDL.70 –72 Finally, fatty acid– binding proteins play a role in
the intracellular transport of long-chain fatty acids. Recent data
support a role for adipocyte- and macrophage-derived fatty
acid– binding proteins in systemic inflammatory responses73 that
are likely amplified by high triglyceride loads provided by RLPs
to the arterial macrophages.
4.5.2. Apo CIII
Apo CIII is a 79-amino acid glycoprotein that is a major
component of circulating TRL and is correlated with triglyceride levels.74 Recently, a mutation in APOC3 was identified
in association with low triglyceride levels, reduced coronary
artery calcification, and suggestion of familial longevity.75
Emerging evidence from a number of in vitro studies has
shown that apo CIII, alone or as an integral component of
Downloaded from by guest on May 13, 2015
2300
Circulation
May 24, 2011
TRL, can produce proatherogenic responses in cultured
endothelial and monocytic cells.74,76 These include activation
of adhesion and proinflammatory molecule expression and
impairment of endothelial nitric oxide production and insulin
signaling pathways.74,76 – 80
4.5.3. Macrophage LPL
Macrophages are a rich source of LPL in the vessel wall,81
and expression of LPL by macrophages could play a role in
accelerating atherogenesis by a mechanism that depends on
interaction with circulating TRL.82 For example, direct incubation of mouse peritoneal macrophages with TRL increases
macrophage cell triglyceride and fatty acid content; more importantly, this incubation increases expression of macrophage
inflammatory proteins, including tumor necrosis factor-␣,
interleukin-1, monocyte chemotactic protein-1, intercellular
adhesion molecule-1, and matrix metalloproteinase-3.83,84 Lipolytic products of TRL have also been shown to produce
cytotoxicity and apoptosis in isolated macrophages.85 Macrophage apoptosis is considered an important event that impacts
the in vivo atherogenic process.86
In summary, in vitro experimental models examining the
response of isolated endothelial cells or monocytes and
macrophages to TRL have produced results consistent with
atherogenicity of this class of particles. These particles, or
their lipolytic degradation products, can increase the expression of inflammatory proteins, adhesion molecules, and
coagulation factors in endothelial cells or monocytes and
macrophages. TRLs may interfere with the ability of HDL to
suppress inflammatory responses in cultured endothelial cells
and the capacity of apo AI or HDL to promote sterol efflux
from monocytes or macrophages. TRLs also impair endothelial cell– dependent vasodilation, enhance the recruitment and
attachment of monocytes to endothelium, may be directly
cytotoxic, and produce apoptosis in isolated vessel wall cells.
However, although the results from in vitro studies provide
important pathophysiological context and proof of concept,
final conclusions about atherogenicity and clinical significance of lowering triglyceride levels as a surrogate of TRL
particles must be based on in vivo studies that use appropriate
models of human dyslipidemia in randomized controlled
trials (RCTs), as will be elaborated on in Section 15.
5. Causes of Hypertriglyceridemia
5.1. Familial Disorders With High
Triglyceride Levels
Familial syndromes with triglyceride levels above the 95th
percentile by age and sex may be associated with an increased
risk of premature CVD, as in familial combined hyperlipidemia (FCHL).87–90 Alternatively, when triglyceride elevation
is very severe (ie, Ͼ1000 mg/dL), fasting chylomicronemia
may be the consequence of rare but recognizable single gene
mutations.91–93 The persistence of fasting chylomicronemia
leads to a syndrome characterized by eruptive xanthomas,
lipemia retinalis, and hepatosplenomegaly and is associated,
although not invariably, with acute pancreatitis.94,95 Because
the latter can lead to chronic pancreatitis or death, effective
treatment is of paramount importance. Nonetheless, there can
be no question that prevention of the markedly elevated
triglyceride levels seen in those with genetic syndromes of
triglyceride metabolism is an important therapeutic goal.
To understand these disorders, one must focus on LPL
regulation, because LPL is needed for the hydrolysis of
plasma triglyceride to FFA.96 The generation of FFA by LPL
is regulated by cofactors such as insulin and thyroid hormone.
Factors that reduce VLDL clearance can raise triglyceride
concentrations in those with high baseline levels (eg, usually
Ͼ500 mg/dL, because of the competition of VLDL and
chylomicrons for a common saturable removal mechanism).97
Table 4 lists syndromes of genetic hypertriglyceridemia.
The rare but monogenic disorders that cause a marked
impairment of LPL activity have clinical expression in
childhood. These young patients present with the chylomicronemia syndrome and an increased risk for pancreatitis and
may be homozygous for either LPL deficiency, apo CII
deficiency, or the more recently described APOA5 and
GPIHBP1 loss-of-function mutations.91–93,102,103 In some
populations, such as French Canadians, as many as 70% of
cases can be traced to a single founder.104
For those with less severe genetic disorders of triglyceride
metabolism, complex interactions between genetic and environmental factors may lead to the type V phenotype (fasting
chylomicronemia and increased VLDL). In these cases, triglyceride concentrations exceed 1000 mg/dL, and when exacerbated
by weight gain, certain medications (Table 5) or metabolic
perturbations can lead to the chylomicronemia syndrome and
increased risk of pancreatitis. Patients with heterozygous LPL
deficiency present with elevated triglyceride levels and low
HDL-C, but in association with excess alcohol, steroids, estrogens, poorly controlled DM, hypothyroidism, renal disease, or
the third trimester of pregnancy, triglyceride levels can rapidly
exceed 2000 mg/dL and produce the clinical sequelae of the
chylomicronemia syndrome. Although there is no single threshold of triglyceride concentration above which pancreatitis may
occur, increased risk is defined arbitrarily by levels exceeding
1000 mg/L. Overall, alcohol abuse and gallstone disease account
for at least 80% of all cases of acute pancreatitis, with hypertriglyceridemia contributing Ϸ10% of cases.105,134 A history of 2
predisposing factors in the same individual may cause confusion
about the proper diagnosis. If elevated triglyceride level persists
after the removal of exacerbating causes through diet modification, discontinuation of drugs (Table 5), and/or provision of
insulin therapy for patients with poorly treated DM,135 one must
consider rare disorders that are resistant to traditional therapies,
such as autoantibodies against LPL.136
Additional genetic syndromes in the differential diagnosis
of hypertriglyceridemia include mixed or familial combined
hyperlipidemia (FCHL), type III dysbetalipoproteinemia, and
familial hypertriglyceridemia (FHTG). FCHL is characterized by multiple lipoprotein abnormalities due to hepatic
overproduction of apo B– containing VLDL, IDL, and LDL,
whereby apo B levels exceed the 90th percentile.87,88 It is
observed in affected relatives in successive generations, and
the diagnosis is made when in the face of increased levels of
cholesterol, triglyceride, or apo B, at least 2 of the lipid
abnormalities identified in the patient also segregate among
the patient’s first-degree relatives.137 The variable clinical
Downloaded from by guest on May 13, 2015
Miller et al
Table 4.
Triglycerides and Cardiovascular Disease
2301
Familial Forms of High Triglycerides
Inheritance/Population
Frequency
Pathogenesis
Typical Lipid/Lipoprotein Profiles
Comments
Rare genetic syndromes
presenting as
chylomicronemia
syndrome
LPL deficiency (also
known as familial type I)
Autosomal recessive; rare
(1 in 106)
Increased chylomicrons due to very low
or undetectable levels of LPL;
circulating inhibitor to LPL has been
reported
Homozygotes: TG-to-cholesterol ratio
10:1; TG Ͼ1000 mg/dL; increased
chylomicrons
Homozygous mutations cause lipemia
retinalis, hepatosplenomegaly,
eruptive xanthomas accompanying
very high TG. CAD believed
uncommon, but cases reported
Apo CII deficiency
Autosomal recessive; rare
Increased chylomicrons due to absence
of needed cofactor, Apo CII
Homozygotes TG-to-cholesterol ratio
10:1; TG Ͼ1000 mg/dL; increased
chylomicrons
Obligate heterozygotes with normal
TG despite apo CII levels Ϸ30% to
50% of normal
Attacks of pancreatitis in
homozygotes can be reversed by
plasmapheresis; xanthomas and
hepatomegaly much less common
than in LPL deficiency
Rare
Mutations in the APOA5 gene, which
lead to truncated apo AV devoid of
lipid-binding domains located in the
carboxy-terminal end of the protein
Homozygotes: TG-to-cholesterol ratio
10:1; TG Ͼ1000 mg/dL; increased
chylomicrons
Apo A5 disorders can form familial
hyperchylomicronemia with vertical
transmission, late onset, incomplete
penetrance, and an unusual
resistance to conventional treatment
Rare; expressed in childhood
Mutations in GPIHBP1 may reduce
binding to LPL and hydrolysis of
chylomicron triglycerides
TG-to-cholesterol ratio 7:1; TG
Ͼ500 mg/dL; increased
chylomicrons partially responsive to
low-fat diet
May have lipemia retinalis and
pancreatitis; eruptive xanthomas not
reported
Rare
A heterozygous loss-of-function
mutation in 1 of several genes
encoding proteins involved in TG
metabolism. More than half of type V
patients carried 1 of the 2 apo A5
variants compared with only 1 in 6
normolipidemic controls98
TG 200-1000 mg/dL until secondary
trigger occurs; then TG can exceed
1000 mg/dL; increased VLDL and
chylomicrons
The promoter polymorphism
Ϫ1131TϾC is associated with
increased TG and CVD risk98
Rare, but carrier frequency
higher in areas with founder
effect (eg, Quebec)
Decrease in LPL
TG 200-1000 mg/dL until secondary
trigger occurs; then TG can exceed
1000 mg/dL; increased VLDL and
chylomicrons
Premature atherosclerosis can be
seen99 (or increased atherosclerosis
risk in familial hypercholesterolemia
heterozygotes with elevated TG, low
HDL100
Common; Ϸ5% to 10%;
likely polygenic, often not
expressed until adulthood
because of environmental
factors, obesity, stress
VLDL overproduction and reduced VLDL
catabolism result in saturation of LPL;
secondary causes exacerbate the
hypertriglyceridemia
TG 200-1000 mg/dL; apo B levels
are not elevated as in FCHL
Usually not associated with CHD
unless MetS features are seen or
baseline TG levels are high (eg,
Ͼ200 mg/dL)101; then increased CHD
may be present
FCHL
Genetically complex disorder;
common (1% to 2% in white
populations)
Increased production of apo B
lipoproteins; FCHL diagnosed with
combinations of increased cholesterol,
TG, and/or apo B levels in patients and
their first-degree relatives. See
interaction of multiple genes and
environmental factors such as adiposity
and the degree of exercise
Elevated cholesterol, TG, or both;
elevated apo B; small dense LDL is
seen
Obesity as indicated by increased
waist-to-hip ratio can greatly
increase apo B production in these
patients; usually onset is in
adulthood, but pediatric obesity may
allow for earlier diagnosis
Dysbetalipoproteinemia
(also known as familial
type III)
Autosomal recessive; rare;
requires an acquired second
“hit” for clinical expression
Defective apo E (usually apo EII/EII
phenotype); commonest mutation Apo
EII, Arg158Cys, causes chylomicrons
and VLDL remnants to build up in
plasma
TG and cholesterol levels elevated
and approximately similar should
raise clinical suspicion; non–HDL-C
is a better risk target than apo B
levels, which are low because these
are cholesterol-rich VLDL; see
increased intermediate-density
particles with ratio of directly
measured VLDL-C to plasma TG of
Ͼ0.3
Acquired second “hits” include
exogenous estrogen, alcohol, obesity,
insulin resistance, hypothyroidism,
renal disease, or aging; may be very
carbohydrate sensitive
Apo AV homozygosity
GPIHBP1
Other genetic syndromes
with hypertriglyceridemia*
Heterozygous apo AV
Heterozygous LPL
deficiency
Familial
hypertriglyceridemia
LPL indicates lipoprotein lipase; TG, triglyceride; CAD, coronary artery disease; apo, apolipoprotein; GPIHBP1, glycosylphosphatidylinositol-anchored high-density
lipoprotein– binding protein 1; VLDL, very low-density lipoprotein; CVD, cardiovascular disease; HDL, high-density lipoprotein; CHD, coronary heart disease; MetS,
metabolic syndrome; FCHL, familial combined hyperlipidemia; LDL, low-density lipoprotein; HDL-C, HDL cholesterol; and VLDL-C, VLDL cholesterol.
*Genetic syndromes that usually require an acquired cause to raise TG to high levels and present with either the type IV (increased VLDL) or type V (increased VLDL
and fasting chylomicronemia) phenotypes.
Downloaded from by guest on May 13, 2015
2302
Circulation
May 24, 2011
Table 5. Causes of Very High Triglycerides That May Be
Associated With Pancreatitis
Genetic91–95,105–107
Lipoprotein lipase deficiency
Apolipoprotein CII deficiency
Apolipoprotein AV deficiency
GPIHBP1 deficiency
Marinesco-Sjo¨gren syndrome
Chylomicron retention (Anderson) disease
Familial hypertriglyceridemia (in combination with acquired causes)
Acquired disorders of metabolism*
Hypothyroidism108
Pregnancy, especially in the third trimester†109 –111
Poorly controlled insulinopenic diabetes112,113
Drugs (medications)*
␣-Interferon114
Antipsychotics (atypical)115
-blockers such as atenolol‡116
Bile acid resins§117
L-Asparaginase118
Estrogens (oral, not transcutaneous)119
Protease inhibitors120
Raloxifene¶121
Retinoic acid drugs122
Sirolimus123
Steroids108
Tamoxifen124
Thiazides125
Diet*
Alcohol excess, especially with a high saturated–fat diet126,127
Diseases*
Autoimmune chylomicronemia (eg, antibodies to LPL,128 SLE129)
Chronic idiopathic urticaria130
Renal disease131
GPIHBP1 indicates glycosylphosphatidylinositol-anchored high-density lipoprotein– binding protein 1; LPL, lipoprotein lipase; and SLE, systemic lupus
erythematosus.
*These factors are especially concerning in the patient with preexisting
known hypertriglyceridemia, often on a genetic basis.
†Triglyceride increase with each trimester, but invariably, it is the third
trimester when hypertriglyceridemia in susceptible patients becomes
symptomatic.
‡Carvedilol is preferred in diabetic patients and those with hypertriglyceridemia who are receiving -blockers.132
§Bile acid resins should not be used with preexisting hypertriglyceridemia.
Estrogens in oral contraceptives or in postmenopausal hormone therapy;
hypertriglyceridemia can occur when the progestin component is stopped.133
¶In women who experienced hypertriglyceridemia with estrogen therapy.
expression of the lipid phenotypes makes identification difficult, and the combination of both family screening and
upper 10th percentile apo B levels is often needed for
diagnostic confirmation. A nomogram is available to calculate the probability that a patient is likely to be affected by
FCHL.138 In the absence of age- and sex-adjusted values for
a population, it has been further suggested that FCHL may be
present if hypertriglyceridemia (Ͼ133 mg/dL) and hyperapo B
(Ͼ120 mg/dL) are present.58 The important role of weight
gain in the clinical expression of the phenotype is underscored by the observation that as adiposity (assessed by an
elevated waist-to-hip ratio) increases, FCHL subjects express
higher plasma apo B concentrations than matched control
subjects. Genetic studies that used ultrasound findings and
alanine aminotransferase as surrogates for fatty liver have
shown that fatty liver is a hereditable aspect of FCHL.139 The
molecular basis underlying FCHL is largely unknown; genetic variants in the APOA1/C3/A4/A5 cluster and the
upstream stimulatory factor 1 (USF1) gene may play a
role.140 –142 Importantly, FCHL is strongly represented in
studies of survivors of myocardial infarction,87 especially
those survivors Ͻ40 years of age.143
The increased frequency with which FCHL is seen may relate
in part to the observation144 that in addition to multiple genes
that upregulate apo B secretion, the worldwide trend of energy
excess and associated weight gain exaggerates the baseline
abnormalities in apo B secretion. Although the phenotypic
expression of FCHL is delayed until young adulthood, as
childhood obesity rates increase, the higher adipose tissue mass
that drives apo B secretion accelerates the number of cases of
FCHL diagnosed in the young adult population.145
Familial type III hyperlipoproteinemia or dysbetalipoproteinemia is due to the accumulation of cholesterol-rich
VLDL,146,147 which results in a higher ratio of core CE to
triglyceride (Ͼ0.3) than in normal VLDL (0.2). The type III
phenotype is often characterized by near-equivalent cholesterol
and triglyceride values due to impaired receptor-mediated clearance, whereas the hypertriglyceridemia of type III reflects the
impaired processing of remnants and increased VLDL hepatic
production associated with increased levels of apo E. In this
disorder, apo B is not a useful marker of overall atherogenicity,
as in FCHL; non–HDL-C would be a more appropriate target.148
Homozygosity for the rare apo E2 isoform, which displays
defective binding to the LDL receptor compared with the most
common apo E3 isoform, is necessary for the expression of type
III, but it is not sufficient. Rather, additional factors (eg, obesity,
T2DM, or hypothyroidism) are generally required for expression
of the type III phenotype, which includes the characteristic
palmar or tuboeruptive xanthomas and increased cardiovascular
and peripheral vascular disease risk. Affected individuals may be
extraordinarily responsive to a low-carbohydrate (CHO) diet.149
FHTG has a population prevalence of Ϸ5% to 10% and is
defined by the familial occurrence of isolated high VLDL
levels with triglyceride values most commonly in the 200 to
500 mg/dL range. It is genetically heterogeneous, and its
expression is accentuated by the presence of a secondary
factor such as obesity or IR. Initially, it was thought that
FHTG was not associated with an increased risk of CVD, as
contrasted with FCHL.87 However, this was reexamined in
the National Heart, Lung, and Blood Institute’s Family Heart
Study, which studied 5381 subjects from 1245 families.90
FCHL and FHTG were diagnosed in 10.2% and 12.3% of 334
random control families, respectively, and in 16.7% and
20.5% of 293 families with at least 1 case of premature CVD.
MetS was identified in 65% of FCHL and 71% of FHTG
patients compared with 19% of control subjects without
Downloaded from by guest on May 13, 2015
Miller et al
Table 6. Association Between BMI and Hypertriglyceridemic
Status (>150 mg/dL or >200 mg/dL)*
TG Concentration,
mg/dL
TG Concentration,
mg/dL
Ն150
(nϭ1744)
Ͻ150
(nϭ3250)
Ն200
(nϭ937)
Ͻ200
(nϭ4057)
Ͻ25
20.1
42.7
17.5
39.0
25 to Ͻ30
39.9
31.6
39.6
33.3
Ն30
39.9
25.6
42.9
27.7
BMI, kg/m2
BMI indicates body mass index; TG, triglyceride.
*Values come from National Health and Nutrition Examination Survey
1999 –2004. Values are percent of participants within a TG category as a
function of BMI status.
FCHL or FHTG. The increased prevalence of the MetS alone
could account for the elevated CVD risk associated with both
FCHL and FHTG. Thus, the increasing prevalence of both
obesity and MetS appears to increase the frequency, onset of
expression, and severity of genetic triglyceride syndromes.
Finally, genome-wide association studies have uncovered
multiple loci associated with high levels of triglyceride.150
Specifically, common variants in APOA5, glucose kinase
regulatory protein (GCKR), LPL, and APOB have been
identified, thereby supporting a role for both common and
rare variants responsible for hypertriglyceridemia.151 Efforts
are ongoing to identify genetic variants that influence the
response to drugs, which may be used to tailor drug selection
and dosing to the profile of the individual patient.152
5.2. Obesity and Sedentary Lifestyle
Evidence from epidemiological and controlled clinical trials
has demonstrated that triglyceride levels are markedly affected by body weight status and body fat distribution. Data
from 5610 participants Ն20 years of age from NHANES
between 1999 and 2004 reported a relationship between body
mass index (BMI) and triglyceride concentration.153 Approximately 80% of participants classified as overweight (BMI 25
to 30 kg/m2) and obese (BMI Ն30 kg/m2) had triglyceride
levels Ն150 mg/dL. When the triglyceride cut point was
Ն200 mg/dL, Ϸ83% of participants were classified as overweight or obese (Table 6). Participants with a normal BMI
(Ͻ25 kg/m2) were more likely to have triglyceride levels
Ͻ150 mg/dL (43%) and Ͻ200 mg/dL (39%). A similar trend
was reported recently for youths in the NHANES Survey
1999 –2006154; only 5.9% of participants in the normalweight category had high triglyceride levels (Ն150 mg/dL),
whereas 13.8% and 24% of overweight or obese individuals
had elevated triglyceride levels.154
In addition to the association between triglyceride levels and
BMI, the Framingham Heart Study155 reported strong associations of triglyceride levels with both subcutaneous abdominal
adipose tissue and visceral adipose tissue in men and women
(mean age 50 years). For visceral adipose tissue, the multivariable-adjusted residual effect was approximately twice that for
subcutaneous abdominal adipose tissue for both women and
men (PϽ0.0001 for both). Thus, although it is clear that excess
adiposity is associated with elevated triglyceride levels, visceral
adiposity is a greater contributor than subcutaneous adipose
Triglycerides and Cardiovascular Disease
2303
tissue.155,156 Excess visceral fat in patients with IR may further
expose the liver to higher levels of FFAs via the portal
circulation, and increased flux of FFAs to the liver contributes to
increased secretion of VLDL. A consequence of excessive fat
combined with impaired clearance or storage of triglycerides in
subcutaneous fat is ectopic fat deposition in skeletal muscle,
liver, and myocardium, which may result in IR, nonalcoholic
fatty liver disease, and pericardial fat.157,158 A disproportionate
amount of visceral versus subcutaneous adipose tissue may also
reflect a lack of adipocyte storage capacity, with saturation of the
normal sites of fat deposition. Subcutaneous fat may serve as a
protective factor with regard to the metabolic consequences of
obesity159; a relative paucity (ie, lipodystrophy) is associated
with hypertriglyceridemia.
5.3. Lipodystrophic Disorders
5.3.1. Genetic Disorders
Lipodystrophy can be inherited or acquired. The inherited
lipodystrophies are rare disorders that are characterized by loss
of adipose tissue. These disorders may be inherited in either
autosomal recessive or dominant patterns. The loss of adipose
tissue is selective and variable and may be partial or complete.
Some forms manifest at birth, whereas others become evident later
in life, with loss of fat beginning in childhood and puberty.160
Hypertriglyceridemia is seen in many lipodystrophic disorders, often in association with low HDL-C. The severity
of hypertriglyceridemia is related to the extent of the loss of
fat,161 and mechanisms include decreased storage capacity of fat,
with delayed clearance of TRLs and increased hepatic lipid
synthesis. Fat accumulation in insulin target organs may cause
lipotoxicity and IR. One of the most severe forms is congenital
generalized lipodystrophy, a rare autosomal recessive disorder
that presents at birth with a nearly complete absence of subcutaneous adipose tissue. Affected children may present with
metabolic derangements, including severe hypertriglyceridemia,
with eruptive xanthomas and pancreatitis.162 At least 3 molecular
variants have been described that involve genes whose products
are necessary for the formation and maturation of lipid droplets
in adipocytes.160 Varieties of familial partial lipodystrophy,
which are rare autosomal dominant disorders, involve fat loss
from the extremities more than the trunk. Hypertriglyceridemia
is most severe in the Dunnigan variety, which is caused by a
defect in the gene for lamin A and tends to be more severe in
women than in men.162,163
5.3.2. Acquired Disorders
HIV–associated dyslipidemic lipodystrophy is characterized
by increased content of triglycerides in VLDL, LDL, and
HDL due to reduced clearance of TRL.164 The fat distribution
abnormalities appear in 1 of 3 prevalent forms: (1) Generalized or localized lipoatrophy, which usually involves the
extremities, buttocks, and face; (2) lipohypertrophy with
generalized or local fat deposition that involves the abdomen,
breasts, dorsocervical region, and supraclavicular area; or (3)
a mixed pattern with central adiposity with peripheral lipoatrophy. Factors that influence the development of lipodystrophy include increased duration of HIV infection, high viral
load, low CD4 counts before highly active antiretroviral
Downloaded from by guest on May 13, 2015
2304
Circulation
May 24, 2011
therapies, and prolonged survival and duration of highly
active antiretroviral therapies. Several antiretroviral drugs
used to treat HIV infection can cause hypertriglyceridemia,
including the protease inhibitors lopinavir and ritonavir.165
Other acquired forms of lipodystrophy occur with autoimmune diseases such as juvenile dermatomyositis.161 Patients
with acquired generalized lipodystrophy lose fat from large
areas of the body during childhood and adolescence, and this
is often accompanied by hepatic steatosis.162
6. Diabetes Mellitus
High triglyceride levels that accompany either normal or impaired
fasting glucose predict the development of T2DM,166,167 and
therefore, hypertriglyceridemic states should prompt surveillance to rule out T2DM. In addition, Ϸ35% of T2DM adults
have fasting triglyceride levels Ն200 mg/dL168 associated
with decreased HDL-C and small, dense LDL particles.41,53,112,113,169,170 Patients with poorly controlled type 1
diabetes mellitus (T1DM) may exhibit a similar pattern of
dyslipidemia. Causes of hypertriglyceridemia in DM include
increased hepatic VLDL production and defective removal of
chylomicrons and CMRs, which often reflects poor glycemic
control.171
6.1. Type 1 Diabetes Mellitus
6.1.1. Chylomicron Metabolism
In general, chylomicron and CMR metabolism can be altered
significantly in DM.49,53 In untreated or poorly controlled
T1DM, LPL activity will be low, and ppTG levels will in turn
be increased. Insulin therapy rapidly reverses this condition,
which results in improved clearance of chylomicron triglyceride from plasma. In chronically treated T1DM, LPL measured in postheparin plasma, as well as adipose tissue LPL,
may be normal or increased, and chylomicron triglyceride
clearance may also be normal. Other hepatic and intestinally
derived proteins that modulate chylomicron production and
intestinal lipoprotein secretion (eg, microsomal transfer protein and glucagon-like peptides 1 and 2) have been studied in
T1DM-induced rodents, but their clinical relevance vis-a`-vis
chylomicron metabolism in human T1DM has yet to be
established.172–174
6.1.2. VLDL Metabolism
Individuals with DM frequently have elevated levels of
VLDL triglyceride. In T1DM, triglycerides correlate closely
with glycemic control, and marked hyperlipidemia can be
found in patients with DM and ketoacidosis. The basis for
increased VLDL in subjects with poorly controlled but
nonketotic T1DM is usually overproduction of these lipoproteins.113 Specifically, insulin deficiency results in increased
adipocyte lipolysis, with FFA mobilization driving hepatic
VLDL apo B secretion. Reduced clearance of VLDL apo B
also contributes to triglyceride elevation in severe cases of
uncontrolled DM. This results from a reduction of LPL,
which returns to normal with adequate insulinization. In fact,
plasma triglycerides may be low-normal with intensive insulin treatment in T1DM, with lower than average production
rates of VLDL being observed in such instances.
6.2. Type 2 Diabetes Mellitus
6.2.1. Chylomicron Metabolism
In T2DM, metabolism of dietary lipids is complicated by
coexistent obesity and the hypertriglyceridemia associated
with IR. Defective removal of chylomicrons and CMRs has
been observed in T2DM49; however, LPL is normal or only
slightly reduced in untreated patients.49,112 Because both
fasting hypertriglyceridemia and reduced HDL-C are common in T2DM and are correlated with increased ppTG levels,
it is difficult to identify a direct effect of T2DM on chylomicron metabolism. Recently, studies have indicated that IR
can result in increased assembly and secretion of chylomicrons.175 This parallels the central defect of increased hepatic
VLDL secretion in IR and T2DM (section 6.2.2) and clearly
contributes to increased postprandial lipid levels with T2DM.
6.2.2. VLDL Metabolism
Overproduction of VLDL, with increased secretion of both
triglycerides and apo B100, appears to be the central cause of
increased plasma VLDL levels in patients with T2DM.176
Increased assembly and secretion of VLDL is probably a
direct result of both IR (with loss of insulin’s action to
stimulate degradation of newly synthesized apo B) and
increases in FFA flux to the liver and de novo hepatic
lipogenesis (with increased triglyceride synthesis). LPL levels have been reported to be reduced112 in T2DM, and this
may contribute significantly to elevated triglyceride levels,
particularly in severely hyperglycemic patients. Because
obesity, IR, and concomitant familial forms of hyperlipidemia are common in T2DM, study of the pathophysiology is
difficult. The interaction of these overlapping traits also
makes therapy less effective. In contrast to T1DM, in which
intensive insulin therapy normalizes (or even “supernormalizes”) VLDL levels and metabolism, insulin or oral agents
only partly correct VLDL abnormalities in the majority of
individuals with T2DM.113 Therapies such as metformin and
the thiazolidinediones can lower plasma triglyceride concentrations 10% to 15% and 15% to 25%, respectively.177 The
thiazolidinediones appear to improve peripheral insulin sensitivity, and this leads to inhibition of lipolysis in adipose
tissue. Plasma levels of FFAs fall Ϸ25% at the highest dose
of both of the presently available thiazolidinediones, and such
changes should lead to lower hepatic triglyceride synthesis
and reduced VLDL secretion. However, pioglitazone lowers
triglyceride levels by increasing LPL-mediated lipolysis,
whereas VLDL secretion remains unchanged.178 Rosiglitazone does not affect triglyceride levels, although the basis for
this difference is unclear.179
6.2.3. Small LDL Particles
LDL particles in patients with DM may be atherogenic even
at normal LDL-C concentrations. For example, glycosylated
LDL can be taken up by macrophage scavenger receptors in
an unregulated manner, thereby contributing to foam cell
formation.180 In addition, hypertriglyceridemia is associated
with small, dense, and CE-depleted LDL particles. Thus,
individuals with T2DM and mild to moderate hypertriglyceridemia exhibit the pattern B profile of LDL (smaller, denser
particles) described by Austin and Krauss180; these particles
Downloaded from by guest on May 13, 2015
Miller et al
Table 7. Cardiovascular Risk Components of the
Metabolic Syndrome*
Increased waist circumference
Ͼ40 inches in men (Ͼ35 inches for
Asian men); Ͼ35 inches in women
(Ͼ31 inches for Asian women) or
population- and country-specific
definitions
High triglycerides
Ն150 mg/dL, or taking medication for
high triglycerides
Low HDL-C (good cholesterol)
Ͻ40 mg/dL in men; Ͻ50 mg/dL in
women, or taking medication for low
HDL-C
Elevated blood pressure
Ն130 mm Hg systolic
Ն85 mm Hg diastolic, or taking
antihypertensive medication in a patient
with a history of hypertension
Elevated fasting glucose
Ն100 mg/dL or taking medication to
control blood sugar
HDL-C indicates high-density lipoprotein cholesterol.
*The metabolic syndrome is diagnosed when a person has Ն3 of these risk
factors.
Adapted from Huang182 and NCEP ATP III.182a
may be more susceptible to oxidative modification and
catabolism via macrophage scavenger receptors than pattern
A LDL particles. Overproduction of LDL apo B100 may also
occur with T2DM even with mild degrees of hyperglycemia,
especially if there is concomitant elevation of VLDL, resulting in the atherogenic dyslipidemic triad, mixed hyperlipidemia, or FCHL.
6.2.4. Reduced HDL-C
In T1DM, HDL-C levels are often normal; however, in
decompensated T1DM with hypertriglyceridemia, CE transfer protein–mediated exchange will result in low HDL-C
concentrations. Similarly, in T2DM, especially in the presence of increased secretion of apo B– containing lipoproteins
and concomitant hyperlipidemia, CE transfer protein–mediated transfer of HDL CE to those lipoproteins results in lower
levels of HDL-C (and increased HDL triglycerides). Fractional catabolism of apo AI is increased in T2DM with low
HDL-C, as it is in nondiabetic subjects with similar lipoprotein profiles. Although apo AI levels are reduced consistently,
correction of hypertriglyceridemia does not usually alter apo
AI levels.53,181
6.2.5. Summary
In summary, T1DM may be associated with elevations of
VLDL triglyceride and LDL-C if glycemic control is poor or
if the patient is ketotic. In contrast, T2DM is often accompanied by high triglyceride levels, reduced HDL-C, and the
presence of smaller CE-depleted LDL particles. Treatment
with hypoglycemic agents has a variable drug-dependent
effect on plasma lipid levels.
7. Metabolic Syndrome
Elevated triglyceride levels, along with increased waist circumference, elevated fasting glucose, elevated blood pressure, or reduced HDL-C levels, are MetS risk factors, with a
tally of 3 needed for the diagnosis (Table 7). The prevalence
Triglycerides and Cardiovascular Disease
2305
of MetS in the United States is currently estimated at 35% in
both men and women183 and is higher in CVD patients; in
NHANES III, MetS was present in Ͼ40% versus 28% of
subjects with or without CVD, respectively.19
7.1. Prevalence of Elevated Triglyceride in MetS
The prevalence of triglyceride levels Ն150 mg/dL is nearly
twice as high in subjects with MetS as in those without
MetS.184,185 Among individual components of MetS, high
triglyceride level was the second most common (74%), after
elevated blood pressure.186 A high prevalence of triglyceride
levels Ն150 mg/dL (72%) was also observed in patients with
MetS and CVD.187 In contrast, a low prevalence of hypertriglyceridemia was reported in MetS patients with advanced
heart failure owing in part to hepatic congestion and
cachexia.188
7.2. Prognostic Significance of Triglyceride
in MetS
Longitudinal and cross-sectional studies have suggested that
high triglyceride level may be a predictor of CVD risk. For
example, a “hypertriglyceridemic waist,” as defined by elevated triglyceride and increased waist circumference, was
associated with arteriographic CVD189; elevated triglyceride
level was also associated with myocardial infarction and
stroke risk in NHANES III.19 Nonetheless, clinical outcome
studies have failed to demonstrate the prognostic significance of
triglyceride levels in MetS. Rather, other factors (eg, low
HDL-C, elevated glucose, or elevated blood pressure) independently predicted CVD and all-cause mortality in RCTs.184 –187
Thus, although elevated triglyceride is highly prevalent in
subjects with MetS, it is less predictive of CVD outcomes
than other MetS components, thus relegating triglyceride
level as an important biomarker rather than a prognosticator
of CVD.
8. Chronic Kidney Disease
Dyslipidemia is commonly present in patients with chronic
kidney disease (CKD) and occurs at all stages. It occurs in
both children and adults,190 in those with nephrotic syndrome,
in patients undergoing dialysis, and after renal transplantation. A triglyceride level Ͼ200 mg/dL is present in Ϸ50% of
those with CKD, often in association with low HDL-C. In
addition, several risk factors that alter lipoprotein metabolism, such as T2DM, obesity, IR, and MetS, frequently are
also found in CKD subjects,191 which results in qualitative
lipoprotein abnormalities that include increased RLPs and
small, dense LDL particles. Patients with nephrotic syndrome
or undergoing peritoneal dialysis are especially likely to
exhibit a proatherogenic lipid profile.192 In renal transplant
recipients, hyperlipidemia is a frequent finding, affecting
80% to 90% of adult recipients despite normal renal
function.193
The primary abnormality in CKD subjects is reduced
catabolism of TRL,131 which results in elevated levels of
RLPs and prolonged ppTG that begins during the early stages
of CKD.194 The diminished clearance of TRL results from
reduction in activity of both LPL and HTGL. Alterations in
Downloaded from by guest on May 13, 2015
2306
Circulation
May 24, 2011
the composition of circulating triglycerides associated with
increases in the LPL inhibitor, apo CIII, and decreases in the
LPL activator, apo CII, may exacerbate this defect.194 Other
factors such as increased parathyroid hormone levels,135
increased calcium accumulation in liver and adipose tissue,195
and a putative circulating lipase inhibitor (ie, CE-poor pre-HDL196) have also been shown to downregulate LPL in the
plasma of uremic patients. In renal transplant recipients,
immunosuppressive agents such as corticosteroids, calcineurin inhibitors, and rapamycin may significantly worsen dyslipidemia. Finally, other factors that accompany CKD, such
as DM, MetS, hypothyroidism, obesity, excessive alcohol
intake, marked proteinuria, and chronic liver disease, may
potentiate hypertriglyceridemia.
Although the beneficial effects of lipid-lowering therapy in
both primary and secondary prevention of CVD in the general
population are well established, there is a paucity of RCTs
addressing the role of treatment of dyslipidemia, particularly
hypertriglyceridemia, in the CKD population. In fact, a
number of studies have shown a paradoxical effect of low
serum cholesterol in CKD and dialysis populations to be an
adverse predictor of mortality.197–200 This might reflect an
adverse outcome of chronic inflammation and malnutrition
that results in risk reversal. Of 2 clinical outcome trials
completed recently, neither demonstrated benefits of LDL-C
and lowering triglyceride levels in hemodialysis patients.201,202 Results from RCTs to date cannot be extrapolated
to milder forms of CKD, and therefore, an RCT is warranted
in this subgroup. Until then, the benefit of lowering triglyceride levels in CKD remains unproven.
9. Interrelated Measurements and Factors
That Affect Triglycerides
9.1. Non–HDL-C, Apo B, and Ratio of
Triglycerides to HDL-C
As discussed previously in this statement, TRLs and RLPs in
particular are atherogenic. Therefore, when a high-triglyceride profile is assessed, it is important to assess the overall
atherogenicity of plasma. Both non–HDL-C (non–HDL-Cϭ
TCϪHDL-C), which is a summary measure of all the
cholesterol carried in apo B– containing particles, and directly
measured apo B levels can be used for this purpose.
9.1.1. Non–HDL-C
The value of non–HDL-C in CVD risk assessment was first
proposed by Frost and Havel in 1998,61 and this relationship has
now been confirmed in many studies.203–216 In the Pathobiological Determinants of Atherosclerosis in Youth (PDAY) Study, an
autopsy study of 15- to 34-year-old individuals who died of
non-CVD causes, non–HDL-C was correlated with fatty
streaks and raised lesions in the right coronary artery.204 In
adults, non–HDL-C correlates with coronary calcification205,206 and CVD progression.207 Although the relationship
between non–HDL-C and CVD outcomes has been studied
less extensively than the relationship between LDL-C, myocardial infarction, and cardiovascular death, there are prospective studies that have demonstrated strong relationships
between non–HDL-C levels and CVD events in the ab-
sence208 –210 or presence211,212 of preexisting CVD or acute
coronary syndrome. Long-term data from the Lipid Research Clinics Follow-Up Study demonstrated that non–
HDL-C levels were strongly predictive of CVD mortality
after 19 years of follow-up.213 In the Diabetes Epidemiology: Collaborative analysis Of Diagnostic criteria in Europe (DECODE) study, non–HDL-C predicted 10-year CVD
mortality only among those with impaired fasting glucose,
not among those with normal fasting glucose.214 Non–HDL-C
levels also predicted ischemic stroke,215,216 and its predictive
value has been further demonstrated in both men and women,
across all age and ethnic groups, and with or without CVD or
associated risk factors.
Non–HDL-C can be assessed in the nonfasting state22,217
and is more accurately determined because it does not depend
on fasting triglyceride concentrations, as calculated LDL-C
does.61 Data on the distribution of non–HDL-C in the US
population are available for children (Bogalusa cohort218) and
adults (NHANES III219), and non–HDL-C levels in childhood
strongly predict such levels in adulthood.219,220 Among
adults, age-adjusted non–HDL-C concentrations are lower
among women than men, increase with age through age 65
years (to a greater degree in women than in men), and decline
in individuals Ͼ65 years of age (more so in men than in
women).209 Non-Hispanic black women and men have the
lowest non–HDL-C levels, whites are intermediate, and
Mexican Americans have the highest level. Among women,
non–HDL-C levels were inversely related to education.219
The ATP III guidelines recommended that non–HDL-C
serve as a secondary treatment target if elevated levels of
triglyceride (Ն200 mg/dL) persisted after LDL-C target
levels had been achieved.10,221 The non–HDL-C target was
set 30 mg/dL higher than LDL-C, based on the fact that a
triglyceride level of 150 mg/dL corresponds to a VLDL
cholesterol level of 30 mg/dL.221 A meta-analysis of clinical
trial data supports a 1:1 relationship between the percent of
non–HDL-C lowering and the percent of cardiovascular
reduction.222 Yet recent data indicate that non–HDL-C remains undertreated in the United States. For example, in the
National Cholesterol Education Program Evaluation Project
Utilizing Novel E-Technology (NEPTUNE) II survey, the
proportion of individuals with triglyceride levels Ն200
mg/dL who had achieved their non–HDL-C goal ranged from
64% with 0 to 1 risk factor to 52% with Ն2 risk factors and
only 27% with CVD risk equivalents.223 Data from NHANES
also showed that only a modest proportion (37%) of high-risk
individuals were at their non–HDL-C goal.224 Finally, in the
Bypass Angioplasty Revascularization Investigation 2 Diabetes (BARI-2D) study of men and women with CVD and DM,
the mean non–HDL-C level (131Ϯ40 mg/dL) was above the
recommended goal of Ͻ130 mg/dL.225
9.1.2. Apo B
Apo B is contained within all potentially atherogenic lipoproteins, including lipoprotein(a), LDL, IDL, VLDL, and
TRL remnants. Moreover, because each of these lipoprotein
particles contains 1 apo B molecule, apo B provides a direct
measure of the number of atherogenic particles present in the
circulation.58,226 A direct link between apo B and severity of
Downloaded from by guest on May 13, 2015
Miller et al
CVD in patients undergoing diagnostic cardiac catheterization227 was followed by numerous studies that supported apo
B as being highly predictive of CVD and, in some cases, more
closely linked to CVD outcomes than LDL-C.58,228,229 In
contrast, findings of studies that compared apo B with
non–HDL-C have been more heterogeneous. Although apo B
and non–HDL-C are highly correlated, their interrelationship
varies depending on the underlying lipid disorder and treatment status.148,230 As reviewed recently,231 many epidemiological studies have compared the predictive value of apo B
with non–HDL-C for CVD outcomes and have more commonly identified apo B to be either superior or equivalent to
non–HDL-C, whereas non–HDL-C has only been more
predictive in limited cases.143 Yet in studies that demonstrated statistically significant differences between apo B and
non–HDL-C, the differences in point estimates were often
quite small and therefore unlikely to have a major impact in
day-to-day clinical practice.231 Consequently, the ATP III
guidelines favored use of non–HDL-C rather than apo B; this
was related in part to the limited availability of apo B assays
in clinical laboratories, compounded by the relative lack of
standardization of the apo B assay and higher cost than for
non–HDL-C.221 Nevertheless, in view of additional data and
in the presence of standardization that has accrued since ATP
III was released in 2001, a panel of international experts has
recommended a revision of this assessment.229
9.1.3. Ratio of Triglycerides to HDL-C
The joint occurrence of high triglyceride level and low
HDL-C characterizes the dyslipidemia of MetS. It strongly
predicts CVD in observational studies, and post hoc analyses
of clinical trials suggest that patients who have both adverse
markers tend to benefit more from treatment than those who
do not.39,40,232 The ratio of triglycerides to HDL-C serves as
a summary measure for either elevated triglyceride level, low
HDL-C, or both. It is linked to IR in whites233,234 (but not in
blacks) and to small, dense LDL particles and higher LDL
particle numbers.233,235 The link between IR and the ratio of
triglycerides to HDL-C is already apparent in youth.236 In
recent years, case-control and prospective studies have linked
the ratio of triglycerides to HDL-C to CVD incidence,
outcomes, and all-cause mortality,237–242 with improved predictive power in some studies compared with LDL-C or
non–HDL-C.238,239,242
10. Factors That Influence
Triglyceride Measurements
Considerable biological and, to a lesser extent, analytic
variability exists in the measurement of triglycerides, with a
median variation of 23.5% compared with 4.9% for TC, 6.9%
for HDL-C, and 6.5% for calculated LDL-C.243 Although
biological variability as a consequence of lifestyle, medications, and metabolic abnormalities accounts for most of the
intraindividual variation in triglycerides, other considerations
that affect triglyceride measurements include postural effects,
phlebotomy-related issues, and fasting versus nonfasting
state. These latter considerations become more critical in the
design of clinical trials aimed at evaluating the role of
Triglycerides and Cardiovascular Disease
2307
triglyceride levels in CVD risk assessment. In this regard, it
has been suggested that in addition to the recommendations
listed below (ie, posture- and phlebotomy-related issues), an
average of 3 fasting serial samples be drawn at least 1 week
apart and within a 2-month time frame to provide a more
accurate estimate of baseline triglyceride levels.243
10.1. Postural Effects
Because TRLs do not readily diffuse between vascular and
extravascular compartments, the increase in plasma volume
that accompanies movement from a standing to a supine
position also results in a temporary decrease in triglyceride
concentrations.244 As a result of these positional changes,
triglyceride levels are reduced by Ϸ12% after 20 to 30
minutes and by 15% to 20% by 40 minutes, with more modest
decreases when a person changes from standing to sitting (ie,
8% and 10%, respectively).245,246 Thus, it is recommended
that standardization of blood sampling conditions be instituted on each occasion (eg, 5 minutes in sitting position) to
minimize variability in triglyceride measurements.243
10.2. Phlebotomy-Related Issues
The 2 relevant phlebotomy-related issues that impact triglyceride levels are the venous occlusion time and differences
between serum- and plasma-containing tubes. Because increases of as much as 10% to 15% in triglyceride levels have
been reported with prolonged venous occlusion times, the
National Cholesterol Education Program Working Group on
Lipoprotein Measurement has recommended that a tourniquet
not be applied for Ͼ1 minute before blood withdrawal.243
Moreover, plasma tubes contain ethylenediaminetetraacetic
acid and reduce triglyceride levels by 3% compared with
serum because of the relative dilution of nondiffusible components in plasma.247 Therefore, reliability in triglyceride
measurements will be enhanced when either serum or plasma
is used consistently.
10.3. Fasting Versus Nonfasting Levels
Although an overnight fast has been the traditional method
for assessment of triglyceride levels, there are several lines of
evidence that support a nonfasting measurement to screen for
hypertriglyceridemia. First, the fasting state only represents a
small proportion of time spent each day and therefore
understates levels that are attained in the postprandial state.
From a pathophysiological standpoint, a postprandial state
enriched in dietary fat (eg, 70 to 100 g) may affect saturation
parameters and impede hepatic removal of circulating
CMRs,248 thereby permitting their uptake and incorporation
by macrophages.63,249,250 Supportive observational studies
have recently identified nonfasting triglyceride levels to be a
superior predictor of CVD risk compared with fasting
levels.21,22
The relationship between fasting and ppTG levels and
factors that influence the response to dietary fat in healthy
normolipidemic subjects were reviewed in 39 studies approximating 1500 ppTG measurements.68,251–288 Although baseline dietary characteristics, fat content, and composition of
test meals often varied between studies, a graded association
Downloaded from by guest on May 13, 2015
2308
Circulation
May 24, 2011
Figure 5. Practical algorithm for screening and
management of elevated triglycerides. TFA indicates trans fatty acid; SFA, saturated fatty acid;
MUFA, monounsaturated fatty acid; PUFA, polyunsaturated fatty acid; and EPA/DHA, eicosapentaenoic acid/docosahexaenoic acid.
*When patients present with abdominal pain due
to hypertriglyceridemic pancreatitis, removal of all
fat from the diet is required (with the possible
exception of medium chain triglycerides [MCTs])
until appropriate therapies lower triglyceride levels
substantially.
existed between the amount of dietary fat in the test meal and
the ppTG response. For example, a meal that contained up to
15 g of fat was associated with minimal (20%) increases in
peak ppTG levels,276 whereas high-fat meals (eg, 50 g),
including those served in popular fast-food restaurants, increased triglyceride levels by at least 50% beyond fasting
levels.68,273,275,279 Because median triglyceride levels in US
adults range between 106 (women) and 122 (men) mg/dL,
measurement of nonfasting triglyceride levels in the absence
of a high-fat meal (eg, Ͻ15 g) would be expected to eliminate
the requirement for a fasting lipid panel in a sizeable
proportion of otherwise healthy adults.
A practical algorithm for screening triglyceride measurements is suggested in Figure 5. In normotriglyceridemic
subjects (ie, fasting triglyceride levels Ͻ150 mg/dL), consumption of a low-fat breakfast (ie, Ͻ15 g) before blood
sampling would not be expected to raise ppTG levels above
200 mg/dL. In these cases, no further testing for hypertriglyceridemia is indicated, although further discussion of lifestyle
measures may be advocated on the basis of that individual’s
level of risk. However, if nonfasting triglyceride levels equal
or exceed 200 mg/dL, a fasting lipid panel is recommended
within a reasonable (eg, 2 to 4 weeks) time frame.
Table 8.
11. Special Populations
11.1. Children and Adolescent Obesity
Although the consequences of atherosclerotic CVD are seen
only rarely in children, the early pathophysiological changes
in arteries begin soon after birth and accelerate during
adolescence.289 The same risk factors associated with disease
severity and progression in adults are present in the pediatric
population, and the degree to which these risk factors are
present in childhood is predictive of their prevalence in
adulthood.290,291 Therefore, it is clear that primary prevention
of CVD should begin in childhood, as has been the established policy of the American Heart Association, the American Academy of Pediatrics, and the National Heart, Lung,
and Blood Institute.292,293 The National Heart, Lung, and
Blood Institute’s Pediatric Cardiovascular Risk Reduction
Initiative panel has completed its work, and a full report was
anticipated in 2011. Table 8 presents the pediatric cut points
for hypertriglyceridemia, although these reference values are
based on data from the 1981 Lipid Research Clinics prevalence study.293 More recent data from NHANES 1999 –2006
identified a triglyceride level Ն150 mg/dL in 11.4% of boys
and 8.8% of girls 12 to 19 years of age, with the highest rate
(16.4%) in the 18- to 19-year-old group.154
Age- and Sex-Based Reference for Plasma Triglycerides in Children
Boys, by Age Group
Triglyceride
Percentile
Girls, by Age Group
5–9 y
10 –14 y
15–19 y
5–9 y
10 –14 y
75th: Acceptable
58
74
88
74
85
85
90th: Borderline
70
94
125
103
104
112
95th: High
85
111
143
120
120
126
Values are milligrams per deciliter.
Downloaded from by guest on May 13, 2015
15–19 y
Miller et al
11.1.1. Risk Factors for Hypertriglyceridemia
in Childhood
The genetic abnormalities of triglyceride metabolism (notably, LPL, APOC2, and, most recently, APOA5 and
GPIHBP1) that may be identified in childhood are rare and
generally diagnosed soon after birth. More commonly identified are milder triglyceride level elevations (ie, 100 to 500
mg/dL) associated with environmental triggers such as poor
diet, lack of exercise, obesity, DM, and MetS.
11.1.2. Obesity and High Triglyceride Levels in Childhood
At least one third of American children and adolescents are
overweight, and childhood obesity represents the major cause
of pediatric hypertriglyceridemia. Approximately 1 in 5
children with a BMI above the 95th percentile are hypertriglyceridemic, a rate that is 7-fold higher than for nonobese
children 6 to 10 years of age.294,295 Obese children are also
more prone to have other CVD risk factors such as IR, high
LDL-C, low HDL-C, and hypertension. In 2006, the American Heart Association convened the Childhood Obesity
Research Summit to highlight the significance of pediatric
obesity in CVD and to set research priorities for prevention
and treatment.295
11.1.3. IR and T2DM in Childhood
Studies in children, including the Cardiovascular Risk in
Young Finns Study296 and a Pima Indian population study,297
indicate that IR precedes the development of other risk
factors, including obesity, hypertension, and hypertriglyceridemia. There are some impediments to the study of IR in
youth, namely, lack of consensus for serum insulin norms and
the well-documented physiological IR of puberty. Despite
ongoing controversy in this area, 1 recent study identified IR
(measured by fasting insulin) as being associated with failure
to respond to therapeutic lifestyle change in obese adolescents.298 In fact, recent data from NHANES III found a 7%
prevalence of impaired fasting glucose in US adolescents.
However, Mexican Americans and overweight adolescents
had the highest rates (13% and 17.8% respectively) of
impaired fasting glucose, which was associated with significantly higher fasting insulin, dyslipidemia, and
hypertension.299
Impaired glucose tolerance is also associated with an
increased incidence of hypertriglyceridemia. For example, in
the NHANES cohort of 1999 –2000, Williams et al299 found
that mean triglyceride levels were 28% higher in adolescents
with impaired glucose tolerance than in those with normal
fasting glucose concentrations. Triglyceride levels were independently associated with physical activity levels and
sugar-sweetened beverage intake in the NHANES 1999 –
2004 studies of adolescents (nϭ6967) 12 to 19 years of age.
Each additional daily serving of sugar-sweetened beverages
was associated with a 2.25-mg/dL increase in triglyceride
levels, as well as increases in IR, LDL-C, and systolic blood
pressure and a decrease in HDL-C. In boys but not in girls,
the combination of a high level of physical activity coupled
with low intake of sugar-sweetened beverages was significantly associated with lower triglyceride levels, higher
HDL-C, and reduced IR.300
Triglycerides and Cardiovascular Disease
2309
11.2. Triglycerides as a Cardiovascular Risk
Factor in Women
The Framingham Heart Study was among the first observational studies to recognize elevated triglyceride level as a
predictor of CVD in women,301 and the Lipid Research
Clinics Follow-Up Study found a triglyceride level Ͼ200
mg/dL to be strongly predictive of cardiovascular death.302
Triglyceride level is also a significant predictor in older
women; in the Cardiovascular Study in the Elderly,303 a
12-year longitudinal epidemiological study among Italian
men and women Ն65 years of age at entry, women in the
highest triglyceride quintile had a 2.5- fold greater risk of
CVD mortality than women in the lowest quintile, even after
adjustment for preexisting CVD, T2DM, obesity, and alcohol
consumption. When low HDL-C was also present, risk
increased 3.8-fold. Current guidelines for CVD prevention in
women encourage fasting triglyceride levels Ͻ150 mg/dL
and non–HDL-C Ͻ130 mg/dL through TLC.304
11.2.1. Triglyceride Levels During the Lifespan in Women
Although higher triglyceride levels among female newborns
than among male newborns have been reported,305 triglyceride levels in girls and boys are generally similar during early
childhood. In adolescence, girls experience a decrease in
triglycerides, whereas boys experience an increase, likely due
to a greater degree of IR among males.306 Population-based
data in US adults indicate that compared with men triglyceride levels are lower in young and middle-aged females and
among non-Hispanic whites, blacks, and Mexican Americans; in contrast, older women have higher levels than men in
all ethnic groups.6 Mexican American women have the
highest triglyceride levels, whereas non-Hispanic white
women have intermediate levels, and black women have the
lowest levels.6 Triglyceride levels in the 1999 –2002
NHANES survey were higher than those documented in
earlier NHANES surveys in 1976 –1980 and 1988 –1994.
This increase occurred despite the fact that the use of
lipid-lowering medications among adult women Ն20 years of
age increased from 3.5% to 8% between the 1988 –1994 and
the 1999 –2002 surveys.6
11.2.2. Prevalence of Hypertriglyceridemia in Women
The prevalence of triglyceride levels Ն150 mg/dL has increased
among US women Ն20 years of age from 24.6% in 1988 –1994
to 29.9% in 1999 –2000,307 with stabilization at 26.8% (1999 –
2008; Table 2). Prevalence is highest among Mexican American
women, intermediate among non-Hispanic white women, and
lowest among black women,308,309 but data are lacking in other
Hispanic and non-Hispanic subgroups (Figure 2). Women who
develop DM experience a greater rise in triglyceride levels and
have an overall more adverse lipid profile than men who develop
DM.310
11.2.3. Hormonal Influences
Triglyceride levels in women are significantly impacted by
the endogenous hormonal environment and by exogenously
administered reproductive hormones. The impact of cyclic
hormonal fluctuations on lipoprotein levels during the menstrual cycle in premenopausal women is controversial.311
Downloaded from by guest on May 13, 2015
2310
Circulation
May 24, 2011
Recent studies have reported no change in basal VLDL
triglyceride and apo B100 kinetics312 and triglyceride levels,313
whereas other studies have shown small changes in triglyceride levels during the cycle but with overall coefficients of
variation similar to those of postmenopausal women and
men.314 These findings suggest that screening and risk assessment in premenopausal women can be performed without
standardization of lipoprotein measurements to the phase of
the menstrual cycle. Women with polycystic ovarian syndrome have higher triglyceride levels than women with
normal premenopausal physiology, even after correction for
BMI.315,316 This difference is present in women as young as
18 to 24 years of age and persists thereafter.315
Lipid metabolic effects of oral contraceptives vary on the
basis of their estrogen and progestin content.317,318 In the
CARDIA study (Coronary Artery Risk Development in
Young Adults), which did not distinguish between various
formulations, oral contraceptive users had higher triglyceride
levels than nonusers, despite their use being associated with
lower fasting glucose levels and reduced odds of DM.319
Higher triglyceride levels among oral contraceptive users
were also found in a population-based survey in Canada.320
Although most studies suggest increases in the 20% to 30%
range, triglyceride level increases of as much as 57% (and
decreases in LDL particle size) have been reported in some
populations.321
In pregnancy, women experience a “physiological hyperlipidemia” due to enhanced lipolytic activity in adipose
tissue, with Ͼ2-fold increases in circulating triglyceride
levels during the third trimester.109,110 As is the case in the
nonpregnant state, non-Hispanic black women have lower
triglyceride levels during pregnancy than their white counterparts.322 Although some studies find a hypertriglyceridemia-associated shift toward smaller, denser LDL particle
size,323,324 others have shown a shift toward larger, buoyant
LDL particles in late pregnancy.325 Both IR326 and hyperestrogenemia327 represent causative factors for the development or amplification of hypertriglyceridemia during pregnancy and may present a therapeutic challenge, especially
if pancreatitis develops.105 Maternal hypertriglyceridemia
in gestational DM also predicts babies that are large for
their gestational age.328 In contrast, endothelial function is
not adversely affected as a result of pregnancy-induced
hyperlipidemia.329
As women transition through menopause in middle age,
triglyceride levels increase, but it is not clear how much of
this increase is mediated by aging and accompanying lifestyle
changes (eg, reduced physical activity) versus a consequence
of menopausal hormonal transition.330 –334 In the Study of
Women’s Health Across the Nation (SWAN), the triglyceride
increase peaked during late perimenopause/early postmenopause. The magnitude of change attributable to aging was
similar to that associated with the menopausal transition; both
were substantially greater than changes directly attributable
to decreases in estradiol or increases in follicle stimulating
hormone.335
Orally administered exogenous estrogens increase triglyceride levels, whereas exogenously administered progestins
tend to ameliorate this estrogen-induced hypertriglyceridemia
to varying degrees depending on dose and type of progestin.336,337 Triglyceride levels vary substantially over time in
women who are receiving cyclic hormone regimens.338 It is
assumed, but not well documented, that the increase in
triglyceride levels induced by oral estrogens is enhanced
among women with preexisting hypertriglyceridemia; therefore, hypertriglyceridemia has often been an exclusionary
criteria in hormone-based RCTs.339,340 Triglyceride elevations are not usually observed with transdermally administered estrogens.337,341,342 Selective estrogen-receptor modulators have less impact on the lipid profile than oral hormone
therapy in the absence of hypertriglyceridemia with estrogen
therapy.121 Raloxifene, for example, increased triglyceride
levels by 8% in a 3-year study among healthy women but
only by 1.5% in the much larger Multiple Outcomes of
Raloxifene Evaluation trial, which included women with and
without CVD.343,344 Finally, tamoxifen has been reported to
cause marked elevation in triglyceride levels,124 with rare
reports of pancreatitis (Table 5).
11.3. Triglycerides in Ethnic Minorities
Populations from South Asia, including India, Pakistan, Sri
Lanka, Bangladesh, and Nepal, have an increased prevalence
of MetS and T2DM compared with Europeans.345 Several
factors have been suggested to explain the propensity of
South Asians to develop these metabolic risk factors for
CVD. For example, South Asians have increased fat compared with muscle tissue, with a more central distribution of
body fat, which has been attributed to the “adipose tissue
overflow hypothesis.”346 This often occurs without a sufficient increase in waist circumference that meets the criteria of
MetS as defined by ATP III, thereby resulting in a lower
threshold for abnormal waist circumference for South Asians
and several other ethnic groups; a BMI of 23 kg/m2 in South
Asians corresponds to a BMI of 25 kg/m2 in whites.347 Other
hypotheses include genetic or phenotypic adaptations of the
metabolism of South Asians to enable improved survival in
the face of inadequate caloric intake.345,346 In South Asians
and other minorities (eg, Mexican Americans, Native Hawaiians, and American Indians), MetS is uniformly accompanied
by an increase in atherogenic TRLs, thereby contributing to
increased CVD risk in these populations.
Studies in American Indians have provided valuable information with regard to the influence of MetS and T2DM on
triglyceride levels. Specifically, the Strong Heart Study, a
cross-sectional prospective observational study of 4600
American Indians,348 found a moderate elevation in triglyceride levels and a significantly increased prevalence of
T2DM to have contributed to incident CVD.349 Additional
data from the Strong Heart Study have identified non–HDL-C
as an important predictor of CVD in this subgroup.208
In contrast to ethnicities who have elevated levels of
triglycerides, non-Hispanic blacks often possess lower levels
of triglycerides; the mechanism for this inherent difference
may be increased LPL activity.350 A study of 185 blacks in
whom IR was documented by the euglycemic-hyperinsulinemic clamp procedure demonstrated mean triglyceride
levels (109 mg/dL) below the cut point for elevated triglyceride used in MetS, although they were higher than in the
Downloaded from by guest on May 13, 2015
Miller et al
insulin-sensitive cohort (mean 77 mg/dL).351 Thus, blacks
with MetS or T2DM may not possess high triglyceride levels
as commonly as observed in other ethnic groups, thereby
attenuating the predictive value of triglycerides or triglycerides-to-HDL ratios in this subgroup to identify IR.234,350,352
12. Classification of Hypertriglyceridemia
12.1. Defining Levels of Risk per the National
Cholesterol Education Program ATP Guidelines
As described in Section 2: Scope of the Problem, triglyceride
levels are classified as normal (Ͻ150 mg/dL), borderline high
(150 to 199 mg/dL), high (200 to 499 mg/dL), or very high
(Ն500 mg/dL) based on measurements after a 12-hour fast.
The most clinically relevant complication of hypertriglyceridemia is acute pancreatitis, yet only 10% of cases are a direct
consequence of triglyceride levels. Because documentation
for a specific threshold in triglyceride-induced pancreatitis is
lacking, levels associated with increased risk are arbitrarily
defined as triglyceride levels Ն1000 mg/dL105,353; however,
because only 20% of subjects presenting with these extremely
high levels develop pancreatitis,354 it is often difficult to
identify a high-risk subject on the basis of triglyceride levels
alone. Table 5 lists genetic and secondary causes (disorders of
metabolism, diet, drugs, and diseases that cause hypertriglyceridemia-induced pancreatitis91–95,105–131,355,356). Even when a
secondary cause is identified, family screening to uncover a
genetic lipid disorder is also in order.357 In addition to
pancreatitis, other potentially adverse clinical manifestations
of chylomicronemia include retinal thrombosis358 and, in rare
cases, blindness. Therefore, very high triglyceride levels
often require both therapeutic lifestyle change and pharmacological therapy as outlined in ATP III.10
Although borderline-high and high triglyceride levels (150
to 500 mg/dL) are not associated with pancreatitis, they are
correlated with atherogenic RLPs and apo CIII– enriched
particles.74 The elevations in triglyceride levels serve as a
biomarker for visceral adiposity, IR, DM, and nonalcoholic
hepatic steatosis (fatty liver).156,157,360 It is important to
recognize that individuals with values in this range may
remain at risk for pancreatitis, especially if they are placed on
triglyceride-lowering treatment for very high levels (ie, Ն500
mg/dL) and experience an exacerbation due to secondary
factors or interruption of treatment.
A low fasting triglyceride level (ie, Ͻ100 mg/dL) is
commonly found in underdeveloped societies and countries at
low CVD risk (eg, Africa, China, Greece, and Japan),361–373
as contrasted with the United States, where mean levels are
Ϸ15% to 30% higher.6 Consistent with a reduced likelihood
of abnormal metabolic parameters (eg, IR) are observational
studies and clinical trials3,232,367,374 –380 that have consistently
demonstrated the lowest risk of incident and recurrent CVD
in association with the lowest fasting triglyceride levels.
Taken together, these data raise the possibility that an optimal
fasting triglyceride level may be Ͻ100 mg/dL; similarly, an
optimal nonfasting triglyceride level may be Ͻ150 mg/dL
because of the Ͻ50% anticipated increase in ppTG levels
after a fat load (Section 10.3., Fasting Versus Nonfasting
Levels).
Triglycerides and Cardiovascular Disease
2311
An “optimal” triglyceride cut point is only intended to
define one physiological parameter of cardiometabolic health.
It does not represent a therapeutic target, because there is
insufficient evidence that lowering triglyceride levels improves CVD risk prediction beyond LDL-C and non–HDL-C
target goal recommendations. Nevertheless, the Ϸ25% rise in
triglyceride levels in US adults during the past several
decades6 that has coincided with higher caloric intake9 and
higher rates of juvenile obesity and T2DM8 is of great
concern. These developments have provided the impetus for
intensification of efforts aimed at therapeutic lifestyle change
to halt and potentially reverse an alarming trend that, if not
proactively addressed, may eradicate the considerable progress in CVD risk reduction that has been achieved in recent
years.381
13. Dietary Management
of Hypertriglyceridemia
13.1. Dietary and Weight-Losing Strategies
Nutrition measurements that affect triglyceride levels include
body weight status; body fat distribution (Section 5.2.,
Obesity and Sedentary Lifestyle); weight loss; the macronutrient profile of the diet, including type and amount of dietary
CHO and fat; and alcohol consumption. Importantly, multiple
interventions can yield additive triglyceride-lowering effects
that result in significant reductions in triglyceride levels. One
intervention is to eliminate dietary trans fatty acids, which
increase triglycerides and atherogenic lipoproteins (ie, lipoprotein[a], LDL-C)382 and are linked to increased cardiovascular risk.383 Although trans fatty acid consumption represents a small proportion of total caloric intake, certain food
products, such as bakery shortening and stick margarine,
contain high trans fatty acid concentrations (ie, 30% to 50%),
and each 1% replacement of trans fatty acids for monounsaturated fat (MUFA) or polyunsaturated fat (PUFA) lowers
triglyceride levels by Ϸ1%.384
13.1.1. Weight Status, Body Fat Distribution, and
Weight Loss
Weight loss has a beneficial effect on lipids and lipoproteins.385 A weight loss of 5% to 10% results in a 20%
decrease in triglycerides, approximately a 15% reduction in
LDL-C, and an 8% to 10% increase in HDL-C.386 The
magnitude of decrease in triglycerides is directly related to
the amount of weight loss.387 Meta-analyses have reported
that for every kilogram of weight loss, triglyceride levels
decrease Ϸ1.9%, or 1.5 mg/dL.388,389
13.2. Macronutrients
13.2.1. Total Fat, CHO, and Protein
The relationship between percent of total fat intake and
change in triglyceride and HDL-C concentrations was reported in a meta-analysis of 19 studies published by the
Institute of Medicine.390 In this analysis comparing low-fat,
high-CHO diets versus higher-fat diets, for every 5% decrease in total fat, triglyceride level was predicted to increase
by 6% and HDL-C to decrease by 2.2%. In a subsequent
meta-analysis of 30 controlled feeding studies in patients with
Downloaded from by guest on May 13, 2015
2312
Circulation
May 24, 2011
or without T2DM (nϭ1213), a moderate-fat diet (32.5% to
50% of calories from fat) versus a lower-fat diet (18% to 30%
of calories from fat) resulted in a decrease in triglyceride level
of 9.4 mg/dL (range from Ϫ6.1 to Ϫ12.2 mg/dL, PϽ0.00001)
in those without T2DM391; however, in those with T2DM, the
moderate-fat diet resulted in greater triglyceride reduction
(Ϫ24.8 mg/dL, PϽ0.05) than seen with the low-fat diet.391
Lastly, in a large meta-analysis of 60 controlled feeding
studies,392 replacement of any fatty acid class with a mixture
of dietary CHOs increased fasting triglyceride levels. Specifically, for each 1% isoenergetic replacement of CHOs,
decreases in triglyceride levels resulted with saturated fat
(SFA; 1.9 mg/dL), MUFA (1.7 mg/dL), or PUFA (2.3 mg/dL)
interchange (all PϽ0.001), which translated into an approximate 1% to 2% decrease in triglyceride levels.
The evidence statement from ATP III relative to dietary
CHOs conveyed the following message: “… [V]very high
intakes of carbohydrate (Ͼ60 percent of total calories) are
accompanied by a reduction in HDL cholesterol and a rise in
triglyceride …. These latter responses are sometimes reduced
when carbohydrate is consumed with viscous fiber …; however, it has not been demonstrated convincingly that viscous
fiber can fully negate the triglyceride-raising or HDLlowering actions of very high intakes of carbohydrates.”221
Accordingly, the recommendation by ATP III for dietary
CHO was, “Carbohydrate intakes should be limited to 60
percent of total calories. Lower intakes (eg, 50 percent of
calories) should be considered for persons with the metabolic
syndrome who have elevated triglycerides or low HDL
cholesterol.”221
As a follow-up to the recommendation from ATP III that
high-CHO diets be avoided in individuals with elevated
triglyceride levels, Berglund et al393 evaluated a high-CHO
(54% of calories) and low-fat (8% SFA) diet versus a
high-MUFA (37% of calories from fat; 22% MUFA, 8%
SFA) and average American (37% of calories from fat; 16%
SFA) diet in individuals with any combination of HDL-C
Յ30th percentile, triglyceride levels Ն70th percentile, or
insulin Ն70th percentile. Although triglyceride levels were
not affected by the MUFA diet compared with the average
American diet, they were higher on the CHO diet than with
either the average American diet or the MUFA diet (7.4% and
12%, respectively; PϽ0.01 for both).
Since ATP III, several large clinical trials have reported no
increase in triglycerides in response to a reduction in total fat
and a concurrent increase in dietary CHOs. In the DASH
(Dietary Approaches to Stop Hypertension) trial, the effects
of 3 dietary patterns on blood pressure, lipids, and lipoproteins were evaluated.394,395 DASH emphasizes fruits and
vegetables (8 to 10 servings per day) and low-fat dairy
products (2 to 3 servings per day), including whole grains,
legumes, fish, and poultry, and limits added sugars and fats.
The DASH diet is high in dietary fiber (Ϸ30 g/d) and
provides 27% of calories from total fat, Ͻ7% of total calories
from SFA, 150 mg of cholesterol per day, and 18% of calories
from protein. In the DASH study, 436 adults with mildly
elevated blood pressure (systolic blood pressure
Ͻ160 mm Hg and diastolic blood pressure 80 to 95mm Hg)
were randomized to consume either a Western diet (control
diet; 48% CHO, 15% protein, 37% total fat, 16% SFA), a
fruits and vegetables diet (which provided more fruits and
vegetables and fewer snacks and sweets than the control diet
but otherwise had a similar macronutrient distribution), or the
DASH diet for 8 weeks. Compared with a Western diet, the
DASH diet reduced TC (Ϫ9.5%), LDL-C (Ϫ9.1%), and
HDL-C (Ϫ9.2%) but did not adversely affect triglycerides.
TC, LDL-C, HDL-C, and triglyceride levels did not change
with the fruits and vegetables diet.
In the OmniHeart (Optimal Macronutrient Intake) Trial,
the effects of substituting SFA with CHO, protein, or unsaturated fat were evaluated in a 3-period, 6-week crossover
feeding study that involved 164 prehypertensive or stage 1
hypertensive subjects.396 Each diet period emphasized 1
macronutrient: High CHO (58% of total calories), moderate/
high protein (25% of total calories, 50% of which were from
plant proteins), or high unsaturated fat (37% of total calories,
of which 21% came from MUFA and 10% from PUFA). All
test diets provided 6% of calories from SFA and were high in
dietary fiber (Ͼ30 g/d). Compared with baseline levels,
triglyceride levels decreased significantly after the highunsaturated-fat and high-protein diets (Ϫ9.3 and Ϫ16.4
mg/dL, respectively) but not after the high-CHO diet (increase of 0.1 mg/dL). Another major clinical trial, the
Women’s Health Initiative (WHI) Dietary Modification Trial
of 48 835 postmenopausal women, found no differences in
triglyceride levels (142 versus 145 mg/dL) between the
low-fat dietary intervention and a higher-fat comparator
group after 3 years of follow-up.397 Thus, although many
studies of high-CHO diets have shown increases in triglyceride levels, others (eg, DASH, OmniHeart, and WHI) have
shown no effect. This discrepancy may reflect higher fiber
intake (Ϸ30 g/d; DASH, OmniHeart), higher protein intake
(Ͼ15% of energy; DASH, OmniHeart, WHI), or a combined
effect. Notably, the dietary patterns in DASH, OmniHeart,
and WHI were high in fruits and vegetables, as well as grains
(including whole grains). Results also suggest that moderate
intake of predominately unsaturated fat (30% to 35% of
energy or more) and plant-based proteins (17% to 25% of
energy) may produce a triglyceride-lowering effect.
13.2.2. Mediterranean-Style Dietary Pattern
Epidemiological and clinical trial evidence suggests that the
Mediterranean-style dietary pattern398,399 is associated with
decreased triglyceride levels. In the Framingham Heart Study
Offspring Cohort (nϭ2730), subjects in the highest quintile
for Mediterranean-style dietary pattern score had the lowest
triglyceride levels (103 versus 114 mg/dL, PϽ0.001) over a
7-year follow-up.398 Several clinical trials have reported
beneficial effects of a Mediterranean-style diet on triglycerides compared with a lower-fat diet. Esposito et al400 compared the effects of a Mediterranean-style diet with a control
diet over a 2-year period on markers of CVD risk in patients
(nϭ180) with MetS. The Mediterranean-style diet comprised
more foods rich in MUFA, PUFA, and dietary fiber. Total
fruit, vegetables, nuts, whole grains, and olive oil were higher
in the intervention group. The intervention diet provided 28%
of calories from total fat, with 8%, 12%, and 8% of calories
from SFA, MUFA, and PUFA, respectively. The control diet
Downloaded from by guest on May 13, 2015
Miller et al
provided 30% of calories from total fat, with 14%, 10%, and
7% of calories from SFA, MUFA, and PUFA, respectively.
After 2 years, triglyceride levels decreased 12% in the
intervention group (Pϭ0.001 versus the control diet). In
addition, subjects on the intervention diet decreased body
weight by 6.2 lb or 2.8 kg (PϽ0.001) and waist circumference by 0.8 inches or 2 cm (Pϭ0.01) compared with the
control group. Similarly, reduced triglyceride levels were
reported in the Mediterranean Diet, Cardiovascular Risks and
Gene Polymorphisms (Medi-RIVAGE) Study.401 Finally, the
PREDIMED (Prevencio´n con Dieta Mediterra´nea) Study
evaluated the effects of a Mediterranean diet plus virgin olive
oil (1 L per week) and a Mediterranean diet plus mixed nuts
(30 g/d; walnuts, hazelnuts, and almonds) versus a low-fat
diet (control diet) in subjects (nϭ1224) at increased risk for
CVD.402 Both Mediterranean-style diets provided higher energy
intake from fat than the control diet (41% to 43% versus 38% of
calories) and were higher in MUFA content (21% to 22% versus
19.4% of calories). After 1 year, hypertriglyceridemia was less
prevalent in both Mediterranean-style diet groups (12.3% and
13.6%) than in those eating the control diet (21.3%). With few
exceptions, such as the Lyon Diet Heart Study,403 which found
no significant change in triglyceride levels on a MUFA-enriched
versus low-fat, high-n-6 PUFA diet, implementation of a
Mediterranean-style diet versus a low-fat diet is more commonly
associated with an approximately 10% to 15% lowering of
triglycerides and a reduced prevalence of hypertriglyceridemia.
13.3. Type of Dietary CHO
13.3.1. Dietary Fiber
The role of fiber in CVD risk has been reviewed by Erkkila
and Lichtenstein,404 and the evidence specifically for associations or effects on triglycerides is limited, especially in the
absence of T2DM. In contrast, data exist related to fiber
intake and triglycerides in individuals with or at increased
risk for T2DM. The Botnia Dietary Study, a population study
of 248 male and 304 female adult nondiabetic relatives of
patients with T2DM from West Finland, reported an inverse
association between serum triglycerides and total dietary
fiber, water-insoluble fiber, and water-soluble fiber.405 Anderson et al406 conducted meta-analyses of T2DM to evaluate
the lipid, lipoprotein, and glycemic effects of diets low (Ͻ10
g/1000 kcal) or high (Ͼ20 g/1000 kcal) in dietary fiber and
with moderate (30% to 59.9% of energy) or high (Ͼ60% of
energy) CHO intake. In 7 studies (nϭ98) that compared
moderate CHO and high fiber versus moderate CHO and low
fiber, triglyceride levels decreased by 8% in the high-fiber
groups. Similarly, in 9 studies (nϭ119) that compared high
CHO and high fiber versus moderate CHO and low fiber,
triglyceride levels decreased 13% in the high-fiber group.
Therefore, these data support a triglyceride-lowering effect
for dietary fiber in individuals with T2DM.
13.3.2. Added Sugars
Consumption of added sugars has increased markedly in the
United States from 1977–1978, when it was 10.6% of
calories, to the current intake of 15.8% of calories.407,408 The
American Heart Association recommends limiting added
Triglycerides and Cardiovascular Disease
2313
sugars to fewer than 100 calories daily (ie, 6 tsp) for women
and 150 calories daily (9 tsp) for men (Ϸ5% of total energy).9
The association of added sugars with increased obesity,
T2DM, dental carries, and decreased diet quality is evident,
which is part of the evidence base for recommendations made
by other organizations to limit added sugars.409,410 Recently,
the association between added sugars and lipid measures was
evaluated in a cross-sectional study of US adults (nϭ6113)
that used NHANES 1999 –2006 data.408 The lowest triglyceride levels were observed when added sugar represented
Ͻ10% of total energy. Conversely, higher triglyceride levels
(5% to 10%) were observed when added sugar represented a
greater proportion of energy intake.
13.3.3. Glycemic Index/Load
The glycemic index (GI) is defined as the ratio of the blood
glucose response to a specific food and the glucose response
to a standard food (ie, white bread). By comparison, the
glycemic load (GL) of a food is calculated by multiplying the
GI by CHO intake (in grams) and dividing by 100. In general,
most refined starchy foods in the American diet have a high
GI, whereas nonstarchy vegetables, fruit, and legumes typically have a low GI.
The role of GI and GL in CVD risk assessment remains
controversial.411– 413 Two epidemiological studies, the
Nurses’ Health Study and the Women’s Health Study, reported a positive association between GL and/or GI and
fasting triglyceride levels.414,415 A positive correlation between GI/GL and triglyceride levels was also reported in a
cohort of Japanese women.416 In terms of race/ethnicity, GL
was positively associated with triglyceride levels in whites
but not in blacks or Hispanics.417 In an elderly population,
however, there was no association between GI and triglyceride levels.418 Other studies have reported mixed results. For
example, the Insulin Resistance Atherosclerosis Study419
found GL but not GI to be positively associated with
triglycerides, whereas in the Whitehall II Study, GI but not
GL correlated with triglyceride levels.420 A Cochrane review
of 15 RCTs from 1982 to 2003 assessing the relationship
between low-GI diets and lipids found no evidence that
low-GI diets affected plasma triglycerides421; however, 2
subsequent studies reported lower triglyceride levels with
low-GI diets.422,423 The relationship between GI/GL and
triglycerides also remains unresolved in patients with T2DM,
with 1 meta-analysis having identified a 6% reduction in
triglyceride level in low- versus high-GI diets406 but another
study finding no appreciable differences in triglyceride levels
in 162 subjects with T2DM assigned to a low- or high-GI
diet.424
13.3.4. Fructose
Americans consume fructose in large quantities (up to 150
g/d). Fructose enhances lipogenesis and triglyceride synthesis. In contrast to glucose metabolism, which is regulated in
part by phosphofructokinase, fructose metabolism is relatively unregulated.425 In the past 4 decades, fructose consumption has increased appreciably because it is used in
many beverages and foods sweetened with sucrose or “table
sugar,” the content of which is 50% fructose, or high-fructose
Downloaded from by guest on May 13, 2015
2314
Circulation
May 24, 2011
Table 9. Fructose Content in Selected Foods and Beverages
From the USDA Nutrient Database*
Item
Amount, g
Cola with HFCS (12 oz)
22.5
Lemon-lime soda with HFCS (12 oz)
21.7
Ginger ale with HFCS (12 oz)
13.5
Raisins, seedless (1.5-oz box)
13
Power bar (chocolate)
10.9
Agave nectar (tbsp)†
8.9
Honey (tbsp)
8.6
Applesauce, sweetened (3.5 oz)
Fruit (apple, pear)
8
4–10
Molasses (tbsp)
2.6
Table sugar (tsp)
2
USDA indicates US Department of Agriculture; HFCS, high-fructose corn
syrup; tbsp, tablespoon; and tsp, teaspoon.
*Available at and derived
from the Association of Official Analytical Chemists method of analysis
( />sr23_doc.pdf).
†Data obtained from Patzold and Bruckner.429
corn syrup, which comprises 42% to 55% fructose.426 Recent
data suggest that dietary supplementation with fructose increases ppTG and CMRs compared with glucose.427 In an
extensive meta-analysis of 60 studies that evaluated the
effects of fructose consumption on triglyceride levels, intakes
Յ100 g/d had no significant effects on fasting plasma
triglycerides. The lack of effect was demonstrated irrespective of whether fructose replaced starch, sucrose, or glucose.
In contrast, intakes of fructose that exceeded 100 g/d revealed
a dose-related increase in plasma triglycerides.428 Similarly,
in the 12 studies that monitored ppTG, a dose-dependent
increase was observed above the 50-g fructose dose.428 These
data support limiting fructose in men and women with
borderline or elevated triglyceride levels (Figure 5). A list of
fructose-containing products is provided in Table 9.
Mechanistically, high CHO intake triggers pancreatic insulin release in response to increased blood glucose. Insulin,
in turn, activates sterol regulatory element– binding protein,
(SREBP-1c), a transcription factor that regulates fatty acid
and triglyceride synthesis.430 Recently, 2 additional transcription factors, X-box binding protein 1 (XBP1) and CHO
response element– binding protein (ChREBP), have been
identified as inducers of hepatic lipogenesis in response to
ingested CHOs (eg, fructose and glucose) that is independent
of insulin.431,432 In contrast, unsaturated fatty acids reduce or
inhibit SREBP-1c transcription, thereby reducing hepatic
fatty acid synthesis430 and plasma triglycerides.
13.4. Weight Loss and Macronutrient Profile of
the Diet
Historically, there has been an interest in evaluating the effect
of the macronutrient profile of the diet on weight loss and
accompanying effects on lipids and lipoproteins. The Preventing Obesity Using Novel Dietary Strategies (POUNDS
LOST) trial evaluated 4 weight loss diets that varied in
macronutrient composition.433 After 2 years, weight loss was
similar in participants assigned to low and high protein (15%
versus 25%), low and high fat (20% versus 40%), or low and
high CHO (65% versus 35%). Irrespective of macronutrient
composition, all diets decreased triglyceride levels similarly
(12% to 17%).433 Another popular weight loss alternative is a
very low-CHO diet, defined as intake of Ͻ35 g of CHO per
day.434 A meta-analysis of RCTs that evaluated low-CHO
versus low-fat (Ͻ30% of energy) diets found greater reductions in triglyceride levels on the low-CHO diet.435 Consistent
with these findings, Bonow and Eckel434 concluded that
low-CHO diets produced a more robust triglyceride-lowering
effect than low-fat diets despite a similar magnitude of weight
loss after 1 year.
The effect of a reduced-fat weight loss diet intervention
was also evaluated in the Diabetes Prevention Program, a
program comparing the effects of intensive therapeutic lifestyle change versus metformin on the development of T2DM
in patients with impaired glucose tolerance. After 2.8 years,
the intensively treated group lost weight (mean 5.6 kg) in
association with a reduction in triglyceride levels (22 mg/
dL).436 Another analysis of the Diabetes Prevention Program
that evaluated subjects with MetS reported a downward shift
in the prevalence of triglyceride levels Ն150 mg/dL from
73% to 60% in the intensive-lifestyle versus placebo
group.437 Similar results were reported in the Look AHEAD
(Action for Health in Diabetes) Trial,438 in which weight
reduction also translated into appreciable triglyceride lowering. The effects of a Mediterranean-style weight loss diet
were compared with low-CHO and low-fat energy-restricted
diets.439 After 6 months, triglyceride levels were reduced the
most in the low-CHO group (22%), but after 12 months,
similar reductions were observed in both the low-CHO and
Mediterranean-style groups, with minimal change in the
low-fat group. Two additional studies evaluated 4 popular
weight loss diets440,441 in free-living subjects for 1 year.
Dansinger et al440 studied the effects of the Atkins diet, the
Zone diet, the Weight Watchers diet, and the very low-fat
Ornish diet on weight loss and CVD risk factors. Weight loss
was similar after 12 months (4.8 to 7.3 kg) for all 4 diets.
Although significant reductions in triglycerides occurred after
2 months on the Atkins and Zone diets, these effects were no
longer significant after 12 months. In the study by Gardner et
al,441 which compared the Atkins, Zone, LEARN (Lifestyle,
Exercise, Attitudes, Relationships, and Nutrition) and Ornish
diets, weight loss was greatest on the Atkins diet (4.7 kg)
followed by LEARN (2.6 kg), Ornish (2.2 kg), and Zone (1.6
kg), with corresponding reductions in triglyceride levels (3%
to 23%). Thus, diets that produce significant and sustained
weight loss offer the most favorable reductions in triglyceride
levels.
13.5. Alcohol
Prospective studies have demonstrated an inverse relationship
between moderate alcohol consumption (ie, up to 1 oz daily)
and CVD.442 In evaluating the relationship between alcohol
consumption and triglycerides, some studies have shown no
association,443– 445 whereas others found modestly lower triglyceride levels in women who consumed up to 0.6 oz
Downloaded from by guest on May 13, 2015
Miller et al
daily.446 At higher intakes, triglyceride levels increase,447,448
and Rimm et al449 estimated that ingestion of 1 oz/d would
correspond to a 5% to 10% higher triglyceride concentration
than found in nondrinkers.
In contrast, alcohol abuse may be associated with hypertriglyceridemia; nearly 1 in 5 hospitalized alcoholics have
triglyceride levels exceeding 250 mg/dL.450 An exaggerated
rise in triglycerides occurs in the setting of excess alcohol
intake combined with a meal high in saturated fat. Ethanolinduced lipemia may be due to inhibition of LPL-mediated
hydrolysis of chylomicrons.126,451,452 Therefore, in subjects
with very high triglyceride levels, complete abstinence is
strongly recommended in concert with reduced saturated fat
intake to reduce the likelihood of pancreatitis.105
13.6. Marine-Derived Omega-3 PUFA
The American Heart Association recommends 2 to 4 g of
eicosapentaenoic acid (EPA) plus docosahexaenoic acid
(DHA) per day, provided as capsules under a physician’s
care, for patients who need to lower their triglyceride level.453
This recommendation is based on a large body of evidence
showing triglyceride-lowering effects of marine-derived
omega-3 PUFA. In a comprehensive review of human studies, Harris454 reported that Ϸ4 g of marine-derived omega-3
PUFA per day decreased serum triglyceride concentrations
by 25% to 30%, with accompanying increases of 5% to 10%
in LDL-C and 1% to 3% in HDL-C. A dose-response
relationship exists between marine-derived omega-3 PUFA
and triglyceride lowering, with an approximate 5% to 10%
reduction in triglycerides for every 1 g of EPA/DHA consumed455; efficacy is greater in individuals with higher
triglyceride levels before treatment.455– 457 Skulas-Ray et al458
reviewed studies that evaluated baseline triglyceride levels
and the response to EPA plus DHA dose and found that the
response was curvilinear, with individuals at lower baseline
triglyceride levels having less of a triglyceride-lowering
effect (Ϸ20% versus 30% for higher triglyceride levels).
Mechanistically, decreased VLDL triglyceride secretion
results from preferential shunting of omega-3 PUFA into
phospholipid cellular synthesis, reduced expression of
SREBP-1, and enhanced peroxisomal -oxidation. In addition, upregulation of LPL facilitates VLDL triglyceride clearance.459,460 Individually, EPA or DHA may reduce triglyceride,461 ppTG,462 or CMR463 levels. However, marine-derived
dietary sources contain both EPA and DHA in varying
proportions. Table 10 lists foods enriched in marine-derived
omega-3 PUFA. Because the amount needed for significant
triglyceride lowering (2 to 4 g) is difficult to attain through
diet alone on a daily basis, supplementation with capsules
may be needed. The content of EPA/DHA per capsule is
highly variable and ranges from 300 mg to Ϸ850 mg.
Although marine-derived omega-3 PUFA capsules have been
shown to be free of contaminants, their clinical efficacy at
high doses (2 to 4 g/d) has yet to be established. Therefore, a
well-designed RCT will be important to determine the extent
to which triglyceride and non–HDL-C lowering through
supplementation with marine-derived omega-3 PUFA improves CVD outcomes beyond standard-of-care therapy.
Triglycerides and Cardiovascular Disease
2315
Table 10. EPA/DHA Content in Selected Foods (per 3.5-oz Serving)
Fish
Omega-3 PUFA, g
Anchovy (canned)
2.1
Herring, Atlantic (kippered)
2.1
Salmon, Atlantic (farmed)
2.1
Salmon, Atlantic (wild)
1.8
Herring, Atlantic (pickled)
1.4
Sardines, canned in tomato sauce
1.4
Salmon, coho
1.3
Trout, rainbow (farmed)
1.2
Halibut, Greenland
1.2
Salmon, sockeye
1.2
Salmon, pink or red (canned)
1.1
Sardines, canned in oil
1.0
Trout, rainbow (wild)
1.0
Tuna, white (canned in water)
0.9
Halibut, Atlantic or Pacific
0.5
Crabs
0.5
Lobster
0.5
Salmon, smoked (lox)
0.5
Shrimp
0.5
Tuna, light (canned in water)
0.3
Tuna, white (canned in oil)
0.2
EPA indicates eicosapentaenoic acid; DHA, docosahexaenoic acid; and PUFA,
polyunsaturated fatty acid.
13.7. Nonmarine Omega-3 PUFA
Dietary marine-derived omega-3 PUFA intake is very low, at
Ͻ0.2 g of the Ϸ1.4 g of total omega-3 PUFA consumed daily
in the United States.464,465 Non–marine-based omega-3 PUFA
is derived from ␣-linolenic acid, a plant-based PUFA found
in canola, chia, flaxseed, perilla, rapeseed, soybeans, walnuts,
and purslane.465,466 Yet non–marine-based PUFAs have not
demonstrated consistent reductions in triglycerides467; this
may reflect very low conversion rates of ␣-linolenic acid and
its intermediary, stearidonic acid,468 to the active triglyceride-lowering omega-3 compounds EPA and DHA.469 Therefore, if omega 3 PUFAs are used for triglyceride lowering,
they should be exclusively marine-derived EPA and/or DHA.
13.8. Dietary Summary
Overall, optimization of nutrition-related practices can result
in a marked triglyceride-lowering effect that ranges between
20% and 50%. These practices include weight loss, reducing
simple CHO at the expense of increasing dietary fiber,
eliminating industrial-produced trans fatty acids, restricting
fructose and SFA, implementing a Mediterranean-style diet,
and consuming marine-derived omega-3 PUFA (Table 11).
Dietary practices or factors that are associated with elevated
triglyceride levels include excess body weight, especially
visceral adiposity; simple CHOs, including added sugars and
fructose; a high glycemic load; and alcohol.
14. Physical Activity and
Hypertriglyceridemia
The high triglyceride levels observed with sedentary living,
high SFA intake, visceral obesity, and IR commonly are
Downloaded from by guest on May 13, 2015
2316
Circulation
May 24, 2011
Table 11. Effects of Nutrition Practices on Triglyceride Lowering
Nutrition Practice
TG-Lowering Response, %
Weight loss (5% to 10% of body weight)
Implement a Mediterranean-style diet vs a
low-fat diet
Add marine-derived PUFA (EPA/DHA) (per gram)
20
10–15
5–10
Decrease carbohydrates
1% Energy replacement with MUFA/PUFA
1–2
Eliminate trans fats
Table 12. Effect of Lipid-Lowering Therapies on
Triglyceride Reduction504,480a– 480d
Drug
Fibrates
30 –50
Immediate-release niacin
20–50
Omega-3
20–50
Extended-release niacin
10–30
Statins
10–30
Ezetimibe
1% Energy replacement with MUFA/PUFA
% Triglyceride Reduction
5–10
1
TG indicates triglyceride; PUFA, polyunsaturated fatty acid; EPA, eicosapentaenoic acid; DHA, docosahexaenoic acid; and MUFA, monounsaturated fatty
acid.
accompanied by an increased content of intramyocellular
triglyceride that largely reflects ineffective utilization of fat
(ie, reduced muscle fatty acid oxidation).470 – 472 In contrast,
aerobic activity enhances lipid oxidation, thereby facilitating
the hydrolysis and utilization of triglycerides in skeletal
muscle.473 The effect of physical activity on triglyceride
levels varies depending on baseline triglyceride, level of
intensity, caloric expenditure, and duration of activity. For
example, an optimal fasting triglyceride level (eg, Ͻ100
mg/dL) was associated with minimal (ie, Ͻ5%) reductions in
postexercise triglyceride levels compared with greater (ie,
15% to 20%) reductions if baseline triglyceride levels exceeded 150 mg/dL.474 Moreover, in a study of 2906 middleaged men, moderately intensive activity (ie, jogging 10 miles
weekly) versus no activity was associated with a 20% lower
fasting triglyceride level; the highest activity level (Ͼ20
miles weekly) was also accompanied by the lowest mean
fasting triglyceride level (86 mg/dL).475 Higher baseline
triglyceride levels (mean 197 mg/dL) also translated into
significant triglyceride reductions (26%) in a 6-month trial of
overweight subjects who walked 12 miles weekly at 40% to
55% of peak oxygen consumption.476 However, other studies
evaluating walking duration, frequency, and intensity (30
minutes daily at a maximum 65% to 75% of age-predicted
heart rate) in the absence of weight loss did not demonstrate
differences in postexercise triglyceride levels.477 Similarly,
increasing energy expenditure through physical activity without changing energy intake did not result in lower triglyceride
levels if baseline levels were relatively normal (ie, mean 110
mg/dL). However, a reduction in energy intake (300 kcal/d)
resulted in a 23% reduction in fasting triglyceride levels
during the 1-year trial.478 Additional benefits of exercise
include reduction in the ppTG response and attenuation of the
triglyceride elevations observed after consumption of a lowfat, high-CHO diet.479 In fact, 60 minutes of aerobic exercise
daily abolishes the CHO-induced increases in TRL.480 Overall, exercise is most effective in lowering triglycerides (eg,
20% to 30%) when baseline levels are elevated (ie, Ͼ150
mg/dL), activity is moderate to intensive, and total caloric
intake is reduced.481
15. Pharmacological Therapy in Patients With
Elevated Triglyceride Levels
The association of elevated triglycerides with increased CVD
risk and clustered metabolic abnormalities (as discussed in
other sections of this scientific statement) has led to research
and clinical interest in the potential protective benefit of
reducing high levels of triglycerides. Although no published
clinical trials have been designed specifically to examine the
effect of triglyceride reduction on CVD event rate, secondary
analyses from major trials of lipid-regulating therapy have
assessed CVD risk in subgroups with high triglyceride levels.
Unfortunately, most clinical trials limited entry triglyceride
level to Ͻ400 mg/dL, and no known triglyceride-specific data
from trials of diet and other lifestyle modifications are
available. With the noted limitations of the published trial
data, we attempt to address the following 3 questions:
1. Do patients with elevated triglyceride levels at baseline
benefit from pharmacological monotherapy?
The triglyceride-lowering effects of lipid-altering agents are
shown in Table 12. As monotherapy, fibrates offer the most
triglyceride reduction, followed by immediate-release niacin,
omega-3 methyl esters, extended-release niacin, statins, and
ezetimibe. In contrast, bile acid resins may raise triglyceride
levels (Table 5). A number of trials of statin or fibrate monotherapy have examined the potential role of baseline triglyceride
level, categorized by various criteria (eg, cut points, MetS,
combined with low HDL-C), on CVD risk. To date, similar
analyses are not available for ezetimibe or niacin. In statin
trials, subgroups with increased baseline triglyceride levels
were reported to have increased CVD risk in the Scandinavian Simvastatin Survival Study (4S),40,482,483 the Cholesterol
and Recurrent Events (CARE) Trial,484 the West of Scotland
Coronary Prevention Study (WOSCOPS),485 the Air Force/
Texas Coronary Atherosclerosis Prevention Study (AFCAPS/
TexCAPS),482 and the Treating to New Targets (TNT)
study486 and to have greater CVD risk reduction with lipid
therapy in 4S482,483 and CARE.487 However, CVD event
reductions were similar across categories of baseline triglycerides in the Long-Term Intervention with Pravastatin in
Ischemic Disease (LIPID),488 the Heart Protection Study,489
and WOSCOPS,490 and CVD event reduction was greater in
patients without MetS in the Anglo-Scandinavian Cardiac
Outcome Trial.491 Thus, in patients with hypertriglyceridemia, statin therapy may be beneficial in the setting of an
LDL-C level that merits treatment.
Although statins have consistently shown benefit in subgroups with or without high triglyceride levels, fibrates have
more commonly been shown to provide greater benefit in
subgroups with increased triglyceride levels. These high-cardiovascular-risk subgroups benefited in the Helsinki Heart
Downloaded from by guest on May 13, 2015