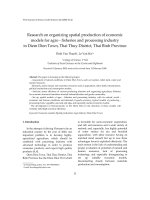
Validation of simulation software for NDE applications in utility industry
Bạn đang xem bản rút gọn của tài liệu. Xem và tải ngay bản đầy đủ của tài liệu tại đây (2.16 MB, 30 trang )
Validation of simulation software for
NDE applications in utility industry
Thiago Seuaciuc-Osorio, George Connolly, Feng Yu and Mark Dennis
Electric Power Research Institute
The 5th International CANDU In-Service Inspection Workshop
in conjunction with the NDT in Canada 2014 Conference
June 16-18, 2014
Eaton Chelsea Hotel
Toronto, ON (Canada)
Outline
• Background
• NDE Simulation Software: CIVA
• Validation of CIVA Simulation Results
• Summary
© 2014 Electric Power Research Institute, Inc. All rights reserved.
2
Our History…
• Founded by and for the electricity
i d t iin 1973
industry
• Independent, nonprofit center for
public interest energy and
environmental research
• Collaborative resource for the
electricity sector
• Major
j offices in Palo Alto,, CA;;
Charlotte, NC; Knoxville, TN
– Laboratories in Knoxville,
Charlotte and Lenox
Lenox, MA
© 2014 Electric Power Research Institute, Inc. All rights reserved.
Chauncey Starr
EPRI Founder
3
Our Members…
• 450+ participants in more than 40
countries
ti
• EPRI members generate more
than 90% of the electricity in the
United States
• International funding of more than
15% of EPRI’s research,
development and demonstrations
• Programs funded by more than
1,000 energy organizations
© 2014 Electric Power Research Institute, Inc. All rights reserved.
4
Challenges & Opportunities Associated with
NDE Modeling &Simulation
• Increasing scope of NDE
– Long Term Operation/License renewal
– Buried piping; Concrete, etc.
• Ph
Physical
i ld
demonstrations
t ti
off NDE ttechniques
h i
are
increasingly expensive.
• Modeling can be used as a training tool for new work
force.
• Theoretical justification through modeling is considered
as a possible acceptable way of meeting the regulatory
requirements.
NDE simulation codes must be validated against experimental data to determine their suitability for
industrial application!
© 2014 Electric Power Research Institute, Inc. All rights reserved.
5
CIVA: Software Dedicated to NDE Simulation
– Developed by Commissariat à l’Energie Atomique (CEA), France
– Multiple techniques and modules
• UT : Ult
Ultrasound
d
• RT : X Rays
• ET : Eddy Currents
processing data reconstruction
reconstruction…))
• Analysis tool (signal processing,
– Generic Simulation Procedure of ET
• Specimen
• Probe
• Inspection
• Flaws
• Acquisition
A
i iti
• Run
• Analysis
© 2014 Electric Power Research Institute, Inc. All rights reserved.
6
Off-axis Detection
• This study observes detection of reflectors away from the central
axis of ultrasonic beam (skewing)
• A circular 0.5” 2.25MHz conventional probe is used; scanning
performed
f
d using
i ttransverse waves att 45° (steel)
( t l) via
i a plexiglass
l i l
wedge
GE SE1057
• Data collected by Zetec Omniscan MX 16-128
– controlling software: Zetec Ultravision 1.2R7
• ATCO LPS-1000 encoder used for motion control along
g two axes
© 2014 Electric Power Research Institute, Inc. All rights reserved.
7
Experimental Apparatus
• A 304 SS reference block is used for experimentation and simulation
– Overall dimensions 101.6mm×76.2mm×304.8mm (H×D×W)
– Nine side-drilled holes as reflectors (Ø1.5875mm), ranging in depth from
6.35mm to 88.90mm (the ninth is not used)
– Side-drilled holes are not though-holes; they are drilled ⅔ of the way
through
– x is the scan direction and y is the index direction
© 2014 Electric Power Research Institute, Inc. All rights reserved.
8
Experimental Procedure
• Calibration for wedge delay, exit point from
wedge front and shear wave velocity
• Raster scanning
g is p
performed in 1mm steps
p
in both scan (x) and index (y) directions
– Five different skew angles are used,
varying from 135° to 195°
– two cases are shown here: 150°
150 and
195°
150° positive skew
© 2014 Electric Power Research Institute, Inc. All rights reserved.
index
scan
195° negative skew
9
Comparison at 150° Positive Skew
• CIVA simulations are run in “Direct” mode; no reflections nor mode conversions are
included
– cumulated side views:
150°
150°
3
4
1
2
3
4
5
5
6
6
7
7
8
SIM
EXP
CUMULATED SIDE VIEW
CUMULATED SIDE VIEW
• Comparison is favorable; third through seventh SDHs detected experimentally
• Differences
– first two SDHs are not detected experimentally but are strongly present in the simulation
– CIVA predicting response along the length of the hole (was also the problem at the
negative skew) instead of only at the corner
© 2014 Electric Power Research Institute, Inc. All rights reserved.
10
Comparison at 195° Negative Skew
• Cumulated side views:
195°
195°
1
2
3
4
5
6
7
8
EXP
• No SDH is detected experimentally; though there are blurred indications
for upper SDHs
• Simulated data show strong detection of every SDH
•S
Simulated results need further
f
investigation to determine the reason for
f
these signals
© 2014 Electric Power Research Institute, Inc. All rights reserved.
SIM
CUMULATED SIDE VIEW
CUMULATED SIDE VIEW
11
Notched Block
• Notched block is modelled as homogeneous isotropic steel
– Dimensions: 255.6mm×152.4mm×25.298mm (10”×6”×1”)
– Notches
N t h vary ffrom 1.27mm
1 27
(5% TWT/TWE) to
t 22.86mm
22 86
(90%
TWT/TWE) in height from back surface
• Probe is 0.5” 1.5MHz transverse; wedge at 45°
10
5
9
4
SHALLOW NOTCHES
8
3
DEEP NOTCHES
© 2014 Electric Power Research Institute, Inc. All rights reserved.
12
7
2
6
1
Experimental and Simulated Results
• (top) cumulated VC top view, filtered
by time to remove backwall reflections
and (bottom) cumulated VC side view
• CIVA simulations performed using
single contact element at 1.5 MHz
– Si
Simulated
l t d scan performed
f
d iin 8 rows (15
mm apart); in each row, 456 data are
collected (0.5 mm apart)
• Responses from notches 1, 9 and 10
not discernible due to interference
6
5
7
4
8
3
6
5
7
4
8
3
2
2
EXP
SIM
CUMULATED TOP VIEW
CUMULATED TOP VIEW
CUMULATED SIDE VIEW
EXP
6
7
8
© 2014 Electric Power Research Institute, Inc. All rights reserved.
1
CUMULATED SIDE VIEW
2
3
4
SIM
5
6
7
8
13
1
2
3
4
5
Comparison Summary
• Normalized echodynamic curves of cumulated top view normalized
by (left) amplitude of response from second notch and (right)
amplitude of response from sixth notch
– Simulation tends to overestimate amplitudes of subsequent
notches
DEEP NOTCHES SHALLOW NOTCHES
2
3
4
5
6
7
8
© 2014 Electric Power Research Institute, Inc. All rights reserved.
14
Comparison Summary
• Comparison of measured and actual depths of notches
– Both simulation and experiment tend to overestimate notch
depth i.e., the notch TWT/TWE is slightly underestimated
– Error slightly worsens for shallowest notches
7
5
6
6
5
4
2
3
2
© 2014 Electric Power Research Institute, Inc. All rights reserved.
15
3
4
7
Austenitic Stainless Steel Piping Sample
• Piping sample from 10.0” NPS pipe
– contains two circumferential flaws
whose CL are at θ=30.0° and θ=78.1°
© 2014 Electric Power Research Institute, Inc. All rights reserved.
16
Experimental Procedure
• A circular 0.25” 3.5MHz conventional probe is used; scanning performed using
transverse waves at 45° (steel) via a plexiglass wedge
– coupling
p g between p
probe and wedge
g achieved by
y mineral oil
– coupling between wedge and part achieved by running water
• Data collected by Zetec Omniscan MX 16-128
– controlling software: Zetec Ultravision 1.2R7
• ATCO LPS-1000 encoder used for motion control along two axes
© 2014 Electric Power Research Institute, Inc. All rights reserved.
17
Experimental and Simulated Results
• CIVA simulations performed using
• (top) cumulated VC top view,
single contact element at 3.5 MHz
filtered by time to remove
– Simulated scan performed in 89 rows (0
(0.8
8°
b k ll reflections
backwall
fl ti
and
d (b
(bottom)
tt )
apart); in each row, 35 data are collected
cumulated VC end view
(1.0 mm apart)
2
2
1
EXP
1
CUMULATED TOP VIEW
SIM
CUMULATED TOP VIEW
CUMULATED END VIEW
CUMULATED END VIEW
1
2
EXP
2
1
© 2014 Electric Power Research Institute, Inc. All rights reserved.
18
SIM
Comparison Summary
• Flaws are well located by both experiment and simulation
• Differences
– CIVA overestimates length
g of first flaw;; experimentally
p
y it is underestimated
– Both methods underestimated length of second flaw
– CIVA underestimates strength of reflection from first flaw relative to the
second flaw
1
flaw 1 CL
flaw 1 length
flaw 2 CL
flaw 2 length
actual
30.0°
10.6°
78.1°
14.8°
experimental
30.1°
8.9°
77.4°
12.2°
simulated
30.0°
11.8°
78.4°
12.9°
2
© 2014 Electric Power Research Institute, Inc. All rights reserved.
19
UT Simulation Summary
• Three comparisons have been observed:
– Quality of CIVA off-axis predictions from SDH
– Relative reflection strengths and depth estimations from notches
cut into steel block
– Quality of experimental and CIVA-estimated location of
circumferential
i
f
ti l flflaws iin austenitic
t iti stainless
t i l
steel
t l piping
i i sample
l
• Good qualitative and visual agreement between simulation and
experiment given the main limitations:
– no noise present in CIVA simulations
– user must be aware of CIVA simulation options, particularly those
controlling number of modes and reflections
– options are available to account for structural noise and other
simulation phenomena but computation time is greatly increased
• CIVA simulation performed adequately when compared against
experimental measurements for notched block and austenitic
stainless steel piping sample
© 2014 Electric Power Research Institute, Inc. All rights reserved.
20
Eddy Current Inspection of Steam Generator Tube w/ Holes
© 2014 Electric Power Research Institute, Inc. All rights reserved.
21
CIVA ET simulation
400 kHz bobbin coil, differential mode, ASME standard, IN 600, OD: 0.875” , WT: 0.05”
© 2014 Electric Power Research Institute, Inc. All rights reserved.
22
CIVA ET simulation vs. experimental Results
400 kHz bobbin coil, differential mode, ASME standard, IN 600, OD: 0.875” , WT: 0.05”
Simulation results
Experimental results
Red: 100% thru; Black: 69%; Blue: 19%
© 2014 Electric Power Research Institute, Inc. All rights reserved.
23
CIVA ET Simulation vs. Experimental Results
400 kHz bobbin coil, absolute mode, ASME standard, IN 600, OD: 0.875” , WT: 0.05”
Red: 100% thru; Black: 69%; Blue: 19%
© 2014 Electric Power Research Institute, Inc. All rights reserved.
24
CIVA RT Screen Dump
Tube Voltage: 220 kV; Tube Current 2 mA; focus-to-film distance : 25”: Exposure Time: 30 s
© 2014 Electric Power Research Institute, Inc. All rights reserved.
25