Test bank and solution science for life and biology (1)
Bạn đang xem bản rút gọn của tài liệu. Xem và tải ngay bản đầy đủ của tài liệu tại đây (276.03 KB, 19 trang )
INSTRUCTOR GUIDE
BIOLOGY
Science for Life
and
BIOLOGY
Science for Life
WITH PHYSIOLOGY
FOURTH EDITION
Colleen Belk
Virginia Borden Maier
University of Minnesota, Duluth
St. John Fisher College
Jill Feinstein
Richland Community College
Boston Columbus Indianapolis New York San Francisco Upper Saddle River
Amsterdam Cape Town Dubai London Madrid Milan Munich Paris Montreal Toronto
Delhi Mexico City São Paulo Sydney Hong Kong Seoul Singapore Taipei Tokyo
Editor-in-Chief: Beth Wilbur
Executive Director of Development: Deborah Gale
Senior Acquisitions Editor: Star MacKenzie
Supplement Project Editor: Erin Mann
Managing Editor: Mike Early
Production Project Manager: Jane Brundage
Production Management: Saraswathi Muralidhar, PreMediaGlobal
Composition: PreMediaGlobal
Marketing Manager: Lauren Rodgers
Copyright © 2013, 2010, 2007 Pearson Education, Inc. All rights reserved. Manufactured in the United States of America. This
publication is protected by Copyright, and permission should be obtained from the publisher prior to any prohibited reproduction,
storage in a retrieval system, or transmission in any form or by any means, electronic, mechanical, photocopying, recording, or
likewise. To obtain permission(s) to use material from this work, please submit a written request to Pearson Education, Inc., Permissions Department, 1900 E. Lake Ave., Glenview, IL 60025. For information regarding permissions, call (847) 486-2635.
Many of the designations used by manufacturers and sellers to distinguish their products are claimed as trademarks. Where those
designations appear in this book, and the publisher was aware of a trademark claim, the designations have been printed in initial
caps or all caps.
ISBN 13: 978-0-321-77430-9
ISBN 10: 0-321-77430-2
www.pearsonhighered.com
CONTENTS
Chapter 1
Can Science Cure the Common Cold?
Introduction to the Scientific Method
1
Chapter 2
Are We Alone in the Universe?
Water, Biochemistry, and Cells
11
Chapter 3
Is It Possible to Supplement Your Way to Better Health?
Nutrients and Membrane Transport
17
Chapter 4
Fat: How Much Is Right for You?
Enzymes, Metabolism, and Cellular Respiration
27
Chapter 5
Life in the Greenhouse
Photosynthesis and Global Warming
35
Chapter 6
Cancer
DNA Synthesis, Mitosis, and Meiosis
41
Chapter 7
Are You Only as Smart as Your Genes?
Mendelian and Quantitative Genetics
49
Chapter 8
DNA Detective
Complex Patterns of Inheritance and DNA Fingerprinting
55
Chapter 9
Genetically Modified Organisms
Gene Expression, Mutation, and Cloning
65
Chapter 10 Where Did We Come From?
The Evidence for Evolution
75
Chapter 11 An Evolving Enemy
Natural Selection
85
Chapter 12 Who Am I?
Species and Races
89
Chapter 13 Prospecting for Biological Gold
Biodiversity and Classification
107
Chapter 14 Is the Human Population Too Large?
Population Ecology
119
Copyright © 2013 Pearson Education, Inc.
iii
iv Contents
Chapter 15 Conserving Biodiversity
Community and Ecosystem Ecology
135
Chapter 16 Where Do You Live?
Climate and Biomes
145
Chapter 17 Organ Donation
Tissues, Organs, and Organ Systems
157
Chapter 18 Clearing the Air
Respiratory, Cardiovascular, and Excretory Systems
163
Chapter 19 Vaccinations: Protection and Prevention or Peril?
Immune System, Bacteria, Viruses, and Other Pathogens
175
Chapter 20 Sex Differences and Athleticism
Endocrine, Skeletal, and Muscular Systems
185
Chapter 21 Is There Something in the Water?
Reproductive and Developmental Biology
193
Chapter 22 Attention Deficit Disorder
Brain Structure and Function
201
Chapter 23 Feeding the World
Plant Structure and Growth
211
Chapter 24 Growing a Green Thumb
Plant Physiology
219
Quick Reference Guide to Instructor Visual Resources
229
Copyright © 2013 Pearson Education, Inc.
CHAPTER
1
Can Science Cure the
Common Cold?
Introduction to the Scientific Method
OBJECTIVES
Teaching Goals
Most students have covered the scientific method in high school biology. However, when asked to define
a hypothesis, the majority will say, “A hypothesis is an educated guess,” without any comprehension of
what it really means. This chapter introduces the student to the scientific method as a way of thinking
and explaining observations. This chapter also familiarizes students in the proper setup of experiments
and statistical analysis of data. The emphasis should be on using critical thinking in everyday decision
making—not just in a laboratory. Students are inundated with claims based on anecdotal evidence and
misrepresentation of data. Your goal is to help the students evaluate such claims by critical analysis of
the data.
Student Goals
By the end of this chapter, students should be able to accomplish the following learning objectives:
• Describe the characteristics of a scientific hypothesis.
• Compare and contrast the terms scientific hypothesis and scientific theory.
• Distinguish between inductive and deductive reasoning.
• Explain why the truth of a hypothesis cannot be proven conclusively via deductive reasoning.
• Describe the features of a controlled experiment and explain how these experiment eliminate
alternative hypotheses for the results.
• List strategies for minimizing bias when designing experiments.
• Define correlation, and explain the benefits and limitations of using this technique to test hypotheses.
• Describe the information that statistical tests prove.
• Compare and contrast primary and secondary sources.
• Summarize the techniques you can use to evaluate scientific information from secondary sources.
LECTURE OUTLINE
1.1 The Process of Science (Figure 1.1)
A. Scientific method allows for solving of problems and answering questions.
B. Hypotheses are explanations of how something works and must be testable and falsifiable.
Copyright © 2013 Pearson Education, Inc.
1
2 Instructor Guide Biology: Science for Life
C. Scientific theories are supported by multiple lines of evidence from hypotheses that have been
tested by deductive reasoning.
D. Construction of hypothesis involves inductive reasoning and hypothesis testing involves
deductive reasoning. (Figure 1.3)
1.2 Hypothesis Testing
A. Hypotheses are tested by experiments that should be controlled for variables and bias.
B. Correlation between variables may provide answers when other testing is problematic.
(Figure 1.10, Figure 1.11)
C. Model systems are used when testing on humans is dangerous or unethicial.
(Figure 1.7)
Lecture Activity 1.1
Lecture Activity 1.2
Lecture Activity 1.3
1.3 Understanding Statistics
A. Statistical analysis can help researchers apply results from a small experimental group to a larger
group without actually testing the larger group. (Figure 1.12)
B. The significance of results is influenced by the size of the sample and the validity of the
hypothesis. (Figure 1.15)
C. Sampling error is the difference between a sample and the population that it is being compared to.
1.4 Evaluating Scientific Information
A. Information from primary sources is used as the basis for news articles and websites.
(Figure 1.16)
B. Different media sources have various levels of credibility and reliability.
Lecture Activity 1.4
1.5 Is There a Cure for the Common Cold?
A. Hand-washing is the best method for preventing the common cold.
Lecture Activity 1.1: Developing and Testing Hypotheses
Estimated Time to Complete: 15–20 minutes, or longer with discussion
Introduction: This activity gives students a chance to practice what they have learned about developing
hypotheses and testing them. Students work in groups of three to four to promote interactive learning and
discussion. An observation is given to each group, and the group members’ job is to create a testable and
falsifiable hypothesis to explain that observation. The activity can stand alone, or it can become the basis
of a discussion after completion. If desired, groups could report to the class on their observation, hypothesis,
and experiment.
A handout is provided with a sample observation. Here are several more suggestions, and others can
be made up as needed:
• Algae appear in clean water left outside in a child’s plastic pool for a week.
• Lawn grass doesn’t grow at the beach.
• Mosquitoes bite some people more than others.
• Coleus plants grown inside are taller but have thinner stems than coleus plants grown outside.
• Ants eat some foods that they find outside, but not all.
• Bees visit some types of flowers, but not others.
Copyright © 2013 Pearson Education, Inc.
Chapter 1 Can Science Cure the Common Cold? 3
Material
• Lecture Activity 1.1 Handout: Developing and Testing Hypotheses
Procedures
1. Divide the students into groups.
2. Clearly explain that each group will receive an observation and that their job is first to formulate
a testable hypothesis to explain that observation. They will then come up with an experimental
protocol, including controls that would test their hypothesis.
3. Distribute a handout to each group, or give them their observation verbally. Groups can all receive
the same observation, or a different observation can be used for each group.
4. Give the students 10–15 minutes to generate their hypothesis and experiment. Circulate around
the classroom during that time to make sure that groups remain on task, that their hypotheses are
reasonable and testable, and that the experimental procedure includes a control and makes sense.
5. If desired, ask groups to present their observation, hypothesis, and experiment to the class.
Assessment Suggestions: Have groups turn in their papers. Check that the hypotheses are testable and
falsifiable and that control groups were used properly. Give students participation points for presenting
their ideas to the class.
For an online course have students submit their hypotheses in a discussion forum and have the
students discuss the results and determine if each hypothesis is in the correct format. Points are given
following a rubric for participation.
Copyright © 2013 Pearson Education, Inc.
Name:
Date:
Instructor:
Course Section:
Lecture Activity 1.1 Handout: Developing and Testing Hypotheses
Observation: Sea oats grow only near the beach.
Hypothesis:
Questions:
1. Is this hypothesis testable?
2. Design an experiment to test your hypothesis. Be sure to include a control group and use it properly.
Ask for help if you’re not sure.
Copyright © 2013 Pearson Education, Inc.
Chapter 1 Can Science Cure the Common Cold? 5
Lecture Activity 1.2: Do Bees See in Color?
Estimated Time to Complete: 15–20 minutes, or longer with discussion
Introduction: This activity puts students into the shoes of a real scientist who is trying to answer a
question about nature. The students read an account of some actual experiments done by Karl von Frisch
to try to determine whether bees can see in color. They start with von Frisch’s observations, find out what
he did, and work through the experimental method along with him. Working in groups, they see how von
Frisch interpreted and then improved his experimental method to draw his conclusions.
Material
• Lecture Activity 1.2 Handout: Do Bees See in Color?
Procedures
1. Divide students into groups.
2. Briefly introduce the activity and explain what students are to do.
3. Pass out handouts.
4. As students are working, circulate around the classroom to check that groups remain on track.
Sometimes they can get off on a tangent, hypothesizing, for example, that bees like sugar water.
They also tend to express themselves in vague generalities; keep them to specifics.
Assessment Suggestions: Collect and check group papers. A key for correcting the handout is provided.
Tell students that, using a similar set of experiments, von Frisch demonstrated that bees could not see the
color red. Ask the class to describe the experiments and results that would have led von Frisch to reach
this conclusion.
You could also put the handout online and have them fill out the handout online after completing the
work in the classroom or have students work on this individually online and treat it like an assignment.
Handout Answer Key
1. What was von Frisch’s hypothesis? Von Frisch hypothesized that bees could see the color blue.
2. What conclusion should von Frisch draw from his results? He should conclude that the results
supported his hypothesis—that the bees could distinguish the blue paper from the red paper.
3. What observation would have falsified von Frisch’s hypothesis? His hypothesis would have been
falsified if the bees had swarmed around both bowls equally.
4. Which uncontrolled variable in his first experiment did von Frisch correct in the second experiment,
and why was it important? The uncontrolled variable was color intensity. It is important because it is
a way that bees could distinguish between the papers without actually being able to see their color.
5. How did von Frisch control for this variable in the second experiment? He put bowls on a series of
gray papers with similar color intensity to the blue paper to see if that would confuse the bees.
6. What was the overall conclusion from von Frisch’s series of experiments? (Remember to refer to his
original hypothesis.) Von Frisch concluded that his hypothesis was supported; bees can see the color blue.
Copyright © 2013 Pearson Education, Inc.
Name:
Date:
Instructor:
Course Section:
Lecture Activity 1.2 Handout: Do Bees See in Color?
Karl von Frisch studied the interactions between bees and flowers. He wanted to know how bees select
which flower to go to. In particular, he wanted to know whether the bees could see different flower colors
and would, therefore, select flowers based on their color.
In his first experiment, von Frisch put out pieces of red- and blue-colored paper, each of which had a
bowl on top. In the bowl on the blue paper, he put sugar water; he left the bowl on the red paper empty.
Bees discovered the sugar water in the bowl on the blue paper and ate it, returning again and again with
other bees to get more.
After a while, von Frisch took away the papers and bowls. He replaced them with two new bowls
with colored paper, identical to the first pair except that both bowls were empty this time. He found that
bees swarmed around the bowl on the blue paper, ignoring the bowl on the red paper.
Note that von Frisch already knew that bees like sugar water; this issue is not being tested in this
experiment.
1. What was von Frisch’s hypothesis?
2. What conclusion should von Frisch draw from his results?
3. What observation would have falsified von Frisch’s hypothesis?
Copyright © 2013 Pearson Education, Inc.
It occurred to von Frisch that his experiment was not well controlled. Besides their colors, there was another
difference between the papers that bees might use to tell them apart. The papers were very different in overall intensity of color; the red paper was much darker than the blue paper. In other words, even without color
vision (like on a black-and-white TV), the papers would look different. Although you couldn’t tell what
color the papers were, you could determine which was which if they were moved or rearranged. Perhaps the
bees were responding to this intensity difference rather than to the actual color difference.
To check this new hypothesis, von Frisch took away the papers and bowls again. This time he set out
a series of gray papers, some with the same intensity as the blue paper, and put the blue paper in the middle of these gray papers. All papers had an empty bowl on top. Once again, the bees flew directly to the
blue paper and swarmed around its bowl.
4. Which uncontrolled variable in his first experiment did von Frisch correct in the second experiment,
and why was it important?
5. How did von Frisch control for this variable in the second experiment?
6. What was the overall conclusion from von Frisch’s series of experiments? (Remember to refer to his
original hypothesis.)
Copyright © 2013 Pearson Education, Inc.
8 Instructor Guide Biology: Science for Life
Lecture Activity 1.3: Demonstrating the Importance of Control Groups
Estimated Time to Complete: 10–15 minutes
Introduction: This short demonstration helps students understand the importance of a control group in
drawing inferences from data. Students are presented with data on the effect of drugs on the survival rates
of several diseases, but then will realize that the data are meaningless without the ability to compare the
experimental data to a control group.
Material
• Copy or project the data given in steps 2 and 4.
Procedures
1. Ask students to imagine that they head up a research expedition to a remote location; they have a
medical computer and some medicines, but no doctor with them. Three members of the research
team come down with different illnesses, and the expedition leader must decide how to treat them.
The medical computer diagnoses their illnesses and finds out some basic data on treatment options.
Luckily, some of the drugs that have been used to treat their conditions in the past are available. The
computer finds the information given in step 2.
2. Copy the following data onto a slide or transparency, or write it on the board:
Disease A, treated with drug A, has a survival rate of 23%.
Disease B, treated with drug B, has a survival rate of 56%.
Disease C, treated with drug C, has a survival rate of 89%.
Based on these data, ask students what they think of these treatments and how they would choose to treat
their assistants.
3. On giving the matter further thought, you realize that you are missing some important data. You can’t
really understand the efficacy of the drug treatment unless you know the survival rates in the control
groups that received no medications. A little more digging gives you additional data (see step 4).
4. Deliver the following data to the students in the same way, so that they can see both sets of data at the
same time:
Disease A, untreated, has a survival rate of 10%.
Disease B, untreated, has a survival rate of 54%.
Disease C, untreated, has a survival rate of 95%.
5. Ask students to reconsider their initial opinions and decisions in light of the new data and decide
which disease to treat with which drug.
Assessment Suggestions: Discuss with the class the role of control groups in experimental design and
explore how they allow scientists to draw reliable inferences.
Lecture Activity 1.4: Evaluating Scientific Claims in Advertisements
Estimated Time to Complete: 10–30 minutes, depending on how many ads are used
Introduction: We are saturated with stories from the newspaper, magazines, television, and the Internet
about the effectiveness of many products, including cold remedies, health supplements, weight-loss
products, and so on. These ads are difficult to assess, because we cannot completely determine the quality
of the information or the extent to which the financial backers of a product are driving the information
being presented. The purpose of this activity is to demonstrate a variety of media resources to the students
and ask them their opinions about the effectiveness of the messages portrayed.
Copyright © 2013 Pearson Education, Inc.
Chapter 1 Can Science Cure the Common Cold? 9
Material
• Any source of advertisements will do: magazines, websites, taped TV or radio commercials. Ads can
be displayed or reproduced in any convenient fashion. Include ads for various types of products.
Procedures
1. Project or otherwise show students a variety of ads that make claims or promote products.
2. Ask the students to comment on the scientific validity and persuasiveness of the ads. This can be done
as a single large discussion or in a small-group format. Discussion questions could include these:
• Does the ad seem plausible? Why or why not?
• Are any data cited? Do those data seem complete? Are controls or comparisons included?
• Are testimonials used? If so, are they convincing? Why or why not?
• What other information do you wish the ad contained to better help you decide whether to buy the
product?
• Would you buy the product based on this ad? Why or why not?
Assessment Suggestions: A suggested assignment would be for the student to find his or her own
advertisement, similar to what the instructor showed in class, and analyze the material for reliability of
the information.
In class discussion, poll students to see if any of them have tried or know someone who has used one
of the products displayed. Have students compare opinion polling with hypothesis testing based on the
use of these methods in advertising and their relative worth as sources of data.
For a group project, students could be assigned a specific health issue (e.g., cold remedies, arthritis
relief) and asked to find conflicting testimonials or anecdotes from media sources. Each group could
present to the rest of the class their findings on that particular issue and discuss what a primary resource
indicates about the subject as compared to secondary sources.
Copyright © 2013 Pearson Education, Inc.
CHAPTER
2
Are We Alone in the Universe?
Water, Biochemistry, and Cells
OBJECTIVES
Teaching Goals
This chapter introduces an invisible world that students often find difficult to grasp. Descriptive imagery
and graphic representations are the basis for understanding atoms and cells. As a teacher, you must
connect this invisible world to the visible world that students can see. Carbohydrates, proteins, and fats
make more sense when seen on a food label, for example. Cells become real when connected to forensic
evidence left at the scene.
Student Goals
By the end of this chapter, students should be able to accomplish the following learning objectives:
• Describe the properties associated with living organisms.
• List the components of water and some of the properties that make it important in living organisms.
• Describe how atomic structure affects chemical bonding.
• Compare and contrast hydrogen, covalent, and ionic bonds.
• Discuss the importance of carbon in living organisms.
• Describe the structure of carbohydrates, proteins, lipids, and nucleic acids and the roles these
macromolecules play in cells.
• Compare and contrast prokaryotic and eukaryotic cells.
• Describe the structure and functions of cell membranes.
• Describe the structure and function of the subcellular organelles.
• Provide a general summary of the theory of evolution.
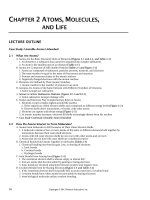
LECTURE OUTLINE
2.1 What Does Life Require?
A. All organisms operate using the same biological molecules, are composed of cells, and use
feedback mechanisms to maintain homeostasis. (Figure 2.1)
B. Atoms and subatomic particles play a role in chemical reactions and bond formation.
(Figure 2.3)
C. Water is essential to life, and its properties are based on its polarity. (Figure 2.4, Figure 2.5,
Figure 2.6)
Lecture Activity 2.1
Lecture Activity 2.2
Copyright © 2013 Pearson Education, Inc.
11
12 Instructor Guide Biology: Science for Life
D. Acids, bases, and salts play a role in chemical reactions.
E. Life on Earth is based on the carbon atom and its bonding capabilities to form macromolecules
(carbohydrates, proteins, lipids, and nucleic acids). (Figure 2.9, Figure 2.10, Figure 2.11,
Figure 2.12, Figure 2.13, Figure 2.14, Figure 2.15)
2.2 Life on Earth
A. Cells are the basic unit of life on Earth.
B. Cells are either prokaryotic or eukaryotic. Prokaryotic cells, such as bacteria, do not have a
separate nucleus and are less complex than eukaryotic cells. (Figure 2.17)
C. All cells have a variety of parts that work together to enable them to function in particular
environments. (Table 2.1)
Lecture Activity 2.3
Lecture Activity 2.4
D. The diversity of cells and organisms is based on evolutionary theory. (Figure 2.19)
Lecture Activity 2.1: Understanding Chemical Bonding
Estimated Time to Complete: 10–20 minutes
Introduction: This activity is a basic introduction to the concept of chemical bonding. It is a short,
in-class exercise that can follow the first discussion of atomic structure and bonding. Students will take
the number of their birth month as their atomic number. Given this information, they will be able to
determine the configuration of their electrons. They will then be able to determine how they, as atoms,
will interact with other atoms, if at all. Students will form “bonds” with other students to make ions or
molecules.
Material
• Lecture Activity 2.1 Handout: Understanding Chemical Bonding
Procedures
1. Briefly explain to the students what they will be expected to do on the worksheet.
2. Each student will complete a worksheet alone, but you can allow students to work together if you
like.
3. Pass out worksheets, and circulate around the room to ensure that students get started correctly;
answer questions that come up.
4. After they know which type of partner they need, encourage students to get out of their seats and walk
around to find someone suitable.
Assessment Suggestions: Collect and grade the handouts. Use this assignment as the basis of a
homework or test question.
Copyright © 2013 Pearson Education, Inc.
Name:
Date:
Instructor:
Course Section:
Lecture Activity 2.1 Handout: Understanding Chemical Bonding
1. What is the number of your birth month? (January = 1, February = 2, etc.) This is your atomic
number.
2. Draw your appearance as an atom. Around the nucleus, put the correct number of electrons in their
correct valence shells.
3. Which type of bond would you like to form to become stable?
4. Find one or more other students to bond with so that you form a stable bond. Draw the ion or
molecule that you all formed.
5. Explain why you are stable in this configuration.
Copyright © 2013 Pearson Education, Inc.
14 Instructor Guide Biology: Science for Life
Lecture Activity 2.2: Molecular Twenty Questions
Estimated Time to Complete: 10–20 minutes
Introduction: In this activity, students get an opportunity to test their knowledge of biological molecules.
The students will form groups of three to four. Each student will secretly receive the name of a biological
molecule. The other students in the group will then take turns asking yes or no questions until one of them
is able to correctly guess the identity of the molecule in question.
Material
• Names of different molecules on pieces of paper cut from the bottom of this page.
Procedures
1. Divide students into groups of three to four. Explain how the game will work, and have the students
determine who will go first in each group.
2. Pass around a hat or box containing small folded pieces of paper each with the name of a molecule. In
a small class, you can pass out the papers initially to only one student in each group, and then have
other students come up for another piece after each round. In a large class, have everyone take a paper
at the same time.
3. The person going first in each group silently reads his or her molecule’s name, and then the other
group members take turns asking a yes or no question to try to identify the molecule.
4. When students have a guess about the molecule, they must wait until it is their turn to say it.
5. Other members of the group then answer questions about their molecules until all members have had
a turn, or until the allotted time is up.
Assessment Suggestion: You may have the students keep track of how many molecules they guess
correctly, and give out a grade or extra credit for those who score above a certain number.
Molecule Names
Copyright © 2013 Pearson Education, Inc.
Chapter 2 Are We Alone in the Universe? 15
Lecture Activity 2.3: The Cell as a City
Estimated Time to Complete: 5–10 minutes
Introduction: Cells, because they are capable of independent life, must be able to carry out all of the
processes necessary for life within themselves. In some ways they resemble cities; the functions of
organelles can be compared to utilities and institutions that students are familiar with in the macroscopic
world.
Material
• None.
Procedures
After discussing the functions of various organelles, ask students which organelle is most similar to the
following institutions:
• A public library (the nucleus stores information)
• The U.S. Postal Service (the Golgi apparatus sorts and delivers materials)
• A water tower (vacuoles store water)
• A coal-burning power plant (mitochondria convert fuel to energy)
• A solar power plant (chloroplasts convert sunlight to energy)
• Manufacturing plants (ribosomes and endoplasmic reticulum build proteins)
• A moving company (centrioles facilitate movement of chromosomes during mitosis)
Assessment Suggestions: Use similar comparisons on test questions.
Lecture Activity 2.4: Cells Alive!
Estimated Time to Complete: 5–10 minutes
Introduction: The concepts of living cells are central to every biology course. However, it is difficult for
students to discuss life and its dynamics when they are exposed to only two-dimensional, static pictures.
This lecture activity brings the concepts of cells to life by letting students watch cancer and bacterial cells
divide in real time. This activity can be used to discuss differences between prokaryotic and eukaryotic
cells, cell structure, and the characteristics of life.
Material
• A computer with projector capabilities and an Internet connection.
Procedures
1. In the classroom, project the following website: .
2. Many areas related to cells can be explored at this website, but a favorite is “Cell Cam.” You can find
this link along the left side of the “CELLS alive!” home page.
3. You will see two pictures: one of human cancer cells dividing and one of bacterial cells dividing.
When you click on one of these pictures, you will link to a page that has three picture frames. The
first picture was taken earlier in the day; the time this picture was taken is shown at the top of the
picture. The picture on the far right is the most recent picture taken; its time is also shown. The
middle picture will look like the left picture until you change it by clicking the 1 and 2 buttons below
the pictures.
4. The “CELLS alive!” website maintains a live link to a camera that takes pictures of these cells every
few minutes. You can click on the +1 and +5 buttons below the pictures to view the pictures that were
Copyright © 2013 Pearson Education, Inc.
16 Instructor Guide Biology: Science for Life
taken between the first and the current pictures. In this way, you can watch the cells divide as you
click through the sequence of pictures taken that day.
5. If you remain on this site, you can watch the next pictures taken. Students really love the idea of the
pictures being taken “live” right in front of them. They are actually witness to cell division events.
6. Demonstrate the division of human cells and bacterial cells by clicking consecutively through an
entire day of pictures. Have students note how fast each cell type divides, what the size and shape of
the cells are, and how the cells react to one another in the Petri plate.
7. Have students draw and label some of what they see. Are there internal structures evident in the
pictures of these cells? Why or why not? How are these pictures different from the figures in the
textbook? Can students visualize these cells dividing in this way in the human body?
Assessment Suggestions: Students may turn in their drawings and observations. There are also many
ideas for follow-up activities on this website.
This could also be done as an online assignment. Provide students with the link and then create an
assignment using a variety of questions.
Copyright © 2013 Pearson Education, Inc.