Test bank and solution manual of ch02 echomics the production possibility model (2)
Bạn đang xem bản rút gọn của tài liệu. Xem và tải ngay bản đầy đủ của tài liệu tại đây (539.71 KB, 9 trang )
Chapter 02 - The Production Possibility Model, Trade, and Globalization
Chapter 2: The Production Possibility Model, Trade, and Globalization
Questions and Exercises
1.
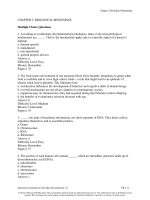
In the accompanying figure, wadget production is measured on the vertical axis
and widget production is measured on the horizontal axis. If the society becomes
more productive in its output of widgets, it can produce more of them, and the
endpoint of the curve on the horizontal axis will move to the right, as shown in
the graph. If the society is also less productive in its production of wadgets, the
endpoint on the vertical axis will move down, as shown in the graph. The result is
a new production possibility curve.
2.
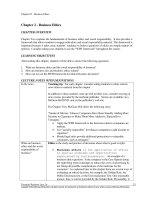
If a society became equally more productive in the production of both widgets
and wadgets, the production possibility curve would shift out to the right, as
shown in the accompanying graph.
3.
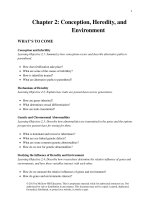
Any production possibility curve that shows the principle of a rising trade-off
must be bowed out. The accompanying grade production possibility curve
embodies the principle of rising trade-off. The table is also presented here. Notice
that for each 20-point gain in the History grade, the amount of points lost on the
Economics grade steadily increases.
2-1
© 2013 by McGraw-Hill Education. This is proprietary material solely for authorized instructor use. Not authorized for sale or
distribution in any manner. This document may not be copied, scanned, duplicated, forwarded, distributed, or posted on a website, in
whole or part.
Chapter 02 - The Production Possibility Model, Trade, and Globalization
History
40
60
80
Economics
100
80
50
4. a. To produce one more Peep, JustBorn must give up 3 Mike and Ikes. Hence, the
trade-off for 1 Peep is 3 Mike and Ikes. The trade-off for 1 Mike and Ike is 1/3 of
a Peep.
b. See the accompanying graph.
c. Point A is efficient. Point B is inefficient. Point C is impossible.
d. See the accompanying graph.
5.
The theory of comparative advantage underlies the shape of the production
possibility curve. If each person's comparative advantage is taken advantage of,
higher total output can be reached than would be the case if each produced all
goods on his or her own or if each produced goods for which he or she did not
have a comparative advantage. As more and more of a good is produced,
resources that have less of a comparative advantage are brought into the
production of a good, causing the production possibility curve to be bowed
outward.
2-2
© 2013 by McGraw-Hill Education. This is proprietary material solely for authorized instructor use. Not authorized for sale or
distribution in any manner. This document may not be copied, scanned, duplicated, forwarded, distributed, or posted on a website, in
whole or part.
Chapter 02 - The Production Possibility Model, Trade, and Globalization
6. a. See the accompanying graph.
b. As the output of food increases, the trade-off between food and clothing is
increasing. To illustrate, giving up 4 of clothing (from 20 to 16) results in a gain
of 5 food (from 0 to 5), but giving up another 4 clothing (from 16 to 12) results in
a gain of 4 food (from 5 to 9), and this pattern continues.
c. If the country gets better at producing food, the place where the production
possibility curve intersects the horizontal axis will move to the right.
d. If the country gets equally better at producing food and producing clothing, the
production possibility curve will shift out along both axes by the same proportion.
7.
There are no gains from trade when neither of two countries has a comparative
advantage in either of two goods.
8.
The fact that the production possibility model tells us that trade is good does not
mean that in the real world free trade is the best policy. The production possibility
model does not take into account the importance of institutions and government in
trade. For example, the model does not take into account externalities associated
with some trades, the provision of public goods, or the need for a stable set of
institutions or rules. The production possibility model shows maximum total
output, but that is not the only societal goal to take into account in formulating
policy.
9. a. See the accompanying graph.
2-3
© 2013 by McGraw-Hill Education. This is proprietary material solely for authorized instructor use. Not authorized for sale or
distribution in any manner. This document may not be copied, scanned, duplicated, forwarded, distributed, or posted on a website, in
whole or part.
Chapter 02 - The Production Possibility Model, Trade, and Globalization
b. The United States has a comparative advantage in the production of wheat
because it can produce 2 additional tons of wheat for every 1 fewer bolt of cloth,
whereas Japan can produce 1 additional ton of wheat for every 2 fewer bolts of
cloth. Japan has a comparative advantage in producing cloth.
c. The United States should trade wheat to Japan in return for bolts of cloth. One
possibility is that the United States produces 1,000 tons of wheat and Japan
produces 1,000 bolts of fabric and they divide total production equally. Both get
500 tons of wheat and 500 yards of fabric. Both end up with more of each good.
(Note: Other combinations are possible.)
d. See the accompanying graph.
10.
Globalization increases competition by allowing greater specialization and
division of labor. Because companies can move operations to countries with a
comparative advantage, they can lower production costs and increase competitive
pressures. The decreased importance of geographical location increases the size of
potential markets, increasing the number of suppliers in each market and thus
increasing competition.
11.
The law of one price rules, meaning that U.S. wages can exceed foreign wages
only to the degree that U.S. workers are more productive than foreign
workers. Therefore, the adjustments that will need to occur will equalize
wage rates. Thus, either Western nominal wages will grow slowly and
foreign nominal wages will grow rapidly and catch up or U.S. exchange rates
will decline to equalize wages. Some combination of the two is most likely. It
is possible that there will develop areas of production/services that will
allow U.S. wages to remain high.
12.
The law of one prices states that the wages of workers in one country will not
differ significantly from the wages of (equal) workers in another institutionally
similar country. As the world is globalizing, the law of one price causes firms to
hire workers in other countries. Because wages adjusted for productivity
differences are lower in other countries, firms choose to use workers in foreign
countries. As they do so, wages will be bid up until wages, adjusted for
productivity differences, are equal between the two countries.
2-4
© 2013 by McGraw-Hill Education. This is proprietary material solely for authorized instructor use. Not authorized for sale or
distribution in any manner. This document may not be copied, scanned, duplicated, forwarded, distributed, or posted on a website, in
whole or part.
Chapter 02 - The Production Possibility Model, Trade, and Globalization
Questions from Alternative Perspectives
1.
Austrian
In a market economy competition, the market process translates individual
actions into actions that are good for society. There is no such mechanism for
government; government has a monopoly on power, which allows
individuals in government to use that monopoly to achieve their ends, which
may not be “good” ends. This monopoly on power makes government less
reliable than the market for doing good, since the government is not subject
to entry and exit as firms are in the market. Also, whether every individual
voice is taken into account depends on the government system, whereas the
market will always include any individual’s voice by that individual’s entry or
exit.
2.
Religious
a. Most people would say that although it might be a component of the goals of
society, it is not “the” goal of society. Other goals might include virtues such
as kindness and generosity.
b. If a country is Christian, maximizing should not be "the" goal of society.
c. In a Christian society, the paramount goal would be to discern and fulfill the
will of God.
3.
Feminist
a. Companies definitely think that sex sells products. Just look at the cover of any
number of magazines.
b. Sex is used in the advertising of numerous products.
c. All people are subject to abuse by advertising, but women are more likely to be
portrayed as objects instead of people and are therefore at greater risk of
exploitation.
d. Although men and women may both be used in advertising, typically men are
shown to be in a dominant position of power and women are shown in
subordinate positions.
4.
Institutionalist
a. Back in the 1950s President Eisenhower warned of the military/industrial
complex, which maintains all types of military spending on projects so that
they continue to generate jobs in those areas. Senators with power on the
appropriations committee inevitably have larger defense expenditures in
their districts than do senators not on the appropriations committee. This
2-5
© 2013 by McGraw-Hill Education. This is proprietary material solely for authorized instructor use. Not authorized for sale or
distribution in any manner. This document may not be copied, scanned, duplicated, forwarded, distributed, or posted on a website, in
whole or part.
Chapter 02 - The Production Possibility Model, Trade, and Globalization
high spending on military production results in a trade-off. It means that
there is less money to spend on consumer goods, leading to lower production
of consumer goods.
b. The short-term consequence is a loss in consumer goods. The long-term
consequences are potentially much more serious, because for the military to
justify the expenditures, wars are necessary; thus, the production of military
goods over consumer goods can increase the probability of wars. Some might
argue that the latest Iraq war is an example, with Halliburton benefiting from
it and the former head of Halliburton, Vice President Cheney, leading the
group pushing for the U.S. entrance into the war.
5.
Radical
a. Yes, for many low-wage jobs it does, although technology is changing that to
some degree.
b. When making policy decisions, society must take into account not only what
is produced but the methods and means of production.
Issues to Ponder
1.
This statement can be true or false depending on the implicit assumptions made in
the analysis. It is true in light of the fact that individuals will eliminate all
inefficiencies they see through trading. It might be false if not everyone knows all
the benefits and the inefficiencies or does not have the opportunity to correct the
inefficiencies or if the costs of eliminating the inefficiency are too high.
2.
If a particular distribution of income is one of society’s goals, a particular
production technique that leads to greater output but also an undesirable
distribution of income might be considered an inefficient method of production.
Remember, efficiency is achieving a goal as cheaply as possible. Maximizing
output is not the only goal of a society.
3. a. From the numbers alone, one would choose not to work because the
opportunity cost of working is giving up an $80,000 increase in lifetime
income whereas the benefit is $32,000 of income now. Although there is a
correlation between working time and GPA, we cannot conclude that
working an after-school job causes the decrease in GPA. Therefore, one might
be able to maintain a decent GPA while working. Moreover, earning money
might be the priority for a particular student to reach a goal, such as saving
for college that will lead to even greater lifetime earnings.
b. It depends on the particular student. Working takes time from study and thus
might be a reason for the decrease in GPA. But the situation varies from
student to student.
2-6
© 2013 by McGraw-Hill Education. This is proprietary material solely for authorized instructor use. Not authorized for sale or
distribution in any manner. This document may not be copied, scanned, duplicated, forwarded, distributed, or posted on a website, in
whole or part.
Chapter 02 - The Production Possibility Model, Trade, and Globalization
4.
The fact that lawns occupy more land in the United States than does any single
crop does not mean that the United States is operating inefficiently. Although the
cost of enjoying lawns is not included in GDP, lawns are nevertheless produced
consumption goods and are included in the production possibility curve for the
United States. The high proportion of land devoted to lawns implies that the
United States has enough food that it can devote a fair amount of land to the
production of goods for enjoyment such as lawns.
5.
Following the hint that society’s production possibility curve reflects more than
just technical relationships, we realize that trust is an input to production to the
extent that it is necessary for transactions. If everyone could fake honesty, the
production possibility curve would shift inward since no one could trust anyone
else, leading to the disintegration of markets. If some could fake honesty, those
few would gain at the expense of others. This is an example of the tragedy of the
commons.
6. a. Firms may produce in Germany because (1) transportation costs to and from
the other countries may be very high, so that if these costs are included, it
would not be efficient to produce there, (2) there might be tariffs or quotas
for imports into Germany that will prevent producing elsewhere, (3) the
productivity of German labor may be so much higher that unit labor costs in
Germany are the lowest, and (4) historical circumstances may have led to
production in Germany, and the cost of moving production may exceed
potential gains.
b. There would probably not be a significant movement of workers right away.
One would expect some movement from Greece and Italy into Germany, but
this would be limited by social restrictions such as language, culture, and the
economic climate in Germany, which currently has high unemployment.
Movement in the long run, however, might be substantial.
c. I would want to know about the rule of law in Thailand that will govern
business practices, the stability of the government, and the infrastructure. All
of these will affect the cost of production.
2-7
© 2013 by McGraw-Hill Education. This is proprietary material solely for authorized instructor use. Not authorized for sale or
distribution in any manner. This document may not be copied, scanned, duplicated, forwarded, distributed, or posted on a website, in
whole or part.
Chapter 02 - The Production Possibility Model, Trade, and Globalization
Chapter 2: Appendix A
1. See the accompanying graph.
2.
3.
4.
See the accompanying graph.
a. The relationship is nonlinear because it is curved, not straight.
b. From 0 to 5, cost declines as quantity rises (inverse relationship). From 5 to 10,
cost rises as quantity rises (direct relationship).
c. From 0 to 5, the slope is negative (slopes down). From 5 to 10, the slope is
positive (slopes up).
d. The slope between 1 and 2 units is the change in cost (30 – 20) divided by the
change in quantity (1 – 2), or –10.
3.
See the accompanying graph.
10
9
8
7
6
5
4
3
2
1
d
b
a
c
1
2 3 4
5 6 7
8 9 10
2-8
© 2013 by McGraw-Hill Education. This is proprietary material solely for authorized instructor use. Not authorized for sale or
distribution in any manner. This document may not be copied, scanned, duplicated, forwarded, distributed, or posted on a website, in
whole or part.
Chapter 02 - The Production Possibility Model, Trade, and Globalization
4. a.
b.
c.
d.
e.
1.
–3.
1/3.
–3/4.
0.
5. a.
b.
c.
d.
C.
A and E.
B and D.
B is a local maximum; D is a local minimum.
6. a. See line a in the accompanying graph.
b. See line b in the accompanying graph.
c. See line c in the accompanying graph.
7. a. y = 5x + 1,000.
b. y = 3x + 1,500.
8. a.
b.
c.
d.
Line graph.
Bar graph.
Pie chart.
Line graph.
2-9
© 2013 by McGraw-Hill Education. This is proprietary material solely for authorized instructor use. Not authorized for sale or
distribution in any manner. This document may not be copied, scanned, duplicated, forwarded, distributed, or posted on a website, in
whole or part.