Chế tạo, khảo sát tính chất và hình thái cấu trúc compozit trên cơ sở nhựa epoxy gia cường sợi thủy tinh e và nanosilica tt tiếng anh
Bạn đang xem bản rút gọn của tài liệu. Xem và tải ngay bản đầy đủ của tài liệu tại đây (1.28 MB, 28 trang )
MINISTRY OF
EDUCATION AND
TRAINING
VIETNAM ACADEMY
OF SCIENCE AND
TECHNOLOGY
GRADUATE UNIVERSITY SCIENCE AND
TECHNOLOGY
---------------------------Ho Ngoc Minh
PROJECT NAME: MANUFACTURE, INVESTIGATE
THE PROPERTIES AND MORPHOLOGY OF
COMPOSITE MATERIAL BASED ON GLASS FIBER E
AND NANOSILICA-REINFORCED EPOXYRESIN
Major: Theoretical Chemistry and Physical Chemistry
Code: 9 44 01 19
SUMMARY OF CHEMISTRY DOCTORAL THESIS
Ha Noi - 2019
The thesis was completed in : Graduate University Science and
Technology/ Vietnam Academy of Science and Technology.
Supervisors:
1) Assist. Prof. PhD. Tran Thi Thanh Van
2) Prof. PhD. Thai Hoang
Reviewer 1: ………………………….
Reviewer 2: ………………………….
Reviewer 3: ………………………….
The thesis will be defended at the doctoral thesis committee at the
Academy level, meeting at the Graduate University of Science and
Technology - Vietnam Academy of Science and Technology on ....’,
date … month … year
The thesis can be found at:
- Library of Graduate University of Science and Technology
- Vietnam National Library
LIST OF PUBLICATIONS
1. Ngoc Minh Ho, Thi Thanh Van Tran, Thuy Chinh Nguyen, Hoang
Thai "Characteristics and morphology of nanosilica modified with
isopropyl tri (dioctyl phosphate) titanate coupling agent", Journal of
Nanoscience and Nanotechnology Vol18, No 5, 2018, pp. 36243630(7). (ISI)
2. Ngoc Minh Ho, Thi Thanh Van Tran, Thuy Chinh Nguyen, Hoang
Thai, Effect of surface-modified nanosilica on the characteristics,
poroperties and morphology of silica/epoxy nanocomposites, The 6th
Asian Symposium on Advanced Materials: Chemistry, Physics &
Biomedicine of Functional and Novel Materials (ASAM6), pp 343348, 2017.
3. Ngoc Minh Ho, Thi Thanh Van Tran, Thuy Chinh Nguyen, Hoang
Thai, Epoxy/titanate modified nanosilica composites: morphology,
mechanical properties and fracture toughness. Tạp chí Khoa học
Công nghệ, 56 (2A),133-140, 2018.
4. Hồ Ngọc Minh, Trần Thị Thanh Vân, Nguyễn Thúy Chinh, Thái
Hoàng, Chế tạo, nghiên cứu đặc trưng, tính chất của nhựa epoxy
đóng rắn bằng hợp chất cơ titan và một số hợp chất amin, Tạp chí
Hóa học, 56(3), 401-406 (2018).
5. Ngoc Minh Ho, Thi Thanh Van Tran, Thuy Chinh Nguyen, Hoang
Thai, Epoxy-silica nanocomposite: Creep resitance and toughening
mechanisms, Emerging Polymer Technologies Summit (EPTS) and
Emerging Material Technologies Summit 2018 (EPTS/EMTS'18) /
2018.
6. Ngoc Minh Ho, Thi Thanh Van Tran, Thuy Chinh Nguyen, Hoang
Thai, Ternary nanocomposites based on epoxy, modified silica, and
tetrabutyl titanate: Morphology, characteristics, and kinetics of the
curing process, Inc. J. Appl. Polym. Sci. 2019, 136, 47412. (ISI)
INTRODUCTION
1. Necessity of the thesis
Polymer composite based on glass fiber E-reinforced epoxy resin
were commonly used in transportation, electronics, mechanical
engineering, machine, building, and chemicals … However, the
disadvantages and limitations affecting the application of this
composite material are their brittleness and poor impact resistance.
Therefore, improving toughness / toughening for epoxy resins is very
important. Some nanoscale additives have been applied to manufacture
epoxy-based composites as products for industries. Among nano
additives, surface modification of nanosilica with organic coupling
agent is one of the most commonly used for polymers, rubbers, and
plastics because it is easy to find, easy to use, relatively cheap
Titanium-based hardened epoxy resin can work long time at high
temperature. Research on composite materials based on epoxy / glass
fiber combined with surface modification of nanosilica by titanate
coupling and titanium curing agent is very new, promising to create
material system with high mechanical, physical, thermal properties.
And good electrical. Therefore, the PhD student chooses the thesis
topic "Manufacture, investigate the properties and morphology of
composite material based on glass fiber E and nanosilica-reinforced
epoxy resin”.
2. Purpose of the thesis
Manufacture composite based on epoxy reinforced by glass
fiber with organ – modified nanosilica using organotitanate curing
agent that have good mechanical strength, thermal stability, flame
restraint ability.
Improve the toughness of epoxy resin by incorporating
reinforcing agent such as organ – modified nanosilica and glass fiber
with appropriate manufacturing condition and ratio.
3. The main research content of the thesis
Study on grafting nanosilica surface with KR-12 titanate
coupling agent to enhance their dispersion ability in epoxy resin.
1
Study on curing reaction of epoxy resin YD-128 by tetrabutyl
titanate and properties of post-hardening products.
Manufacture, investigate the properties and morphology of
nanocomposite material based on epoxy, nanosilica and tetrabutyl
titanate.
Manufacture, investigate the properties and morphology of
composite material based on glass fiber E and nanosilica-reinforced
epoxy resin.
4. New contributions of the thesis
Successfully grafted K200 nanosilica particle surface with KR12 titanate coupling agent. Nanosilica nanoparticles after modified
have good dispersion ability in epoxy resin.
We studied the curing reaction of YD-128 epoxy resin with
tetrabutyl titannate and clarified the advantages of this curing agent
compared to conventional amine compounds
Explained the positive effect of KR-12/nanosilica to mechanical
properties, dynamic mechanical properties, toughness, toughness,
toughening mechanism of composite material based on epoxy/mnanosilica/ tetrabutyltitanate and glass fiber.
CHAPTER 1.
OVERVIEW OF EPOXY RESIN, NANOCOMPOZIT AND
COMPOZIT
MATERIALS
BASED
ON
EPOXY/
NANOSILICA / GLASS FIBER
This chapter present the following:
1. Epoxy resin: Classification, physical and chemical properties.
Curing agents, curing mechanisms and applications of epoxy in
various fields.
2. Nanosilica: introduction about composition, properties, structure,
applications of nanosilica in industry and surface modification
methods to increase their dispersion ability in plastic matrix.
3. Introduction about polymer composites, epoxy resin,
reinforcements and some parameters affected on the durability of
materials.
2
4. Domestic and foreign research situation and application of
composite materials based on epoxy / nanosilica / fiberglass.
CHAPTER 2.
EXPERIMENTAL
2.2. Methods
2.2.1. Determine coupling efficiency of KR-12 on nanosilica K200
Was determined by thermogravimetry:
H = (mbt.750 – mbd.750)/ mo
where: mbt.750 is the mass of SiO2 after modifying at 750 oC.
mbd.750 is the mass of unmodified SiO2 at 750 oC.
mo is the mass of initial SiO2.
2.2.2. Determine particle size and Zeta potential
Particle size distribution and zeta potential of nanosilica before
and after modifying was determined by Zetasizer Nano ZS
(Malvern-UK) using laser scattering method.
2.2.3. Determine gel content
Gel content of the samples after curing was determined by
Soxhlet extraction and calculated using the following formulation:
GC = 100. (m1/m0)
where: m0 is the mass of initial sample (g); m1 is the mass of the
sample after extracting (g); GC: gel content (%).
2.2.4. Viscometry
The viscosity was determined on the viscometer Brookfield
Model RVT- Series 93412 (American), at 25 oC following the
standard DIN 53018.
2.2.5. Transmitted Electronic Microscopy (TEM)
TEM image was recorded on JEM1010 of JEOL (Japan). The
sample was cut into ultrathin layers having the size of 50÷60 nm by
specialized knife Leica Ultracut S microtome, then take TEM image
at acceleration voltage of 80 kV.
2.2.6. Field Emission Scanning Electronic Microscopy
Was done on high resolution Model HITACHI S-4800, Japan,
acceleration voltage of 5 kV.
3
2.2.7. Energy Dispersive X-rays
Was determined on Model HORIBA 7593H (England).
2.2.8. Infrared Spectroscopy
FT-IR spectrum was recorded by TENSOR II (Brucker) with
wave number from 4000 cm-1 to 400 cm-1 at atmospheric temperature.
2.2.9. Thermal Analysis
* Thermogravimetry analysis (TGA): Use NETSZSCH STA 409
PC/PG (Germany), in nitrogen and atmosphere, heating rate of 10
o
C/min.
* Differential Scanning Colorimetry (DSC): Was done on Netsch
DSC 204F1, in nitrogen, temperature range 30–300 oC with the
heating rate of 5, 10, 15, and 20 oC/min.
2.2.10. Dynamic Mechanical Analysis
Was done on DMA-8000 (Perkin Elmer, America) by single
bending method, with heating rate of 4 oC/min, temperature range
30-200 oC, vibration frequency 1 Hz.
2.2.11. Determine toughness and destroying energy
Fracture toughness of the sample was determined following the
standard ASTM D 5045-99 on LLoyd 500 N (England), the stress
applied rate of 10 mm/min at room temperature.
2.2.12. Determine bending strength
Was determined following ISO 178:2010 on Instron 5582-100 kN
(England), bending rate of 5 mm/min.
2.2.13. Determine tensile strength
Was determined on Zwick (Germany) following ISO 527-1:2012
with the dragging rate of 5 mm min.
2.2.14. Determine impact resistance
Was determined following ASTM D6110 on Ray Ran (America).
Each sample was measured six times and take the average.
2.2.15. Determine Interlaminar Fracture Toughness
Was determined following ASTM D 5528-01 [85], on Lloyd 500
N (England) with the interlaminar pull off rate of 2 mm/min.
2.2.16. Preparation of the samples
4
2.2.16.1. Modify nanosilica
Weigh nanosilica in the beaker, adding toluen and stir thoroughly
at the speed 21.000 round/min for 5 minutes, then sonicate the
mixture for 10 minutes. Adding slowly KR-12 with different
contents (5; 10; 15; 30; 45 % compared to nanosilica) into the system,
repeat the process of stirring and sonicating 3 times. Then, the
mixture was separated from the solvent by centrifuging with the
speed of 7000 round/min, obtaining the gel then using toluen to wash
KR-12 that does not react, the process was repeated 3 times then dry to
remove toluen at 90 oC for 24 hours.
2.2.16.2. Prepare nanocomposite based on epoxy and m-nanosilica
Mix thoroughly epoxy YD-128 and m-nanosilica with different
contents by mechanical stirrer, adding curing agent TBuT with the
studying ratio, then pour into the mold that has been cleaned and
anti-stick. Curing process was done at different temperatures and
times then machined to determine mechanical properties (tensile
strength, bending strength, impact resistance).
2.2.16.3. Prepare epoxy with different curing agents
Weigh epoxy resin and curing agents into beakers, with the
composition given in Table 2.1, stir the mixture for 5 minutes then
vacated to remove bubble. The mixture was poured into the mold
(clean, antistick) curing and determining mechanical stability.
Table 2.1. Composition of epoxy resin and curing agents
Resin – curing
Epoxy
Curing
Curing condition
agent
YD128, g
agent, g
EP-TBuT
100
5-20
3 hours 150 oC
8 hours (25 oC); 10
EP-PEPA
100
20
hours (70 oC)
8 hours (25 oC); 10
EP-TETA
100
10
hours (70 oC)
8 hours (25oC); 10
EP-mPDA
100
10
hours (70 oC)
5
2.2.16.4. Manufacture composite epoxy/m-nanosilica/TBuT/glass
fiber
m-nanosilica was dispersed in epoxy resin YD128 with the ratio
0÷7 % by weight, then add 15 fraction per weight (pkl) of curing
agent TBuT. Glass fiber was dried 100 oC for 3 hours to remove
moisture. Epoxy resin or epoxy-nanosilica were prepared as in 2.3.2.
Glass fiber was cut into rectangle sheet having the size (150 x 200)
mm then put layer by layer in the mold and pour the resin with the
different ratios of glass fiber/resin. Distribute the resin to permeate
into the fiber by roller and brushes. The samples of composite was
then cured at 120 for 3 hours in vacuum dryer.
CHAPTER 3. RESULTS AND DISCUSSION
2.1. Determination of coupling efficiency of KR-12 onto
nanosilica nanosilica.
The reaction of KR-12 with the surface of nanosilica is
described in Figure 3.1.
Carried out in Toluen
Fig. 1. Functionalization of silica nanoparticles with tiatanate agent
The result reveals that easy methodology for functionalization of
SiO2 nanoparticles with titanate agent KR-12 in toluene solvent. The
surface reaction was found to be rapid, less energetic demanded thus
6
less depends on reaction temperature and completes in a short
reaction period. The loading amount of titanate was found to be
strongly depending in relative concentration of titanate agent.
Grafting efficiency was determined via thermal analysis, the
appropriate content of KR-12 to modify nanosilica is 15 % in weight
After the period of 45 minutes , the efficiency of 13,16%.
3.1.1. Size Distribution
Size distribution of nanosilica and modified nanosilica
was expressed in Figure 3.2, in which nanosilica modified
by 0–15 wt.% of KR-12 correspoding to U-SiO2, SiO2-KR.12 (5),
SiO2-KR.12 (10) and SiO2-KR.12 (15), respectively. Before being
modified, the size distribution of silica (U-SiO2) was not
homogeneous with large particles (the average particle size was
found at 656.7 nm (72.7%) and5078 nm (27.3%)) due to the
aggregation of nanosilicaparticles during storage. When using
titanate coupling agent to modify nanosilica, the size distribution
after stirring and sonicating indicated the much smaller size than in
the case of unmodified nanosilica. The particle size of nanosilica has
a tendency of reduction symmetrical arcording to the amount of
titanate coupling agent KR-12 grafted onto nanosilica surface. For
nanosilica modified by 5 wt.% of KR-12 (SiO2-KR.12 (5)), the
average particle size was 408.8 nm(99.7%) and 4962 nm (0.3%),
nanosilica-KR-12 (10), the particle size was decreased to 149.5 nm,
and for nanosilica modified by 15 wt.% of KR-12 (SiO2-KR.12 (15)),
there was only 1 peak corresponding to size distribution by intensity
peaks at 84.58 nm. This demonstrated that the use of titanate
coupling agent KR-12 plays important role in increasing the
dispersiveness of nanosilica by reacting with hydroxyl groups on the
surface to form a polymer layer preventing aggregation of nanosilica.
Surface modification followed by stirring and sonicating helps to
decrease the size of the particles to the nano scale.
7
3.1.2. Morphology of unmodified nanosilica and modified
nanosilica
Morphology of nanosilica and nanosilica modified by
titanate coupling agent KR-12 were pererformed in Figures 3.2 and
3.3. Figure 3.2 indicated nanosilica particles of solid sphere with the
heterogenous size ranging from 20 nm to 30 nm. However, the
formation of hydrogen bond between molecules of nanosilica
particles has a tendency to aggregate into clusters with the larger size
of 600–1000 nm as determined by laser scattering.2 It is the
aggregation during storage that limits the application of
nanosilica. After being modified by titanate coupling agent KR-12,
incorporated with stirring and sonicating, silica nanoparticles had
much more smaller size than 100 nm (Fig. 3.3). The agglomeration
of nanosilica modified by KR-12 decreases remarkably due to the
physical interactions between the nanoparticles is instead of chemical
interactions between nanosilica and KR-12. This can be explained
due to the surface of nanosilica had been covered by a layer of
organic titanate that increased the hydrophobicity as well as
decreased the surface energy of nanosilica. Here may be the KR-12
layer thickness on the surface of modified silica is too thin, thus, this
can not see morphology of KR-12 on these TEM images.
Figure 3.2. TEM image of unmodified nanosilica
8
Figure 3.3. TEM image of modified nanosilica
3.2. Influence of Silica Nanoparticles on Changes in the Physical
State and Viscosity of the Epoxy/m-Nanosilica Systems
The content of silica nanoparticles had a strong effect on their
dispersion in the epoxy matrix, characteristics, and properties of
the cured epoxy–nanosilica–TBuT nanocomposites. Table I presents
the weights of the components in the epoxy–nanosilica systems and
the changes in the physical state and viscosity (at 25 oC) of the epoxy
with and without silica nanoparticles.
Table 3.1. Viscosities of the Epoxy/nanosilica systems
Physical
Viscosity
Samples Epoxy, g Nanosilica, g
state
25 oC, cP
Epoxy
100
0
Liquid
53,509
Unmodified nanoslica (u-nanosilica)
EP-SiO2
EP-N1
EP-N2
EP-N3
EP-N4
EP-N5
EP-N6
EP-N7
99
1
Gel
Modified nanoslica (m-nanosilica)
Liquid
99
1
98
2
Liquid
Liquid
97
3
Liquid
96
4
95
5
Liquid
94
6
Gel
Gel
93
7
9
69,256
145,873
256,923
546,345
803,823
-----
As shown in Table I, epoxy resin containing 1 wt % unmodified
silica nanoparticles was formed in the gel state; this led to difficulty
in the combination of epoxy, unmodified silica nanoparticles, and
hardener to form cured nanocomposites. This phenomenon was due
to the fact that the silica nanoparticles had a very high specific
surface area (> 200 m2/g) and contained a large number of hydroxyl
groups on the surface, which interacted strongly with the hydroxyl
and epoxy groups in the epoxy resin. In the case of silica
nanoparticles modified by the KR-12 titanate coupling agent (mnanosilica), the dispersion ability of mnanosilica into the epoxy
matrix influenced the viscosity of the epoxy–nanosilica systems. At
contents of 1–5 wt % m-nanosilica, the epoxy resin was still in the
liquid state.
The viscosity of the epoxy–m-nanosilica systems increased
rapidly with increasing mnanosilica content and reached a maximum
value of 803.823 cP at 5 wt % m-nanosilica. This could be explained
by the organic layer grafted onto the surface of the silica
nanoparticles, which led to the reduction of interactions between the
hydroxyl groups (Si─OH) on the surface of m-nanosilica and
hydroxyl and glycidyl groups in the epoxy;
3.3. Study factors affecting on the curing process of YD-128 epoxy
resins by TBuT
The effect of temperature, time, and curing agent on curing
process is assessed through variations in the glass transition
temperature and mechanical strength of the sample. The results were
shown in Figure 3.4, which has determined the appropriate curing
conditions for YD-128 epoxy resins by TBuT curing agent as follows:
Curing temperature: 150 oC; time: 180 minutes; Curing content: 15
phr. After solidification, the glass transition temperature of 123.6 oC;
flexural strength 88.7 MPa; impact resistance of 19.71 J/m2.
10
Flexural strength, MPa
Flexural strength, MPa
Tg, oC
Temperature, oC
Tg, oC
Flexural strength, MPa
Time, min
TBuT content, %
TBuT content, %
Figure 3.4. Influence of temperature (a), time (b), content of curing
agent (c) on mechanical strength and glass transition temperature of
epoxy-TBuT system
11
3.4. The effect of nanosilica on the kinetics and properties of the
epoxy resin system cured by TBuT
3.4.1. Effect of m-nanosilica on the curing temperature of epoxyTBuT system
The gel content (GC) of the cured epoxy–5 wt % m-silica–TBuT
(EP–N5) nanocomposite was used to evaluate the effect of mnanosilica on the curing of epoxy chains by TBuT in the temperature
range 80–180 oC. It was obvious that the GC of the neat epoxy
increased rapidly with increasing reaction temperature from 80 to
150 C. This could have been caused by the energy supplied to the
curing reaction of the neat epoxy, which was smaller than that at
lower temperatures; thus, it was not sufficient for the curing reaction
to take place completely. This led to a lower network density and a
lower GC of the cured neat epoxy. The GC reached a highest value
of 98.9% (near completely) at 150 oC and increased insignificantly at
curing temperatures above 150 oC. When 5 wt % m-nanosilica was
added into the epoxy resin (EP–N5), the GC of the cured EP–N5
nanocomposite increased rapidly with increasing reactiontemperature
from 80 to 120 oC and reached a value of 98.4%. Then, it was nearly
constant at a reaction temperature of more than 150 oC.
3.4.2. Active energy and kinetic of curing epoxy and epoxy/m-silica
by TBuT
The active energy (E) of the curing process of epoxy / TBuT,
unmodified nanosilica/epoxy/ TBuT and epoxy/m-silica/TBuT were
determined according to Flynn-Wall-Ozawa (3.1) and Kissinger (3.2)
equation, from differential scanning calorimetry data. The results are
presented in Table 3.2
[
(
2
p
)
p )
)
]
(
2
p
12
)=
p
) (3.1)
(
) (3.2)
Table 3.2. The active energy (E) of the curing process of
epoxy/TBuT, unmodified nanosilica/epoxy/ TBuT and epoxy/msilica/TBuT
Samples
EFlynn-Wall-Ozawa
EKissinger
Eave
Epoxy/TBuT
Epoxy/5%
unmodified
nanosilica/TBuT
Epoxy/5% mnanosilica/TBuT
69,614
66,171
67,893
63,3
59,75
61,53
52,87
48,94
50,91
When nanocomposite system using m-nanosilica, the activation
energy of the system is significantly reduced. This may be due to the
catalytic effect of nanosilica for the epoxy curing reaction. With
unmodified nanosilica, the activation energy of the curing reaction
decreased by 4.59 (kJ/mol), on the other hand, m-nanosilica
nanosilica showing a significant decrease of the activation energy to
15.02 (kJ/mol). The reason due to the unmodified nanosilica particles
have the phenomenon of coherence, so only a part exists in nano size
with catalytic effect. In case of m-nanosilica particles, they exist
commonly in nano form with an average particle size of about 30 nm,
so they have a larger catalytic effect, significantly reducing the
activation energy of the curing reaction.
3.4.3. Morphology of nanocomposite materials
TEM images show that, when not modified, nanosilica particles
are distributed in the aggregate state, with micron size. m-nanosilicas
are well dispersed in epoxy resins, the particles exist in the nanoscale
with sizes in the range of 30 ÷ 60 nm. When the content of mnanosilica is greater than 5%, (EP-N7 sample) shows the aggregation
of some nanoparticles forming large clusters with the size of about
600 nm, corresponding to the state transition of the sample when not
solidified from liquid to gel form. This phenomenon is due to the
high concentration of m-nanosilica, the gap between the
nanoparticles is narrowed, which increases the interaction between
them, resulting in agglomeration and gelatinization.
13
Epoxy-unSiO2
Epoxy
EP-N5
EP-N7
Figure 3.5. TEM image of epoxy/ m-nanoslica nanocomposite with
different content of m-nanosilica
3.4.3. Effect of m-nanosilica content on tensile and flexural
strength of epoxy / m-silica / TBuT nanocomposite materials:
Mechanical strength was evaluate by impact strength and
flexural strength, these factors can reflect the toughness of a material
indirectly. The result was shown in fig 3.6. As can be seen in fig 1 (a)
the impact strength of epoxy/silica nanocomposite was significantly
increased with the addition of nanosilica particles. As an increase in
the nanosilica content to 5.0 wt%, the impact strength reached a
maximum value 36.95 kJ.m-2. Similarrly, in fig 1 (b) the flexural
strength reached 116.6 MPa when the mass content of nanosilica was
5.0 wt%, which represented increase of 87.47% and 31.45%
compared with that of pure epoxy resin. The improved mechanical
strength could be attributed to nanosilica particles were dispersed
well into epoxy resin and the composite exhibited good interfacial
bonding, during the fracture process of nanocomposite, the extener
force dissipated to interfacial debonding between the nanosilica and
14
epoxy matrix, otherwise nanosilica
particles promoted the
generation of shear yielding. Interfacial debonding combine with
shear yielding consumed a large amount of energy during
deformation then the nanocomposite displayed higher strength.
Flexural strength (MPa)
140
Impact strength (MPa)
40
30
20
10
120
100
80
60
40
20
0
0
0
5
Nanosilica content (wt%)
10
0
5
10
Nanosilica content (wt%)
Figure 3.6. Impact strength (a) and flexural strength (b) of
epoxy/silica nanocomposite
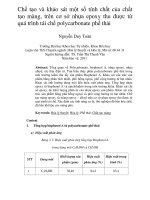
3.4.4 Fracture toughness and fracture energy of nanocompozit
epoxy/m-nanosilica/TBuT
Fracture toughness is a measure for the ability of a material to
resist the growth of pre-existing cracks or flaws. Figure 3.7 and the
fracture toughness (KIC), fracture energy (GIC), modulus of elasticity
(E), and Poisson’s ratio (µ) of neat epoxy and epoxy/m-nanosilica
composites loading different m-nanosilica content.
700
2
600
1,5
GIC (J/m2 )
KIC (MPa.m1/2 )
2,5
1
0,5
500
400
300
200
100
0
0
0
5
10
Nanosilica content (wt%)
0
5
10
Nanosilica loading (wt%)
Figure 3.7. Fracture toughness (KIC), fracture energy (GIC) of neat
epoxy (a) and epoxy/m-nanosilica composites
15
In case of neat epoxy, the determined fracture toughness value
was 1.06 MPa.m1/2, which correlates well with published literature
for epoxy materials [2]. The addition of m-silica nanoparticles into
the epoxy matrix causes an increase in fracture toughness (KIC) of the
composites and a maximum value of 1.73 MPa.m1/2 at 5.0 wt.% mnanosilica, which corresponds to a 91.51% increase in fracture
toughness, compared with that of neat epoxy. At higher nanosilica
content, the enhancement in KIC epoxy/m-nanosilica was diminished
and at 7 wt. % m-nanosilica, the KIC of composite was reduced to
1.45 MPa.m1/2. This can be also explained by agglomeration of msilica nanoparticles, the appearance of agglomerates in epoxy matrix
reduced the effective volume fraction of m-silica nanoparticles and
net surface area. Therefore, the KIC of epoxy/m-nanosilica composite
was reduced. The relationship between elastic modulus (E) and
fracture toughness (KIC) of the composites is reflected in the equation:
GIC =
[(1 - µ2)]/E,
where µ is the Poison’s ratio, E value is obtained from the tensile test.
The fracture energy (GIC) quantifies the energy required to propagate
the crack in the material. Figure 4b indicated the GIC of neat epoxy
was 243 J/m2, which typically shows relatively low values of the GIC
for brittle polymers. The incorporation of m-silica nanoparticles into
the epoxy caused a significant increase in the composite’s GIC up to
660 J/m2 at 5.0 wt.% m-nanosilica, corresponding to 171.6%
increase in fracture energy. This improved critical energy release rate
for the epoxy/m-nanosilica composites is comparable to that of tough
polymers.
These results expressed the potency of m-silica
nanoparticles in toughening of the epoxy resin.
3.4.5. Effect of nanosilica on fire resistance and fire resistance
mechanism of nanocomposite epoxy / m-nanosilica / TBuT
The LOI of nanocomposite epoxy / m-nanosilica / TBuT materials
depends on nanosilica content as shown in Figure 3.8.
The results showed that the LOI value of the material increased
16
gradually with the increase of nanosilica content, the EP-N7 sample
had the highest LOI value of 27.4, increasing by 1.21 times
compared to the neat epoxy resin. In the presence of m-nanosilica,
the material's ability to inhibit combustion has increased significantly.
The cause of the increase in LOI is explained by the formation of a
nanosilica layer on the combustion surface that prevents the
penetration of oxygen into the material
Figure 3.8. LOI of epoxy resin and nanocompozit epoxy/mnanosilica/TBuT
SEM image of the nanocomposite and epoxy resin surface in
Figure 3.9 shows that there is a tight layer of nanosilica on the
surface of the sample after decomposition, the distribution of
nanosilica particles is quite even with a size of about 30-80 nm, this
layer of material prevents the subsequent permeability of oxygen and
heat to decompose the polymers, so that nanocomposite has a LOI
value higher than the neat epoxy resin. The aggregation of particles
creates a micron-sized structure.
EP-N1
EP-N5
17
EP-N7
EP-N0
Figure 3.9. SEM image of epoxy resin and nanocomposite surface
after thermal decomposition
3.5. Fabrication and study of properties of epoxy/m-nanosilia/
TBuT/glass fiber composites
3.5.1. The effect of nanosilica on the mechanical properties of
composite materials
The effects of nanosilica on the mechanical strength of
composites are shown in Table 3.3. The results showed that when
adding m-nanosilica, the mechanical strength of epoxy/ TBuT glass
fiber composites increased significantly. The appropriate content of
m-nanosilica is 5%, corresponding to an increase in tensile strength
of 35.38%, a flexural strength of 15.68%, and an impact strength of
31.78% when compared to composite without m-nanosilica. The
reason is explained by the presence of nanosilica bond which will
increase the bonding capacity of the resin and fiberglass to improve
the mechanical strength of composites.
Table 3.3 Effect of m-nanosilica on mechanical strength of
composites based on epoxy/nanosilica/glass fiber
compozit Epoxy-nanosilica-glass fiber
Fiber
Tensile
Flexural
Impact
glass
Nanosilica
strength,
strength,
strength,
/resin
content, %
MPa
MPa
kJ/m2
60/40
0
281,3±9
315,7
141,0
60/40
1
332,8±6
348,0
157,41
60/40
3
357,5±7
353,1
165,13
60/40
5
380.9±7
365,2
185,81
60/40
7
313,9±5
289,4
153,11
18
3.5.2. Effect of reinforced fiber content on mechanical strength of
composite materials
Tensile strength, flexural strength and impact strength of
composite materials are presented in Table 3.4. The results showed
that these values of strength of composite increased when increasing
the content of reinforced glass cloth and reached a maximum at 60%
of mass, corresponding to increased tensile strength of 399.21% of
flexural strength increased by 227, 24%, impact resistance increased
by 402.87% when compared to epoxy resin. The reason is explained
by the fact that fiberglass has great strength and stiffness, so
gradually replacing epoxy in composite will improve the tensile and
bending strength of composite. However, when exceeding 60% of
the fabric, the amount of plastic is not sufficient to wet the fiber so
the durability of the composite is reduced. When compared with
composites without reinforced nanoparticles, the presence of mnanosilica increased to 35.38% of the tensile strength value, 31.78%
of flexural strength, impact strength increased by 31.78. This is due
to the presence of nanosilica improves the adhesion interaction
between the resin and the fiber until subjected to external forces,
destructive stress will be evenly distributed in composites, base and
reinforcement phases to maximize efficiency to increase mechanical
Table 3.4. Mechanical strength of epoxy/m-nanosilica/TBuT
composites/glass cloth depend on glass cloth content
Mechanical properties of composite epoxy/mnanosilica/TBuT/glass fiber
Conten
Tensile
Flexural
Impact
t fiber
strength,
strength,
GIC, kJ/m2
strength, J/m
(%)
MPa
MPa
0
76,3 ±4
111,6 ± 5,1
36,95±5,21
645 ± 11
30
164,6±5
189,1±4,3
161,62±4,13
664±10
40
246,7±9
212,5±9,2
167,34±5,26
729±9
50
341,5±8
303,4±6,4
173,78±3,35
965±15
60
380,9±7
365,2±9,3
185,81±5,16
1144±12
70
297,3±9
288,0±8,2
139,59 ±3,28
505±15
Compozit epoxy/glass fiber
60
281,35±1
315,7±12
141,03±5,43
845±11
19
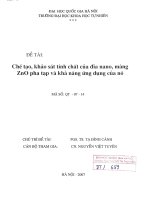
3.5.3. Interlaminar fracture toughness of composite
The result of interlaminar fracture toughness shows that at low
fabric content 30 ÷ 40%, the GIP value of composite does not change
much as compared to the original resin. When increasing the fabric
content to 50 ÷ 60% of the GIP value increases and reaches a
maximum at 60% of the fabric, corresponding to the 1144 kJ/m2
tensile strength increased by 77.36% compared to the modified
epoxy resin. However, when increasing to 70% glass cloth, GIP
decreased rapidly to 505 kJ/m2. The reason is explained by at the
content of 50-60% of fiber, energy destroying epoxy resin, it also
needs to destroy the adhesion interaction between epoxy-nanosilica
resin and glass fiber, this process requires a lot of energy. far more
than the original epoxy resin, which increases layer separation
strength. When increasing to 70% of fibers, the small amount of
plastic is not sufficiently wet to absorb the fiber surface, reducing the
resin/fiber adhesion interaction, facilitating the propagation of cracks
leading to the reduction of GIP value.
Figure 3.10. Influence of glass cloth content on the interlaminar
fracture toughness of composites
When compared with unmodified resins with the same fiber
content, the GIP value of nanosilica composites significantly
increased to 35.38%, K Thunhorst and Kinloh studies have shown
20
that in the presence of m-nanosilica increases the mechanical
strength, destructive toughness of the nanocomposite system, and
enhances the adhesion interaction with the glass fiber surface,
leading to increased tensile destruction of nanosilica-containing
samples, this allows to expand the application areas of epoxy resins.
3.5.4. Influence of m-nanosilica on the dynamic mechanical
properties of epoxy/ m-nanosilica/ TBuT / glass fiber composites
The change of the storage modulus of the composite material
with different fiber content is shown in Figure 3.11.
The storage modulus of the material increases significantly and
reaches its maximum at the V/N of 60/40 corresponding to the
module E value increasesing of 588.59% compared to the base resin.
The increasing in module E 'value is due to the presence of
reinforced glass with greater strength and stiffness than many
polymers, and shows the uniform distribution of stress acting on the
clear phases. material, which means that there is a good adhesion
interaction between the resin and reinforced fibers.
Figure 3.11. Dependence of storage module of composite with
different glass fiber content on temperature
The variation of the loss module depends on the temperature of
the composite material shown in Figure 3.12. The results show that
21
the E value of the composite is much larger when compared to the
original epoxy resin, this may be because when combined with the
glass fiber, it restricts the recovery process of the material. The
maximum loss modulus of composites occurs at the
glass transition temperature of the material.
Figure 3.12. Dependence on the loss modulus of composite on
temperature
Effect of m-nanosilica on tanδ of composite materials
Figure 3.13 shows the change in tanδ depending on the
temperature of composite with different reinforced fiber content. The
results showed that the tan of the composite material increased with
the increase of temperature and reached the maximum value in the
glass transition temperature zone, continued to raise the value of tanδ
moved to the rubber state. The tan tan of the composite is small when
the content of fiberglass is much larger and bigger than the epoxy
resin because in the composite, the glass fiber will be affected by
most stresses, only a small area on the fiber at the dividing surface.
mixed with deformed plastic background. Therefore the energy
dispersion will occur mainly on the polymer substrate and at the
plastic-fiber phase separation surface and is characterized by low
energy dispersion.
22