Antecedents of customers evaluation on service value towards using mobile value added services
Bạn đang xem bản rút gọn của tài liệu. Xem và tải ngay bản đầy đủ của tài liệu tại đây (948.82 KB, 81 trang )
UNIVERSITY OF ECONOMICS HO CHI MINH CITY
International School of Business
------------------------------
VO THI THUY KHA
ANTECEDENTS OF CUSTOMER’S EVALUATION
ON SERVICE VALUE TOWARDS
USING MOBILE VALUE-ADDED SERVICES
MASTER OF BUSINESS (Honours)
Ho Chi Minh City – Year 2014
UNIVERSITY OF ECONOMICS HO CHI MINH CITY
International School of Business
------------------------------
VO THI THUY KHA
ANTECEDENTS OF CUSTOMER’S EVALUATION
ON SERVICE VALUE TOWARDS
USING MOBILE VALUE-ADDED SERVICES
ID: 22130033
MASTER OF BUSINESS (Honours)
SUPERVISOR: DR. PHAM NGOC THUY
Ho Chi Minh City – Year 2014
iii
ACKNOWLEDGEMENTS
Firstly, I would like to express my sincere gratitude to Dr. Pham Ngoc Thuy, my
Supervisor, who has given me great guidance, inspiration and especially her
motivation, thanks for her valuable advice, suggestions and resources that helping me
in accomplishing this study.
Secondly, I would like to express my sincere thanks to all professors, tutors and
officers of MBus Program for valuable lectures, academy knowledge and your
experiences transfer throughout the period of courses at International School of
Business.
I want to express my special thanks to all my colleagues, friends in telecom industry
for your advice, cooperation and supports during the pilot and official survey. Without
your support, I could not successfully complete my thesis.
Ho Chi Minh City, Vietnam,
30th Sep, 2014.
Vo Thi Thuy Kha
iv
ABSTRACT
In recent years, the Vietnam telecommunications and information technology has a
growth with a number of important and new achievements. And mobile telecom sector
has grown larger and stronger. Besides, there is a strict competition among enterprises
in seizing mobile phone market shares. And each enterprise has a strict competition
among kinds of services in which mobile service has highest revenue. The core
services of mobile providers are the same. Therefore, mobile telecom operators are
looking at “Mobile Value Added Services” (M-VAS) as the next wave of growth to
create the wake of changing markets, and most of revenues are expected to flow from
VAS in the near future.
This fact has encouraged the author to conduct the research and assess the impact level
of customer perceived value on customer loyalty when using mobile value added
services in Vietnam, is done through qualitative and quantitative methods. The survey
has been distributed to 210 customers. There were 184 valid responses out of 191
responses received. The Cronbach's Alpha model has been invoked in order to test the
reliability of collected data. The factor analysis, multiple regression have been used for
determining the key factors that affect to customer perceived value, customer loyalty.
Test results obtained show that three hypothesizes are supported, a hypothesis is not
supported and a hypothesis is not tested because of some unbalanced groups of gender
and age limitations in samples.
Based on the findings, suggestions and managerial implications will be provided in
order to improve the quality of using mobile value-added services to achieve the
higher level of customer perceived value and customer loyalty and provide managers
with a basis for options to develop new services appropriate to objectives and strategic.
Due to limited time and resource, the scope of study is delineated to customers who
are living in Ho Chi Minh city for research.
Key words: Perceived Value, Perceived Usefulness, Corporation Image.
v
Table of Contents
ACKNOWLEDGEMENT ..................................................................................................................... 0
ABSTRACT ............................................................................................................................................ 0
CHAPTER 1 – INTRODUCTION ....................................................................................................... 1
1.1 RESEARCH BACKGROUND ...................................................................................................1
1.2 RESEARCH OBJECTIVES........................................................................................................3
1.3 RESEARCH SCOPE...................................................................................................................3
1.4 RESEARCH METHOD ..............................................................................................................3
1.5 THESIS STRUCTURE ...............................................................................................................3
CHAPTER 2 – LITERATURE REVIEW ........................................................................................... 6
2.1 CHAPTER INTRODUCTION ............................................................................................................6
2.2 INTRODUCTION ABOUT MOBILE VALUE-ADDED SERVICE ..........................................................6
2.3 LITERATURE REVIEW ..................................................................................................................7
2.3.1 Service Reliability ..............................................................................................................7
2.3.2 Perceived Usefulness of Service.........................................................................................8
2.3.3 Corporation Image ..............................................................................................................9
2.3.4 Customer Perceived Value .................................................................................................9
2.3.5 Customer Loyalty .............................................................................................................10
2.3.6 Relationship between Service Reliability and Customer Perceived Value ......................11
2.3.7 Relationship between Perceived Usefulness of Service and Customer Perceived Value .11
2.3.8 Relationship between Corporation Image and Customer Perceived Value ......................12
2.3.9 Relationship between Customer Loyalty and Customer Perceived Value .......................12
2.3.10
Moderating Effects of Gender and Ages ......................................................................13
2.4 RESEARCH MODEL ...............................................................................................................14
2.5 SUMMARY ..............................................................................................................................15
CHAPTER 3 – RESEARCH METHODOLOGY ............................................................................. 16
3.1 INTRODUCTION.....................................................................................................................16
3.2 RESEARCH PROCESS ............................................................................................................16
3.3 RESEARCH DESIGN ..............................................................................................................16
3.4 PRELIMINARY SURVEY.......................................................................................................18
3.5 MEASUREMENT SCALES .....................................................................................................20
3.5.1 Service Reliability. ...........................................................................................................20
3.5.2 Perceived Usefulness of Service.......................................................................................21
3.5.3 Corporation Image. ...........................................................................................................21
3.5.4 Customer Perceived Value. ..............................................................................................22
3.5.5 Customer Loyalty. ............................................................................................................22
3.6 QUESTIONNAIRE DESIGN ...................................................................................................23
3.7 SAMPLING METHOD ............................................................................................................23
3.8 MAIN SURVEY AND DATA COLLECTION ........................................................................25
3.9 DATA ANALYSIS METHODS ...............................................................................................25
3.9.1 Exploratory Factor Analysis (EFA)..................................................................................25
3.9.2 Reliability Analysis ..........................................................................................................26
3.9.3 Multi-linear regression analysis .......................................................................................27
3.10
SUMMARY ..........................................................................................................................27
CHAPTER 4 – DATA ANALYSIS ..................................................................................................... 29
4.1 INTRODUCTION.....................................................................................................................29
4.2 DESCRIPTIVE DATA ANALYSIS .........................................................................................29
vi
4.2.1 Table statistics form .........................................................................................................29
4.2.2 Descriptive analysis of the variables studies ....................................................................31
4.3 MEASUREMENT SCALE ASSESSMENT.............................................................................31
4.3.1 Reliability Analysis - by Cronbach‟s Alpha .....................................................................31
4.3.2 Exploratory Factor Analysis .............................................................................................34
4.3.3 Correlation ........................................................................................................................38
4.4 HYPOTHESES TESTING ........................................................................................................40
4.4.1 Assumption of Multiple Regressions ...............................................................................40
4.4.2 Evaluate and test the relevance of the model ...................................................................40
4.4.3 Testing Hypotheses. .........................................................................................................41
4.5 DISCUSSIONS .........................................................................................................................45
4.6 SUMMARY ..............................................................................................................................47
CHAPTER 5 – CONCLUSIONS AND IMPLICATIONS ............................................................... 48
5.1 MAIN FINDINGS .....................................................................................................................48
5.2 MANAGERIAL IMPLICATIONS ...........................................................................................49
5.3 MANAGERIAL CONTRIBUTIONS .......................................................................................50
5.4 LIMITATIONS .........................................................................................................................51
REFERENCES ..................................................................................................................................... 52
APPENDICES ...................................................................................................................................... 57
APPENDIX 1 – QUESTIONNAIRE IN ENGLISH ..........................................................................57
APPENDIX 2 – QUESTIONNAIRE IN VIETNAMESE ..................................................................60
APPENDIX 3 - DESCRIPTIVE STATISTICS OF ITEMS ...............................................................63
APPENDIX 4 - EFA ANALYSIS RESULTS ....................................................................................64
APPENDIX 5 - RELIABILITY ANALYSIS RESULTS ..................................................................67
APPENDIX 6- MULTIPLE REGRESSIONS RESULTS .................................................................69
vii
List of Tables
Table 4-1: Descriptive Statistics of Sample ...........................................................................................30
Table 4-2: Reliability analysis results. ...................................................................................................33
Table 4-3: Second EFA analysis results for all variables .......................................................................36
Table 4-4: New Factors ..........................................................................................................................37
Table 4-5: Describe the correlation among variable ..............................................................................39
Table 4-6: Multiple Regressions results of model 1, 2...........................................................................42
Table 4-7: Hypotheses Testing Results ..................................................................................................43
Table 4-8 : Summary of hypothesis testing result .................................................................................45
Table 7-1:The First Exploratory Factor Analysis...................................................................................64
Table 7-2The Second Exploratory Factor Analysis ...............................................................................65
Table 7-3: Reliability test for all variables .............................................................................................67
Table 7-4: Reliability Test for Perceived Usefulness of Service and Corporation Image (after the First
Exploratory Factor Analysis) .................................................................................................................68
viii
List of Figures
Figure 1- Research process. .....................................................................................................................5
Figure 2- Proposed Research Model ......................................................................................................14
ix
ABBREVIATIONS
M-VAS:
Mobile Value Added Service
ANOVA:
Analysis Of Variance
EFA:
Explored Factor Analysis
KMO:
Kaiser-Meyer-Olkin
SPSS:
Statistical Package for Social Science
x
1
CHAPTER 1 – INTRODUCTION
This chapter introduces the context of the study, including a short introduction of
telecommunications and information technology industry in Viet Nam, the research
problem, and the research objectives as well as the rationale of the research, the scope
of research.
1.1
RESEARCH BACKGROUND
In recent years, the telecommunications and information technology is growing fast
and strongly. Specially, in Vietnam, it has a growth with a number of important and
new achievements. This is an important point for Vietnam economy affected by the
economic recession. Internet and Telecommunications network infrastructure of
Vietnam has been invested to develop strongly and continuously. And mobile telecom
sector has grown larger and stronger, as an inevitable result of the advantages of
infrastructure. Although the development of the telephone subscribers was saturated,
the numbers of mobile and Internet subscribers continued to grow at a rate of 3,42%
and 2.46%, respectively compared to those in 2011 (WhiteBook, 2013).The
Vietnamese mobile market is one of the fast growing markets with 131.67 million
mobile phone users by 2012 (WhiteBook, 2013), and the overall growth rate in
number of mobile phones subscribers per 100 inhabitants also rose from 86.85% in
2008 to 148.33% in 2012 (WhiteBook, 2013) (rose over 70%). Furthermore, there is
a strict competition among enterprises in seizing mobile phone market shares, with
market shares (subscribers) of 2G and 3G mobile phone service providers: Viettel
(44.05%); MobiFone (21.40%); VinaPhone (19.88%); Vietnamobile (10.74%);
GMobile (3.93%); SFone (0.01%) (WhiteBook, 2013). Besides of the scope of this
competition, each enterprise has a strict competition among kinds of services in which
mobile service has highest revenue, accounted for 6.47 billion USD (76.43%) of total
revenue of Vietnam telecommunications services (WhiteBook, 2013). This is the main
reason helping telecom market growth. The core services of mobile providers are the
same. Therefore, telecom operators are looking at “Mobile Value Added Services”
(MVAS) as the next wave of growth to create the wake of changing markets, and most
1
of revenues are expected to flow from VAS in the near future. At a time when the
industry is facing a steep fall in voice tariffs, Mobile Value-Added Services (MVAS)
are considered as growth drivers, source of revenue and key differentiators (Kuo&
Chen, as cited in Jasrai, 2014). It creates a win-win situation for both customers and
service providers as customers are benefitted from digital empowerment and gain
functional and hedonic utility, while service providers get a source of non-voice
revenue (Jasrai, 2014). Hence, this study especially wants to identify factors of
customer‟s evaluation on service value towards using mobile value-added services to
retain customer loyalty. Because, they have a big impact on the customers‟ usage
orientation, and open another way for service operators to become significant
differentiators by innovation in services.
Although previous study has indicated that service quality and customer perceived
value are significant for companies since they are highly correlated with loyalty
(Jafarnejad & Shafie, 2013, p. 529); there are significant and positive relationships
between service quality and customer perceived value (Razavi, Safari, Shafie, &
Khoram, 2012, p.28); Based on the research results, corporate brand image or
reputation significantly affects customer perceived value, customer perceived value
has strong impact on customer loyalty (Tu, Li, &Chih, 2013, p.469). Previous
researchers have indicated that service quality, customer perceived value, and
satisfaction are some of the key success factors in gaining competitive advantage
within service providers (Bolton & Drew et al., as cited Hu (Sunny), Kandampully &
Juwaheer, 2009, p. 111) and a study about a model of perceived value (Duman, 2002).
There are also many studies about technology acceptance model (TAM) for internet
service (Lu, Yu, Liu, & Yao, 2003; Nguyen, 2007), for social networks (Pinho &
Soares, 2011). With rapid increase of users of mobile telecommunications services in
the past year, the growth rate of the market of mobile telecommunications services
currently has developed significantly, each mobile service suppliers make the
distinctive business strategy to expand and protect their market share in Vietnam. And
now, mobile telecom service is nearly the hottest service of telecom market. Therefore,
2
this paper wants to learn more about the relationship between factors of customer‟s
evaluation on service value in using mobile added value services to be able to supply
more mentions for mobile telecom providers.
1.2
RESEARCH OBJECTIVES
This research is aimed to:
- Identify the antecedents of customer perceived value towards mobile value - added
services.
- Measure the impact level of customer perceived value on customer loyalty.
- Analyze the different impact levels of these relationships between customer groups
of gender (male and female) and ages (young and older).
1.3
RESEARCH SCOPE
This study is conduct in Ho Chi Minh City, is one of the largest cities of Vietnam and
also the National Center for Education, Science, Technology and Health Care. This
study focuses the Ho Chi Minh Citizens who are using value-added services on mobile
phone devices. The providers related to this service in current market such as Viettel,
MobiFone, VinaPhone, Vietnamobile, GMobile, SFone, however Sfone has currently
halted in providing services.
1.4
RESEARCH METHOD
The research in this paper applies the mixed method, including both qualitative and
quantitative methods. This paper was designed in two phases: a pilot study and main
survey.
- A pilot study was conducted in order to design the questionnaire, determine the
sampling population and to preliminarily test the measures before launching a main
survey.
- A main survey was conducted in order to collect data for testing mainly proposal
hypothesizes and model.
1.5
THESIS STRUCTURE
The structure of the thesis is presented in order to provide the overview through this
thesis. This thesis organizes in five chapters.
3
Chapter 1 is the introduction chapter, this chapter describes the overview of
research background, research problem, research objective, the scope of research,
and structure of thesis are also present.
Chapter 2 presents the theoretical basis of the concepts involved, theoretical
modeling with the proposed hypothesis.
Chapter 3 introduces the research methodology to test the scale and theoretical
models in previous session.
Chapter 4 presents the results of the implementation of the testing and analysis of
information and data received, its reliability and multiple regressions from which to
draw conclusions for the research hypotheses proposed in Chapter 2.
The last chapter, chapter 5 discusses the results and research finding. This chapter
concludes conclusion, implication, and also mentioned the limitations of research
to guide subsequent studies.
References and appendixes are included in the end of thesis.
4
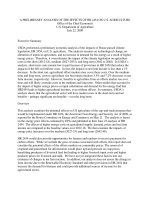
Figure 1- Research process.
5
2
2.1
CHAPTER 2 – LITERATURE REVIEW
Chapter Introduction
This chapter presents reviews of relevant literature related to criteria and factors of
customer perceived value through M-VAS. Throughout this chapter, variables will be
established and grouped into relevant factors. This chapter also mentions some
previous studies and experiences related to the research topic.
2.2
Introduction about Mobile Value-added Service
Telecommunication industry is always looking for other services beyond standard
voice service or mobile value-added-services to improve level of development,
because value-added service has become a lever for growth of mobile service
operators. The telecom sector readies to use MVAS as a tool to stimulate growth and
simultaneously create an important differentiator. According to Boston Analytics
(2007), Mobile Value Added Services (MVAS) are those services that are not part of
the basic voice offer and are separately availed by the end user. They are used as a tool
for differentiation and allow mobile operators to develop another stream of revenue.
Value-added-services conventionally defined as enhanced services, which add value to
the standard or core tele-services offerings like voice calls and fax transmission (VAS,
2012). Jasrai (2014) also showed that MVAS refers to additional services provided by
the telecom operators excluding voice communication that allow customers to get
entertained and informed through their mobile phones. The VAS in mobile telecom is
in the form of voice mail, digital or any other method that is directly or indirectly paid
by the end-user. Some services like MMS on mobile phones, data access, and callrelated services were usually considered value-added services. Nowadays, services
like SMS, ringtones and caller ring-back tones create large revenues from VAS
provided by the current mobile telecom providers. According to The Mobifone (2014),
portfolio of mobile value added services can be listed by groups as follows:
Internet 3G: Mobile TV, Video call, BizMail, FastMail, Voice Mail,…
Entertainment: MobiFun Live, MobiChat, LiveScore, Wapportal, Game,..
Information: LiveInfo, MSearch, …
6
Call support services: National Roaming, International Roaming, Short Message
Service Roaming, Multimedia Messaging Service , Missed Call Alert, Global
Saving, Music Talk, Voice Short Message Service, Call Me, FunRing,…
2.3
Literature Review
First of all, key concepts in the current study such as Service Reliability, Usefulness
of Service, Corporate Image, Customer Perceived Value, and Customer Loyalty and
their role and importance in business activities will be reviewed.
2.3.1 Service Reliability
Competitive advantages in service businesses can be achieved thanks to provider‟s
ability that can deliver services with high quality. Service quality is a critical issue in
service management (Clottey et al, as cited in Jafarnejad & Shafie, 2013, p.530);
besides, with the development of the service sector, the definition of service quality
has become increasingly significant (Maet al, as cited in Jafarnejad & Shafie, 2013,
p.530). Service quality defined as a consumer‟s judgment about a product‟s overall
excellence (Zeithaml, as cited in Manoj & Sahadev,2011, p.330) is conceptualized as
the consumer‟s evaluation based on the comparison between customer expectations
against perceived performance (Parasuraman et al.; Boltonand, as cited in Manoj &
Sahadev,2011, p.330). And service quality is a customer‟s subjective acknowledge to
quality, and the most important characteristics of quality is to satisfy customer wants
(Juran, as cited in Chi et al., 2008, p.130). Furthermore, because services are
intangibility, inseparability, heterogeneity, and perishability, customers always require
quality guarantees in order to reduce the uncertainty of customer service (Etzel, Bruce,
& William; Kotler, as cited in Chi et al., 2008, p.130). Therefore, it's not surprising
that service quality has been a very interesting field of research for many last years.
Service is typically a complex, multi- dimensional notion (Garvin, as cited in Simons,
2004, p.12). And current article (Seth et al., as cited in Gunawardane, 2011) identified
as many as 19 models that have been developed to explain the dimensions of service
quality. However, according to Berry et al.; Parasuraman et al.; Zeithaml et al. (as
cited in Simons, 2004, p.12) stated that service quality has become widely accepted as
7
a function of five specific dimensions: reliability, responsiveness, assurance, empathy,
and tangibles. Tangibility reflected staff‟s look and costume and equipment to service
customers. Responsiveness expressed the desire of employees are willing to provide
services to customers on time. Assurance represented by professional process,
employee„s ability when servicing customers. Empathy showed caring to customer.
Responsiveness, assurance, empathy, and tangibles are external factors of service.
Reliability is an internal, core factor of service. Therefore, this paper has just
mentioned to reliability. Reliability is the ability to perform the promised service
consistently, dependable, and accurately. It has often been cited as the most important
dimension in assessing the quality of service and is therefore a fundamental
requirement for the businesses to compete in the marketplace (Cook et al., as cited in
Simons, 2004, p.12).
2.3.2 Perceived Usefulness of Service
The technology acceptance model (TAM) was formulated by Davis (as cited in
Malathi & Balakrishnan, 2013, p. 10.) based on the Theory of Reasoned Action, it
shows specifically with the prediction of the acceptability of an information system.
The aim of the model is to explain and predict user acceptance of technology
modifications or information systems. According to Davis (1986), perceived
usefulness (PU) and perceived ease of use (PEOU) are the two important constructs of
technology acceptance. The PU refers to “the degree to which an individual believes
that using a particular system would enhance his/her job performance” (Cheong, &
Park, 2005, p.129; Davis, as cited in Nguyen, 2007, p.362). Perceived usefulness of
M-VAS is defined as the potential user‟s subjective probability that using a specific
application of M-VAS will raise his or her job performance within an organizational
context. Clearly, the more an application improves their effectiveness in an
organizational field, the more it is considered to be helpful. According to a preliminary
survey of Vietnamese users, MVAS is no difficulty in using, in other hand customers
uses it easily. Nowadays, many people use mobile phone from teenager to adult, from
8
worker to officer,.. Therefore, this paper does not mention ease of use, only studies
perceived usefulness concept.
2.3.3 Corporation Image
Corporation reputation is sometimes seen as synonymous with corporation image
(Dawling, as cited in Dolphin, 2004). Early writers appeared to see corporation image
as synonymous with corporation reputation (Kennedy, as cited in Dolphin, 2004).
Corporate image is another important factor in the overall service evaluation (Bitner et
al., as cited in Alireza et al., 2011, p.272). Magid, Anthony& Dena (as cited in Tu et
al., 2013, p.471) reported that brand image was customer responses to brand name,
sign, or impression, and represented the product quality. According to Nguyen &
LeBlanc (as cited in Hu (Sunny) et al., 2009, p.116), image has been described as
subjective knowledge, as an attitude, and as a combination of product characteristics
that are different from the physical product but are nevertheless identified with the
product. Image has been described as the overall impression left on the minds of
customers (Zimmer & Golden, as cited in Hu (Sunny) et al., 2009, p.116). While
MacInnis & Price (as cited in Hu (Sunny) et al., 2009) stated image formation as a
procedure by which ideas, feelings, and previous experience with an organization are
stored in memory. There were other image definitions. Generally, corporate image is a
perception of an organization held in consumer memory and works as a filter which
influences the perception of the operation of the company (Grönroos & Keller, as cited
in Alireza et al., 2011, p.272).Or clearly, corporation image represents the impressions
and associations, the beliefs and attitudes that are held in consumer memory with
regard to the company (Barich &Kotler, as cited in Hu (Sunny) et al., 2009).
2.3.4 Customer Perceived Value
Perceived value is one of most important factors to gain competitive advantage in
business, so perceived value has achieved considerable interest of many researchers. It
is constructed to predict buying behavior (Anderson, &Srinivasan et al., as cited Hu
(Sunny) et al., 2009, p.113). Perceived value has been defined in many diverse ways.
Perceived value is a customer‟s overall assessment of the utility of a product or service
9
based on perceptions of what is received and what is given (Zeithaml, as cited in
Manoj & Sahadev, 2011, p.330; as cited in Hu(Sunny) et al., 2009, p. 114). Buyers‟
perceptions of value represent a tradeoff between the quality and benefits they receive
in the product relative to the sacrifice they perceive in paying the price (Dodds et al.,
as cited in Manoj & Sahadev, 2011, p.330; Monroe, as cited Hu (Sunny) et al., 2009,
p.114). However, related to customer – oriented management, Woodruff (as cited in
Tu et al., 2013, p.470) defined customer perceived value is a process from prepurchase, transaction, and post purchase aspect in use situations. Woodruff (as cited in
Hu (Sunny) et al., 2009, p.114) also defined customer value as a customer‟s perceived
preference for and evaluation of those product attributes, attribute performances, and
consequences arising from use that facilitate achieving of the customer‟s goal and
purchase in use situations. Customer perceived valued is “the difference between the
prospective customer‟s evaluation of all the benefits and all the costs of an offering
and the perceived alternatives (Kotler& Keller, as cited in Chi et al., 2008, p.130).
Perceived value is the consumer‟s perception of utility in comparison to what is
exchanged for a product or service (Zeithaml, as cited in Qayyum, Do &Krairit, 2013,
p.377).
2.3.5 Customer Loyalty
In many industry sectors, customer loyalty is one of the significant factors in finding
revenue of the company. It receives companies and researchers‟ attention because it
can help retailers either gain more financial profits (Babakus et al., as cited in Chen,
Tsai, Hsu, & Lee, 2013,p. 478) or achieve a sustainable competitive advantage
(Bustos-Reyes & González-Benito; Kwon & Lennon, as cited in Chen, et al, 2013, p.
478). The financial services industry show that increasing customer loyalty by 5
percent could lead to 25-75percent profit growth (Chan et al., as cited in Aydin &Ozer,
2005, p. 911). Especially in telecommunications services, it is frequently pointed out
that once customers have been acquired and connected to the telecommunications
network of a particular operator; their long-term relations with the focal operator are of
greater importance to the success of the company in competitive markets than they are
10
in other industry sectors (Gerpott et al., as cited in Aydin &Ozer, 2005, p.911).
According to Oliver (as cited in Aydin&Ozer, 2005; Chen, et al, 2013), customer
loyalty is as a deeply held commitment to re-buy or re-patronize a preferred product or
service consistently in the future, despite situational influences and marketing efforts
having the potential to cause switching behavior. And all these – repurchase intention,
recommendation and resistance to better alternatives – are behavioral intentions and
constitute customer loyalty (Aydin & Ozer, 2005).
2.3.6 Relationship between Service Reliability and Customer Perceived Value
About relationships between service quality and customer perceived value, Bolton and
Drew; Zeithaml(as cited in Razavi et al., 2012, p.30; Manoj &Sahadev, 2011, p.333)
showed that quality of the product or service and the benefits it offers often become
customer perceived value drivers. And many studies support this association.
(Andreassen &Lindestad et al.; Dodds et al. & Oh, as cited
in Razavi et al, 2012,
p.30; Manoj&Sahadev, 2011, p.333). Besides, service quality is an antecedent of
customer perceived value, and it will cause a significant influence on customer
perceived value (Sweeney et al., as cited Chi, Yeh, &Jang, 2008, p.130). In addition,
Bojanic (as cited Chi et al., 2008, p.130) argued that quality is one of determinants of
the customer perceived value. Furthermore, a research supports a positive relationship
between quality and value (e.g. Andreassen &Lindestad et al., as cited in Alireza, Ali,
& Aram, 2011, p. 272). And reliability is one of the dimensions of service quality.
Therefore:
H1: Service reliability positively affects customer perceived value
2.3.7 Relationship between Perceived Usefulness of Service and Customer
Perceived Value
The TAM indicates that perceived usefulness is a significant determinant of behavioral
intention (Davis et al., as cited in Gao, &Bai, 2014), and perceived value is
constructed to predict buying behavior (Anderson, &Srinivasan et al., as cited Hu
(Sunny) et al., 2009). Moreover, according to the innovation diffusion theory (IDT),
users are only willing to accept innovations if those innovations provide a unique
11
advantage compared to existing solutions (Rogers, as cited in Gao, &Bai, 2014). In the
context of TAM, this view is reflected by the perceived usefulness construct. In this
study, perceived usefulness is similar to performance expectancy of the unified theory
of acceptance and usage of M-VAS. When the more M-VAS operators provide a
unique advantage compared to existing, the more buyers‟ perceptions of value
represent a tradeoff between the quality and benefits they receive in the product.
Therefore:
H2: Perceived usefulness has a positive impact on the customer perceived value.
2.3.8 Relationship between Corporation Image and Customer Perceived Value
About impact of corporation image to perceived value, Alireza et al. (2011, p.273)
stated that a positive image makes a consumption experience more gratifying, thus
helping customers experience pleasurable social and emotional benefits. Image was a
significant determinant of customer perceived value and customer satisfaction and Lai
et al. (cited in Ryu, Lee & Kim, 2012) revealed that corporate image affected customer
perceived value, and both customer satisfaction and customer perceived value were
significant predictors of loyalty. They further discovered that customer perceived
value and customer satisfaction mediated the impact of both service quality and
corporate image on customer loyalty. Therefore:
H3: Corporate image has a significant, positive effect on perceived value.
2.3.9 Relationship between Customer Loyalty and Customer Perceived Value
Due to its critical role for financial results, several studiers investigate the antecedents
of customer loyalty and the findings indicate that customer perceived values have
significant impact on customer loyalty (Brodie et al., as cited in Chen, et al, 2013, p.
478). By firm promotion and value-added activities or services, companies are better
and easier to hold on a good relationship after satisfying the customers. From that,
companies enhance customer sustainability, raise market shares and bring revenues
well for firms. Moreover, customer perceived value is a key elementary to decide
customer loyalty (Chu, 2009, p.100; Zeithaml, as cited in Tu, et al., 2013, p.470).
Perceived value is as a major determinant of customer loyalty in such settings as
12
telephone services (Bolton& Drew, as cited in Yang, & Peterson, 2004, p.803).While
perceived value is a super-ordinate target, customer loyalty is a subordinate target
since it is a behavioral intention. Therefore, perceived value arranges the behavioral
intention of loyalty toward service operators (Sirdeshmukh et al., as cited in Qayyum
et al., 2013, p.377). Besides, Bloemer et al. & Jones et al. (as cited in Aydin&Ozer,
2005), have pointed out that there is a positive relationship between service quality and
repurchase intention, recommendation, and resistance to better alternatives. Therefore,
in some empirical studies of the mobile telecommunications industry:
H4: Customer-perceived value will positively influence customer loyalty.
2.3.10 Moderating Effects of Gender and Ages
The present study attempts to increase the reliability by examining some core
demographic variables, they are gender and ages. Gender refers to psychological
features associated with biological sex (i.e. whether one is a women or a man) that are
socially constructed (Deaux, as cited in Yang & Lee, 2010). The moderating role of
gender has been substantially examined in researches undertaken by various workrelated associations (Russ and McNeilly et al., as cited in Gkorezis, Mylonas
&Petridou, 2011). There are apparently different behavioral patterns between men and
women (Coates, as cited in Yang & Lee, 2010). Furthermore, the fundamental
existential sense of one‟s maleness or femaleness has been playing a gender role in
displaying different attitudes and consumer behaviors in responding to various
consumer variables (Palan et al., as cited in Yang & Lee, 2010). Therefore, it is
expected that the gender role will show different usage of MVAS. For example,
Mante&Piris (cited in Yang & Lee, 2010) demonstrated that women used mobile
services more frequently for communication about personal and emotional matters,
while men used the services to accomplish tasks (e.g. for coordinating meeting times
and places). Besides, different group of ages also have different demands in using
mobile service. For example, teenagers use their mobile phones in anytime and
anyplace (even at the dinner table and in the bedroom) to maintain their social
relationships as well as to have fun (Castells et al, as cited in Parreño, Sanz-Blas, Ruiz-
13
Mafé, &Aldás-Manzano, 2013). The demographic variables (including age, gender)
moderate the impact of antecedents on customer loyalty (i.e. satisfaction, perceived
service quality, perceived value, and corporate image (Qayyum, et al., 2013). Hence:
H5: There are different influences of the antecedents on perceived value between male
and female groups, young and older groups. Separately,
H5a: Gender influences on service reliability.
H5b: Ages influences on service reliability.
H5c: Gender effects on Perceived usefulness of service.
H5d: Ages effects on perceived usefulness of service.
H5e: Gender impacts on corporation image.
H5f: Ages impacts on corporation image.
2.4
RESEARCH MODEL
In lines with the research problem, objectives, and hypothesis, the paper assume to
develop the model which shows the relation between each components of customer
evaluation and service value towards mobile value -added service as follows
Figure 2- Proposed Research Model
14
This model shows the relation between Customer-perceived Value and customer
loyalty and the three components of service value including Service Reliability,
Perceived Usefulness of Service, and Corporate Image.
LIST OF HYPOTHESES
Hypothesis
H1
H2
H3
H4
H5
2.5
Statement of Hypothesis
Service reliability positively affects customer perceived value
Perceived usefulness has a positive impact on the customer perceived value.
Corporate image has a significant, positive effect on perceived value.
Customer-perceived value will positively influence customer loyalty
There are different influences of the antecedents on perceived value between male and
female groups, young and older groups
SUMMARY
This chapter presents reviews of relevant concepts, hypothesizes, model based some
previous studies and experiences related to the research topic. The following chapters
will present how we develop measurement scales for each constructs in the research
model. The research methodology and data analysis procedure before having
conclusions for the results of each hypothesis with empirical data
15
3
CHAPTER 3 – RESEARCH METHODOLOGY
3.1
INTRODUCTION
This chapter illustrates the methodology employed in this research. The purpose of this
chapter is to identify more detail about the research process, methods using in
research, sampling design and data collection method, method of data cleaning after
survey. Based on literature review in the previous chapter, this framework also
describes the measurement scales of factors, results of pilot process. In the end, this
chapter also provided methodology for data analysis for this research.
3.2
RESEARCH PROCESS
After the research problem was recognized, the research objectives and research scope
were defined. The literature review was conducted to review all relevant theories so as
to find a suitable conceptual model for mobile value -added service in Viet Nam and
thereby develop its hypotheses. The draft questionnaire was developed from the
consolidation of various questionnaires used in some previous studies of the
extant literature. After pilot study, main study was conducted to collect data. The next
step was data analysis and the last step was conclusion and implication.
3.3
RESEARCH DESIGN
Then moved to a stage of Research Design where the research in this paper
was designed in two phases: a pilot study and main survey. The objective of
qualitative is to explore and clarify the factors impacting customer perceived value,
customer loyalty in using mobile value - added services raised by previous researchers
and adjust to be suitable to Vietnam market. After that, quantitative research to
validate the result in the bigger scope and scale.
Phase
Type
Methods
Subjects
1
Pilot
Qualitative
Managers or employees of
Discussion with 5 –
mobile telecom operators.
10
Customer
employees, and 15 –
2
Main
Quantitative
How to
using
Mobile
managers
value- added services
20 customers
Customer
Questionnaire
using
Mobile
value- added services
16
(n = 184)
or