Bai giang MRI
Bạn đang xem bản rút gọn của tài liệu. Xem và tải ngay bản đầy đủ của tài liệu tại đây (3.22 MB, 21 trang )
Supervised by Professor,
Seong-Cho Yu
Student,
The-Long Phan
Department of Physics, Chungbuk National University,
361-763, Cheongju, Korea
Applied physics Lab,
Physic department, CBNU
The colossal
magnetoresistance (CMR)
effect in the doped
manganites R
1-x
A′
x
MnO
3
(R=La, Nd; A′=Ca, Sr, Ba,
etc.) with perovskite
structure has recently
become a subject of
intense interest.
The CMR effect in manganites, occurring near T
C
,
is explained by the Mn
3+
-Mn
4+
double-exchange
process, Mn
3+
-Mn
3+
superexchange and Jahn-Teller
distortion processes, caused by substituting
divalent ions (Ca, Sr, Ba,...) into the A-site of
perovskite structure.
Electron paramagnetic resonance (EPR) is an
useful probe to study spin dynamics of the Mn
3+
and
Mn
4+
ions, Jahn-Teller distortion in the CMR
materials.
Measure EPR spectra from:
- Polycrystallines: La
0.7
A′
0.3
MnO
3
(A′=Sr,Ba,Cd),
and (Nd
1-x
Y
x
)
0.7
Sr
0.3
MnO
3
(0≤x≤0.28)
- Single crystal: La
0.7
Sr
0.2
Ca
0.1
MnO
3
Theoretical calculations apply for analyzing
experimental EPR data
Find out influences of the effective radius of the
A-site cation <r
A
>, the Mn
3+
/Mn
4+
ratio and the skin
effect on the EPR parameters
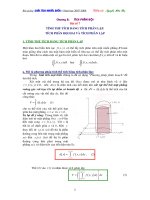
Sample
Perovskite
X-band 9.21 GHz
(Frequency)
Magnetic field
(H)
Temperature
Controller
ESR signal: dP/dH
Working conditions:
- Temperature range: ~77 to 473 K.
- External magnetic field: 0 to 1 T.
- The fixed frequency: f = 9.2 GHz, in the microwave
range
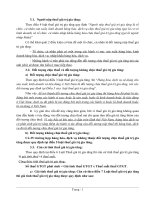
I. La
0.7
A′
0.3
MnO
3
(A′=Sr,Ba,Cd) compounds
FM
PM
FM
PM
PM
FM
EPR signals for the samples
T
C
= 365 K T
C
= 322 K
T
C
= 239 K
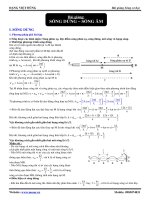
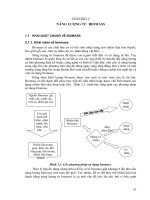
The linewidth and intensity of EPR spectra
Temperature dependence of
the EPR linewidth for LSM,
LBM, and LCM.
Temperature dependence of
the EPR intensity for LSM,
LBM, and LCM.
From above EPR signals, we determined the temperature
dependences of the EPR linewidth and intensity
Analyze the EPR linewidth data
- In the T≥T
min
regime, if we base on the relationship between
∆
H
pp
(T) and the electrical conductivity, the linewidth is given by
∆
H
pp
(T) =
∆
H
0
+A/T[exp(-E
a
/k
B
T)] (1)
The linewidth data of the samples are fitted to Eq. (1)
The fitting parameters are shown in Table 1