Consumption tax trends 2016 VATGST and excise rates, trends and policy issues
Bạn đang xem bản rút gọn của tài liệu. Xem và tải ngay bản đầy đủ của tài liệu tại đây (2.74 MB, 194 trang )
Consumption Tax Trends
2016
VAT/GST and excise rates,
Trends and policy issues
Consumption Tax Trends
2016
VAT/GST AND EXCISE RATES,
TRENDS AND POLICY ISSUES
This work is published under the responsibility of the Secretary-General of the OECD. The
opinions expressed and arguments employed herein do not necessarily reflect the official
views of OECD member countries.
This document and any map included herein are without prejudice to the status of or
sovereignty over any territory, to the delimitation of international frontiers and boundaries
and to the name of any territory, city or area.
Please cite this publication as:
OECD (2016), Consumption Tax Trends 2016: VAT/GST and excise rates, trends and policy issues, OECD
Publishing, Paris.
/>
ISBN 978-92-64-26404-5 (print)
ISBN 978-92-64-26405-2 (PDF)
Series: Consumption Tax Trends
ISSN 1562-8752 (print)
ISSN 1999-0979 (online)
The statistical data for Israel are supplied by and under the responsibility of the relevant Israeli authorities. The use
of such data by the OECD is without prejudice to the status of the Golan Heights, East Jerusalem and Israeli
settlements in the West Bank under the terms of international law.
Corrigenda to OECD publications may be found on line at: www.oecd.org/about/publishing/corrigenda.htm.
© OECD 2016
You can copy, download or print OECD content for your own use, and you can include excerpts from OECD publications, databases and
multimedia products in your own documents, presentations, blogs, websites and teaching materials, provided that suitable
acknowledgement of OECD as source and copyright owner is given. All requests for public or commercial use and translation rights should
be submitted to Requests for permission to photocopy portions of this material for public or commercial use shall be
addressed directly to the Copyright Clearance Center (CCC) at or the Centre français d’exploitation du droit de copie (CFC)
at
FOREWORD
Foreword
T
his is the eleventh edition of Consumption Tax Trends, a biennial OECD publication. It presents
cross-country comparative data relative to consumption taxes in OECD member countries, as at
1 January 2016. Tables using data from the National Accounts and data on tax revenue from
Revenue Statistics 1965-2015 are updated up to and including 2014. Price levels for fuel oils are
updated as at 4th Quarter 2015 from Energy Prices and Taxes – Quarterly Statistics issued by
the International Energy Agency. The country data for the report have, for the most part, been
provided by delegates to Working Party No. 9. The exchange rates used to convert national currencies
into US dollars (USD) are average market rates for 2015 taken from the OECD Monetary and
Financial Statistics, except for Tables 1.A1.10 (Chapter 1), and 2.A2.3 (Chapter 2) where the
Purchase Power Parity (PPP) rates are used as they provide for a better comparison of the value of
VAT relief thresholds (PPP rates for GDP 2015 are extracted from the OECD Statistics Database).
This publication illustrates the evolution of consumption taxes as instruments for raising tax
revenue. It identifies and documents the large number of differences that exist in respect of the
consumption tax base, rates and implementation rules while highlighting the features underlying
their development. It looks, in particular, at developments in the Value Added Tax/Goods and
Services Tax (VAT/GST) area (referred to as “VAT” in this publication). It notably presents an
updated estimate of the VAT Revenue Ratio (VRR) for OECD countries, providing an indicator of the
loss of VAT revenue as a consequence of exemptions and reduced rates, fraud, evasion and tax
planning. It notes the completion of the OECD International VAT/GST Guidelines and its worldwide
acceptance as the emerging international standard for the application of VAT to cross-border trade in
services and intangibles. Chapter 1 summarises trends in consumption taxes and their main
features. It shows the evolution of consumption tax revenues between 1965 and 2014 and looks in
some more detail at the application of VAT to international trade, more particularly at the challenges
of applying VAT to cross-border trade in services and intangibles and at the OECD International
VAT/GST Guidelines. It also considers the recent evolutions concerning VAT fraud. Chapter 2
describes the key features of VAT regimes in OECD countries, i.e. tax rates, exemptions, specific
restrictions to input tax credit, registration and collection thresholds, VAT relief arrangements for
goods imported by final consumers and special tax collection methods. It is complemented with a
technical note on the rationale and impact of reduced VAT rates. Chapter 3 describes how the VAT
Revenue Ratio (VRR) provides an indicator of the effect of exemptions, reduced rates and noncompliance on government revenues and explains how it is calculated and should be interpreted. It
is complemented with technical notes on measurement issues. Chapter 4 describes the main features
of excise duties and their impact on revenue, customer behaviour and markets. It shows the detailed
excise tax rates on beer, wine, alcoholic beverages, tobacco, and mineral oil products in
OECD countries. It also provides, for the first time, an estimate of the total tax burden in a pack of
cigarettes in OECD countries. Chapter 5 describes the main features of vehicle taxes and their use for
CONSUMPTION TAX TRENDS 2016 © OECD 2016
3
FOREWORD
influencing customer behaviour. It provides detailed information on taxes on sale and registration of
vehicles and recurrent taxes.
This publication was prepared under the auspices of the Working Party N° 9 on Consumption
Taxes, of the Committee on Fiscal Affairs. It was written by Stéphane Buydens of the OECD Centre
for Tax Policy and Administration (CTPA).
4
CONSUMPTION TAX TRENDS 2016 © OECD 2016
TABLE OF CONTENTS
Table of contents
Acknowledgements . . . . . . . . . . . . . . . . . . . . . . . . . . . . . . . . . . . . . . . . . . . . . . . . . . . . . . . . .
9
Executive summary . . . . . . . . . . . . . . . . . . . . . . . . . . . . . . . . . . . . . . . . . . . . . . . . . . . . . . . . .
11
Chapter 1. Taxing consumption . . . . . . . . . . . . . . . . . . . . . . . . . . . . . . . . . . . . . . . . . . . . . . .
1.1. Introduction. . . . . . . . . . . . . . . . . . . . . . . . . . . . . . . . . . . . . . . . . . . . . . . . . . . . . . . .
1.2. Classification of consumption taxes . . . . . . . . . . . . . . . . . . . . . . . . . . . . . . . . . . .
1.3. Evolution of consumption tax revenues . . . . . . . . . . . . . . . . . . . . . . . . . . . . . . . .
1.4. Spread of VAT. . . . . . . . . . . . . . . . . . . . . . . . . . . . . . . . . . . . . . . . . . . . . . . . . . . . . . .
1.5. The main features of VAT design . . . . . . . . . . . . . . . . . . . . . . . . . . . . . . . . . . . . . .
1.6. Main design features of Retail Sales Taxes . . . . . . . . . . . . . . . . . . . . . . . . . . . . . .
1.7. Main characteristics of consumption taxes on specific goods and services . .
1.8. VAT and international trade – The destination principle . . . . . . . . . . . . . . . . . .
1.9. Tackling the VAT compliance gap . . . . . . . . . . . . . . . . . . . . . . . . . . . . . . . . . . . . . .
13
14
15
16
19
19
22
23
24
33
Notes. . . . . . . . . . . . . . . . . . . . . . . . . . . . . . . . . . . . . . . . . . . . . . . . . . . . . . . . . . . . . . . . . .
References . . . . . . . . . . . . . . . . . . . . . . . . . . . . . . . . . . . . . . . . . . . . . . . . . . . . . . . . . . . . .
36
36
Annex 1.A1. Data on taxing consumption . . . . . . . . . . . . . . . . . . . . . . . . . . . . . . . . . . .
38
Chapter 2. Value added taxes: Rates and structure. . . . . . . . . . . . . . . . . . . . . . . . . . . . . . .
2.1. Introduction. . . . . . . . . . . . . . . . . . . . . . . . . . . . . . . . . . . . . . . . . . . . . . . . . . . . . . . .
67
The evolution of standard rates and reduced rates . . . . . . . . . . . . . . . . . . . . . . .
Exemptions . . . . . . . . . . . . . . . . . . . . . . . . . . . . . . . . . . . . . . . . . . . . . . . . . . . . . . . .
Restrictions to the right to deduct VAT on specific inputs . . . . . . . . . . . . . . . . .
Registration and collection thresholds . . . . . . . . . . . . . . . . . . . . . . . . . . . . . . . . .
Application of margin schemes . . . . . . . . . . . . . . . . . . . . . . . . . . . . . . . . . . . . . . .
Technical note – Rationale and impact of reduced VAT rates. . . . . . . . . . . . . . .
68
68
71
73
74
76
76
References . . . . . . . . . . . . . . . . . . . . . . . . . . . . . . . . . . . . . . . . . . . . . . . . . . . . . . . . . . . . .
80
Annex 2.A2. Data on vat rates and structures . . . . . . . . . . . . . . . . . . . . . . . . . . . . . . . .
82
2.2.
2.3.
2.4.
2.5.
2.6.
2.7.
Chapter 3. Measuring performance of VAT. . . . . . . . . . . . . . . . . . . . . . . . . . . . . . . . . . . . . . 101
3.1. Introduction. . . . . . . . . . . . . . . . . . . . . . . . . . . . . . . . . . . . . . . . . . . . . . . . . . . . . . . . 102
3.2. What does the VRR measure and how is it calculated?. . . . . . . . . . . . . . . . . . . . 102
3.3. The VRR estimates for OECD countries . . . . . . . . . . . . . . . . . . . . . . . . . . . . . . . . . 104
3.4. How to interpret the VRR estimates? . . . . . . . . . . . . . . . . . . . . . . . . . . . . . . . . . . . 106
3.5. Technical notes . . . . . . . . . . . . . . . . . . . . . . . . . . . . . . . . . . . . . . . . . . . . . . . . . . . . . 109
References . . . . . . . . . . . . . . . . . . . . . . . . . . . . . . . . . . . . . . . . . . . . . . . . . . . . . . . . . . . . . 116
Annex 3.A3. VAT Revenue Ratio . . . . . . . . . . . . . . . . . . . . . . . . . . . . . . . . . . . . . . . . . . . . 117
Chapter 4. Selected excise duties in OECD countries . . . . . . . . . . . . . . . . . . . . . . . . . . . . . 119
4.1. Introduction. . . . . . . . . . . . . . . . . . . . . . . . . . . . . . . . . . . . . . . . . . . . . . . . . . . . . . . . 120
CONSUMPTION TAX TRENDS 2016 © OECD 2016
5
TABLE OF CONTENTS
4.2.
4.3.
4.4.
4.5.
4.6.
4.7.
Key characteristics and revenue trends. . . . . . . . . . . . . . . . . . . . . . . . . . . . . . . . .
Alcoholic beverages . . . . . . . . . . . . . . . . . . . . . . . . . . . . . . . . . . . . . . . . . . . . . . . . .
Tobacco products . . . . . . . . . . . . . . . . . . . . . . . . . . . . . . . . . . . . . . . . . . . . . . . . . . .
Mineral oil products . . . . . . . . . . . . . . . . . . . . . . . . . . . . . . . . . . . . . . . . . . . . . . . . .
Impact on cross-border trade . . . . . . . . . . . . . . . . . . . . . . . . . . . . . . . . . . . . . . . . .
Distributional impact of excise. . . . . . . . . . . . . . . . . . . . . . . . . . . . . . . . . . . . . . . .
120
123
124
126
127
128
Notes. . . . . . . . . . . . . . . . . . . . . . . . . . . . . . . . . . . . . . . . . . . . . . . . . . . . . . . . . . . . . . . . . . 128
References . . . . . . . . . . . . . . . . . . . . . . . . . . . . . . . . . . . . . . . . . . . . . . . . . . . . . . . . . . . . . 128
Annex 4.A4. Data on excise rates . . . . . . . . . . . . . . . . . . . . . . . . . . . . . . . . . . . . . . . . . . 130
Chapter 5. Taxing vehicles . . . . . . . . . . . . . . . . . . . . . . . . . . . . . . . . . . . . . . . . . . . . . . . . . . . . 157
5.1. Introduction. . . . . . . . . . . . . . . . . . . . . . . . . . . . . . . . . . . . . . . . . . . . . . . . . . . . . . . . 158
5.2. Car taxation and polluting emissions . . . . . . . . . . . . . . . . . . . . . . . . . . . . . . . . . . 159
5.3. Taxes on purchase and registration of motor vehicles . . . . . . . . . . . . . . . . . . . . 160
5.4. Periodic taxes in connection with ownership or use of motor vehicles . . . . . . 161
References . . . . . . . . . . . . . . . . . . . . . . . . . . . . . . . . . . . . . . . . . . . . . . . . . . . . . . . . . . . . . 161
Annex 5.A5. Data on car taxation . . . . . . . . . . . . . . . . . . . . . . . . . . . . . . . . . . . . . . . . . . 162
Annex A. Countries with VAT . . . . . . . . . . . . . . . . . . . . . . . . . . . . . . . . . . . . . . . . . . . . . . . . . 181
Annex B. Statement of outcomes On the OECD International VAT/GST Guidelines . . . 185
Annex C. Exchanges rates . . . . . . . . . . . . . . . . . . . . . . . . . . . . . . . . . . . . . . . . . . . . . . . . . . . . 187
Annex D. Cigarettes – Most sold brands (MSB) in OECD Countries . . . . . . . . . . . . . . . . . 189
Tables
1.A1.1. Consumption taxes (5100) as percentage of GDP . . . . . . . . . . . . . . . . . . . . . . . . .
39
40
41
42
43
44
45
46
47
48
1.A1.2. Consumption taxes (5100) as percentage of total taxation . . . . . . . . . . . . . . . . .
1.A1.3. Taxes on general consumption (5110) as percentage of GDP. . . . . . . . . . . . . . . .
1.A1.4. Taxes on general consumption (5110) as percentage of total taxation . . . . . . .
1.A1.5. Taxes on specific goods and services (5120) as percentage of GDP. . . . . . . . . . .
1.A1.6. Taxes on specific goods and services (5120) as percentage of total taxation . .
1.A1.7. Value added taxes (5111) as percentage of GDP . . . . . . . . . . . . . . . . . . . . . . . . . . .
1.A1.8. Value added taxes (5111) as percentage of total taxation . . . . . . . . . . . . . . . . . .
1.A1.9. Tax structures in the OECD area . . . . . . . . . . . . . . . . . . . . . . . . . . . . . . . . . . . . . . .
1.A1.10. VAT relief for low value imports. . . . . . . . . . . . . . . . . . . . . . . . . . . . . . . . . . . . . . . .
1.A1.11. Mechanisms for collecting VAT on cross-border supplies of services and
intangibles from non-resident suppliers (“inbound supplies”) . . . . . . . . . . . . . . 50
1.A1.12. Application of domestic reverse charge and split payment mechanisms . . . . . 53
1.A1.13. Import/export of goods by individual travellers . . . . . . . . . . . . . . . . . . . . . . . . . . 59
2.A2.1. VAT rates . . . . . . . . . . . . . . . . . . . . . . . . . . . . . . . . . . . . . . . . . . . . . . . . . . . . . . . . . . . 83
2.A2.2. Application of lower VAT rates . . . . . . . . . . . . . . . . . . . . . . . . . . . . . . . . . . . . . . . . . 85
2.A2.3. Annual turnover concessions for VAT registration and collection
(domestic businesses) . . . . . . . . . . . . . . . . . . . . . . . . . . . . . . . . . . . . . . . . . . . . . . . . 89
2.A2.4. VAT Exemptions . . . . . . . . . . . . . . . . . . . . . . . . . . . . . . . . . . . . . . . . . . . . . . . . . . . . . 92
2.A2.5. Restrictions to the right to deduct VAT on specific inputs. . . . . . . . . . . . . . . . . . 96
2.A2.6. Usage of margin schemes . . . . . . . . . . . . . . . . . . . . . . . . . . . . . . . . . . . . . . . . . . . . . 99
3.A3.1. VAT Revenue Ratio (VRR) . . . . . . . . . . . . . . . . . . . . . . . . . . . . . . . . . . . . . . . . . . . . . . 118
4.A4.1. Taxation of beer . . . . . . . . . . . . . . . . . . . . . . . . . . . . . . . . . . . . . . . . . . . . . . . . . . . . . 131
6
CONSUMPTION TAX TRENDS 2016 © OECD 2016
TABLE OF CONTENTS
4.A4.2.
4.A4.3.
4.A4.4.
4.A4.5.
4.A4.6.
4.A4.7.
4.A4.8.
4.A4.9.
5.A5.1.
5.A5.2.
Taxation of wine . . . . . . . . . . . . . . . . . . . . . . . . . . . . . . . . . . . . . . . . . . . . . . . . . . . . .
Taxation of alcoholic beverages . . . . . . . . . . . . . . . . . . . . . . . . . . . . . . . . . . . . . . . .
Taxation of tobacco . . . . . . . . . . . . . . . . . . . . . . . . . . . . . . . . . . . . . . . . . . . . . . . . . .
Tax burden as a share of total price for cigarettes . . . . . . . . . . . . . . . . . . . . . . . .
Taxation of premium unleaded (94-96 RON) gasoline (per litre), 2015 . . . . . . .
Taxation of automotive diesel (per litre), 2015. . . . . . . . . . . . . . . . . . . . . . . . . . . .
Taxation of light fuel oil for households (per litre), 2015 . . . . . . . . . . . . . . . . . . .
Excises (5121) as percentage of total taxation . . . . . . . . . . . . . . . . . . . . . . . . . . . .
Taxes on sale and registration of motor vehicles . . . . . . . . . . . . . . . . . . . . . . . . .
Taxes on ownership or use of motor vehicles . . . . . . . . . . . . . . . . . . . . . . . . . . . .
136
139
142
145
147
149
152
155
163
173
Figures
1.1.
1.2.
1.3.
1.4.
1.5.
2.1.
2.2.
3.1.
Average tax revenue as a percentage of total taxation, by category of tax 2014 16
Share of VAT as a percentage of total taxation 2014 . . . . . . . . . . . . . . . . . . . . . . . 17
Share of consumption taxes as percentage of total taxation 1966-2014 . . . . . . 18
Evolution of the tax mix 1965-2014 . . . . . . . . . . . . . . . . . . . . . . . . . . . . . . . . . . . . . 18
Number of countries having implemented a VAT 1960-2016. . . . . . . . . . . . . . . . 19
Evolution of standard VAT rates – OECD average 1976-2016 . . . . . . . . . . . . . . . . 69
Standard rates of VAT in OECD countries, 2016 . . . . . . . . . . . . . . . . . . . . . . . . . . . 70
VAT Revenue Ratio in OECD countries 2014 . . . . . . . . . . . . . . . . . . . . . . . . . . . . . . 105
Follow OECD Publications on:
/> /> /> />OECD
Alerts
/>
This book has...
StatLinks2
A service that delivers Excel® files from the printed page!
Look for the StatLinks2at the bottom of the tables or graphs in this book.
To download the matching Excel® spreadsheet, just type the link into your
Internet browser, starting with the prefix, or click on the link from
the e-book edition.
CONSUMPTION TAX TRENDS 2016 © OECD 2016
7
ACKNOWLEDGEMENTS
Acknowledgements
A
knowledgements are due to: David Bradbury (Head, Tax Policy and Statistics Division);
Piet Battiau (Head, Consumption Taxes Unit), Kurt Van Dender (Head, Tax and
Environment Unit); Michele Harding (Head, Statistical Unit); Bert Brys (Head, Tax Policy
Unit); Alastair Thomas (Tax Economist), Florens Flues (Tax Economist), Michel Lahittete
(Statistician), Michael Sharrat (Statistician) and Martine Monza (Assistant), CTPA;
Mariano Berkenwald, International Energy Agency; Professor Walter Hellerstein
(Distinguished Research Professor & Francis Shackelford Distinguished Professor in
Taxation Law, University of Georgia).
CONSUMPTION TAX TRENDS 2016 © OECD 2016
9
Consumption Tax Trends 2016
© OECD 2016
Executive summary
C
onsumption taxes generally consist of general taxes on goods and services (“taxes on
general consumption”), consisting of value-added tax (VAT) and its equivalent in several
jurisdictions (goods and services tax, or GST), sales taxes, and other general taxes on goods
and services; and taxes on specific goods and services, consisting primarily of excise taxes,
customs and import duties, and taxes on specific services (such as insurance premiums
and financial services).
Consumption taxes accounted for 30.5% of total tax revenues in OECD countries
in 2014, on average. While the share of all taxes on consumption (taxes on general
consumption plus taxes on specific goods and services) as a percentage of total tax revenue
has remained relatively stable since 1975, the composition of consumption taxes has
fundamentally changed. Over time, OECD countries have relied increasingly on taxes on
general consumption. Since 1965, the share of these taxes as a percentage of GDP in
OECD countries has more than doubled, from 3.2% to 7.0%. They presently raise 20.7% of
total tax revenue on average, compared with 11.9% in 1965. VAT has become the largest
source of taxes on general consumption, accounting on average for 6.8% of GDP and 20.1%
of total tax revenue in OECD countries in 2014. While revenues from taxes on general
consumption fell between 2005 and 2009, as a consequence of the global economic crisis,
they have now returned to the pre-crisis levels largely due to the rise in standard VAT rates
in many countries. In contrast to this increase, revenues from taxes on specific goods and
services, the bulk of which are excise taxes, have fallen over time as a percentage of GDP
(from 5.6% in 1965 to 3.3% in 2014) and as a percentage of total tax revenue (from 24.3%
in 1965 to 9.6% in 2014).
Key trends
●
VAT revenues are at an all-time high in OECD countries at 6.8% of GDP and at 20.1% of
total tax revenue on average (excl. the United States which do not have a VAT system),
up from respectively 6.6% of GDP and 19.8% of total tax revenue in 2012. Revenues from
VAT rose as a percentage of GDP in 22 of the 34 OECD countries that operate a VAT and
fell, only slightly, in 5 countries compared to 2012.
●
Standard VAT rates in the OECD reached a record level of 19.2% on average in 2015 and
have remained stable since. Ten OECD countries now have a standard VAT rate above
22%, against only four in 2008. The average standard rate of the 22 OECD countries that
are members of the European Union (21.7%) is significantly above the OECD average.
●
Countries increasingly look at base broadening measures to raise additional revenue
from VAT, notably by increasing reduced VAT rates and/or narrowing their scope in line
with OECD recommendations.
11
EXECUTIVE SUMMARY
●
Most OECD countries have implemented or announced measures to collect the VAT on
the ever-rising volume of online sales by offshore sellers in line with the International
VAT/GST Guidelines and the BEPS Action 1 Report on Addressing the Tax Challenges of the
Digital Economy.
●
The International VAT/GST Guidelines are the first-ever global standard for the
application of VAT to cross-border trade. They were completed in 2015 and were
endorsed by over 100 countries, jurisdictions and international organisations at the
OECD Global Forum on VAT in November 2015. They were adopted as a Recommendation
by the OECD Council in September 2016.
●
The total tax burden on cigarettes is now above 50% of the consumer price in almost all
OECD countries and has reached 80% or more in 10 countries. Countries increasingly use
excise duties to influence customer behaviour.
Key findings
12
●
Many OECD countries continue to apply reduced rates to a broad range of products such
as basic essentials, pharmaceuticals and healthcare services, cultural and sporting
events, etc. to pursue equity or other non-distributional goals (e.g. supporting cultural
objectives, promoting locally supplied labour-intensive activities or correcting
environmental or other externalities). This notwithstanding evidence that reduced rates
are not an effective tool to achieve redistribution or to pursue the other nondistributional goals as mentioned above. They also continue to make considerable use of
exemptions to pursue distributional objectives (such as exemptions for basic health,
charities and education) and for activities that are considered hard to tax (for example,
financial services).
●
The VAT Revenue Ratio (VRR) for OECD countries suggests that there is still potential for
additional revenue by improving the performance of VAT. The VRR provides a
comparative measure of how exemptions and reduced rates affect tax revenues and
countries’ ability to secure effectively the potential tax base for VAT. It measures the
difference between the VAT revenue collected and what would theoretically be raised if
VAT was applied at the standard rate to the entire potential tax base in a “pure” VAT
regime. Across the OECD, the unweighted average VRR has remained relatively stable at
0.56 in 2014, compared to 0.55 in 2012, meaning that 44% of the potential VAT revenue is
not collected. Although the VRR has to be interpreted with care and tax base erosion may
be caused by a variety of factors, this VRR estimate suggests that there is significant
potential for raising additional revenues by improving VAT systems’ performance.
●
The share of excise duties in total tax revenue has been subject to a long decline
since 1965, when they accounted for 14.2% on average, compared to 7.6% in 2014. Excise
duties are increasingly used to influence consumer behaviour, in particular to reduce
pollution through taxes on motor fuels and improve health by heavier taxation of
tobacco products.
●
Car taxation is increasingly used to influence customer behaviour and encourage the use
of low polluting vehicles. In 2016, more than three quarters of OECD countries apply
lower taxes or exemptions on purchase or use/ownership for vehicles according to
environmental or fuel efficiency criteria.
CONSUMPTION TAX TRENDS 2016 © OECD 2016
Consumption Tax Trends 2016
© OECD 2016
Chapter 1
Taxing consumption
This chapter describes the relative importance of consumption taxes as a source of
tax revenues and the main features of these taxes. It shows the evolution of
consumption tax revenues between 1965 and 2014. It describes the functioning of
value added taxes (VAT) and of retail sales taxes (in the United States) and the
main characteristics of consumption taxes on specific goods and services. It looks in
some more detail at the application of VAT to international trade, more particularly
at the challenges of applying VAT to cross-border trade and at the International
VAT/GST Guidelines that the OECD has developed as the global standard to address
these challenges. Finally, it considers the recent developments concerning VAT fraud
and evasion and outlines some of the countermeasures that have been implemented
in some countries or that may be implemented in the future.
The statistical data for Israel are supplied by and under the responsibility of the relevant Israeli
authorities. The use of such data by the OECD is without prejudice to the status of the Golan Heights,
East Jerusalem and Israeli settlements in the West Bank under the terms of international law.
13
1.
TAXING CONSUMPTION
1.1. Introduction
Consumption taxes account for approximately one third of the total taxes collected in
OECD countries. They have two common forms: taxes on general consumption (value
added taxes and retail sales taxes) and taxes on specific goods and services (mainly excise
duties).
Since the mid-1980s, VAT1 (also called Goods and Services Tax – GST) has become the
main consumption tax both in terms of revenue and geographical coverage. VAT is
designed to be a tax on final consumption that is broadly neutral towards the production
process and international trade. It is widely seen as a relatively growth-friendly tax. As a
result many countries have sought to raise additional revenues from VAT (rather than other
taxes) as part of their fiscal consolidation strategies in the aftermath of the global financial
and economic crisis. Many developing countries have introduced a VAT during the last two
decades to replace lost revenues from trade taxes following trade liberalisation. Some 166
countries operate a VAT today (see Annex A), including 34 of the 35 OECD member
countries, the only exception being the United States although most states within the US
employ some form of retail sales tax. VAT raises approximately a fifth of total tax revenues
in the OECD and worldwide.
The combination of the global spread of VAT, the rapid globalisation of economic
activity and the developments of the digital economy, which has resulted in an increased
interaction between VAT systems, along with increasing VAT rates, have raised the profile
of VAT as an increasingly significant issue in cross-border trade since the turn of the
century. In contrast with the taxation of income (where there are the OECD Model Tax
Convention and the Transfer Pricing Guidelines) there was no internationally agreed
framework for the application of VAT to cross-border trade, which led to increasing
uncertainty and complexity for tax authorities and businesses and to growing risks of
double taxation and unintended double non-taxation. This was a matter of special concern
with respect to international trade in services and intangibles, which has grown
particularly strong over the last decades. In response, the OECD’s Committee on Fiscal
Affairs (CFA) developed the International VAT/GST Guidelines. These Guidelines present a set
of internationally agreed standards and recommended approaches for the consistent
application of VAT/GST to international trade, with a particular focus on trade in services
and intangibles. Their main objective is to reduce the uncertainty and the risks of double
taxation and unintended non-taxation that result from inconsistencies in the application
of VAT in a cross-border context. The International VAT/GST Guidelines were endorsed as a
global standard by over one hundred countries, jurisdictions and international
organisations at the OECD Global Forum on VAT in November 2015. They were adopted as
a Recommendation by the Council of the OECD in September 2016. This Recommendation
is the first OECD legal instrument in the area of VAT (as the other OECD legal instruments
in the area of taxation, such as the OECD Model Tax Convention and the Transfer Pricing
Guidelines, relate essentially to the taxation of income).
14
CONSUMPTION TAX TRENDS 2016 © OECD 2016
1.
TAXING CONSUMPTION
Whilst VAT was first introduced about 60 years ago, excise duties have existed since
the dawn of civilisation. They are levied on a specific range of products and are assessed by
reference to various characteristics such as weight, volume, strength or quantity of the
product, combined in some cases with ad valorem taxes. Although they generally apply to
alcoholic beverages, tobacco products and fuels in all OECD countries and beyond, their tax
base, calculation method and rates vary widely between countries, reflecting local cultures
and historical practice. Excise duties are increasingly being used to influence consumer
behaviour to achieve health and environmental objectives.
This chapter first provides an overview of the statistical classification of consumption
taxes (Section 1.2) and shows the evolution of consumption tax revenues between 1965
and 2014 (Section 1.3). It then describes the geographical spread of VAT (Section 1.4) and
outlines the main features of VAT design (Section 1.5). This is followed by a high-level
description of the main design features of retail sales taxes (Section 1.6) and of the main
characteristics of consumption taxes on specific goods and services (Section 1.7). This
chapter then looks in some more detail at the challenges of applying VAT to cross-border
trade in services and intangibles and at the International VAT/GST Guidelines developed by
the OECD as the global standard to address these challenges. It also looks at the available
options for collecting VAT on cross-border trade in low value goods (Section 1.8). It finally
considers the recent developments concerning VAT fraud and evasion and outlines some
of the countermeasures that have been implemented in some countries or that may be
implemented in the future (Section 1.9). For ease of reference, the tables which are referred
to below are included at the end of the chapter.
1.2. Classification of consumption taxes
In the OECD classification, “taxes” are confined to compulsory, unrequited payments
to general government. According to the OECD nomenclature, taxes are divided into five
broad categories: taxes on income, profits and capital gains (1000); social security
contributions (2000); taxes on payroll and workforce (3000); taxes on property (4000); and
taxes on goods and services (5000) (OECD, 2016a).
Consumption taxes (Category 5100 “Taxes on production, sale, transfer, leasing and
delivery of goods and rendering of services”) fall mainly into two sub-categories:
●
General taxes on goods and services (“taxes on general consumption”), which includes value
added taxes (5111), sales taxes (5112) and other general taxes on goods and services
(5113).
●
Taxes on specific goods and services consisting primarily of excise taxes (5121), customs and
import duties (5123) and taxes on specific services (5126, e.g. taxes on insurance
premiums and financial services).
Consumption taxes such as VAT, sales taxes and excise duties are often categorised as
indirect taxes as they are generally not levied directly on the person who is supposed to bear
the burden of the tax. They are rather imposed on certain transactions, products or events
(OECD Glossary of Tax Terms). They are not imposed on income or wealth but rather on the
expenditure that the income and wealth finance. Governments generally collect the tax
from producers and distributors at various points in the value chain, while the burden of
the tax falls in principle on consumers assuming that it will be passed on to them in the
prices charged by suppliers.
CONSUMPTION TAX TRENDS 2016 © OECD 2016
15
A corrigendum has been issued for this page. See: />1.
TAXING CONSUMPTION
1.3. Evolution of consumption tax revenues
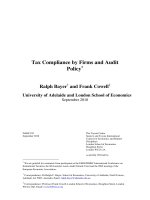
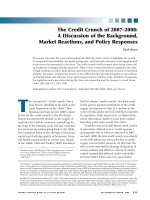
On average, consumption taxes produce 31% of the total tax revenue and account for
10% of the GDP in the OECD member countries (unweighted average, see Tables 1.A1.1
and 1.A1.2). In 2014, approximately two thirds of revenue from consumption taxes was
attributable to taxes on general consumption and one third to taxes on specific goods and
services (see Tables 1.A1.4 and 1.A1.6).
Figure 1.1. Average tax revenue as a percentage of total taxation,
by category of tax 2014
Other, 3%
Income and profits, 31%
Consumption, 31%
Property, 6%
Payroll, 1%
Social security, 25%
Source: Adapted from OECD (2016a), Revenue Statistics 2016, OECD Publishing, Paris. DOI: />rev_stats-2016-en-fr.
1 2 />
Tables 1.A1.3 and 1.A1.4 respectively present revenues from taxes on general
consumption as a percentage of Gross Domestic Product (GDP) and as a percentage of total
taxation in 2014. These taxes include VAT, sales taxes and other general taxes on goods and
services. These ratios vary considerably between countries both in percentage of GDP and
of total taxation. In Australia, Japan, Mexico, Switzerland, and the United States, taxes on
general consumption account for less than 4% of GDP while they account for more than
9.5% in Hungary, Israel and New Zealand. Revenues from those taxes account for less than
15% of total taxation in Australia, Canada, Italy, Japan, Switzerland and the United States
and for more than 30% in Chile, Hungary and Israel. Taxes on general consumption account
for more than 20% of total taxation in 20 of the 35 OECD countries, with an OECD
unweighted average of 20.7%.
Over the longer term, OECD member countries have relied increasingly on taxes on
general consumption. Since 1965, the share of these taxes as a percentage of GDP in
OECD countries has more than doubled, from 3.2% to 7.0% in 2014.They accounted for only
11.9% of total tax revenue in OECD countries in 1965 compared to 20.7% in 2014. While the
global financial and economic crisis had an effect on consumption tax revenues, which fell
between 2005 and 2009, they have generally returned to the pre-crisis levels, largely due to the
rise in standard VAT rates in many countries during and in the aftermath of the crisis (21 of the
OECD member countries raised their standard rate between 2009 and 2014 – see Chapter 2).
VAT is now the largest source of taxes on general consumption in OECD countries on
average. Revenues from VAT as a percentage of GDP increased from 6.8% in 2012 to 7.0%
in 2014 on average; and from 20.5% in 2012 to 20.7% in 2014 as a share of total taxation (see
Tables 1.A1.7 and 1.A1.8). VAT is operated in 34 of the 35 OECD countries, the United States
16
CONSUMPTION TAX TRENDS 2016 © OECD 2016
1.
TAXING CONSUMPTION
being the only OECD country not to have adopted a VAT. In 1975, thirteen of the current
OECD member countries had a VAT (see Table 2.A2.1 in Chapter 2). Greece, Iceland, Japan,
Mexico, New Zealand, Portugal, Spain and Turkey introduced VAT in the 1980s while
Switzerland followed shortly afterwards. The Central European economies introduced VAT
in the late 1980s and early 1990s, often based on the European Union (EU) model in
anticipation of their future EU membership. Revenues from VAT as a percentage of GDP
compared to 2012 rose in 21 of the 34 OECD countries that operate a VAT and fell, only
slightly, in 4 countries (see Table 1.A1.7). The largest increase was in Japan (1.2 percentage
points explained by the increase of the VAT rate from 5% to 8% in April 2014). Other
countries with substantial rises of VAT revenue as a percentage of GDP between 2012 and 2014
were Spain and Israel (0.7), the Slovak Republic (0.6) and Slovenia (0.5). These countries are also
those where the standard VAT rate was increased the most during the same period. The share
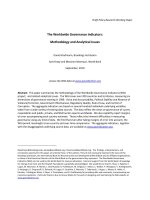
of VAT in total tax revenues in the 34 OECD countries that operate a VAT shows a considerable
spread, from 12-13% (Japan, Australia, Switzerland, Canada, Italy) to 25-26% (Estonia, Latvia,
Mexico) and to 29.9% in New Zealand and 41.6% in Chile (see Figure 1.2 and Table 1.A1.8). VAT
produces 15% or more of total tax revenues in 30 of the 34 OECD countries that operate a VAT
and it exceeds 20% of total taxation in 20 of these countries.
Figure 1.2. Share of VAT as a percentage of total taxation 2014
45
40
35
30
25
20
15
10
5
Un
i te
d
St
at
e
Ja s
Au pan
S w s tr
i t z a li a
er
la
C a nd
na
da
It a
Fr l y
a
Be nce
lg
iu
m
Ne K
t h or e
er a
la
n
Au ds
Ge s tr i
rm a
D a
L u enm n y
xe a
m rk
bo
N o ur g
rw
OE
a
C D Gr y
-A eec
ve e
ra
g
Tu e
rk
Ir e e y
la
Ic n d
el
a
F i nd
nl
an
Sp d
Sl
ov S w a in
Un a k R e d
i te ep en
d ub
K i li
ng c
do
Cz
ec Po m
h la
Re nd
pu
Sl bli c
ov
Hu eni a
ng
Po ar y
r tu
M gal
ex
ic
Is o
ra
L a el
tv
Ne Es ia
w ton
Ze ia
al
an
d
Ch
il e
0
Source: Adapted from OECD (2016a), Revenue Statistics 2016, OECD Publishing, Paris. DOI: />1 2 />
Tables 1.A1.5 and 1.A1.6 show that revenues from taxes on specific goods and services,
the bulk of which are excise taxes, have decreased steadily as a percentage of GDP
between 1965 and 2010 (from 5.6% in 1965 to 3.3% in 2010) and have remained stable at 3.3% of
GDP on average since then. The share of taxes on specific goods and services total taxation has
continued to fall between 2012 and 2014 (from 10.7% in 1965 to 9.6% in 2014 on average). The
share of taxes on specific goods and services in total tax revenues fell in 23 OECD countries in
increased in 7. Excise taxes are discussed in greater detail in Chapter 4.
As a result, the composition of consumption taxes has fundamentally changed over
time. The substantially increased importance of VAT has effectively balanced the
diminishing share of taxes on specific goods and services (see Figure 1.3). Only Turkey still
CONSUMPTION TAX TRENDS 2016 © OECD 2016
17
1.
TAXING CONSUMPTION
collects a significant part of its revenues by way of taxes on specific goods and services,
i.e. 22% of its total tax revenue against an OECD average of 9.6%.
Figure 1.3. Share of consumption taxes as percentage of total taxation 1966-2014
Consumption taxes
General consumption taxes
Taxes on specific goods and services
Value Added Taxes
40
35
30
25
20
15
10
5
0
1968 1970 1972 1974 1976 1978 1980 1982 1984 1986 1988 1990 1992 1994 1996 1998 2000 2002 2004 2006 2008 2010 2012 2014
Source: Adapted from OECD (2016a), Revenue Statistics 2016, OECD Publishing, Paris. DOI: />1 2 />
Table 1.A1.7 and Figure 1.4 show the evolution of the tax structure or tax mix in
OECD countries between 1965 and 2014. Tax structures are measured by the share of major
taxes in total tax revenue. On average, taxes on personal income (personal income tax and
social security contributions) increased slightly over this period, representing together 50%
of total tax revenue in 2014, with the share of personal income tax rising into the nineteen
seventies and then falling and the share of social security contributions still growing. In
this tax mix, VAT has become the third largest source of tax revenue for OECD countries on
average, ahead of corporate income taxes, payroll and property taxes.
Figure 1.4. Evolution of the tax mix 1965-2014
VAT 5111
Taxes on specific goods and services 5121
Personal income tax 1100
Corporate income tax 1200
Social security contributions 2000
35
30
25
20
15
10
5
0
1965
1975
1985
1995
2000
2010
2014
Source: Adapted from OECD (2016a), Revenue Statistics 2016, OECD Publishing, Paris. DOI: />rev_stats-2016-en-fr.
1 2 />
18
CONSUMPTION TAX TRENDS 2016 © OECD 2016
1.
TAXING CONSUMPTION
1.4. Spread of VAT
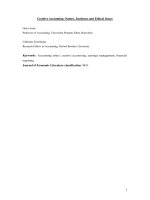
The spread of VAT has been among the most important development in taxation over
the last half century. Limited to less than 10 countries in the late 1960s, it is today an
important source of revenue in more than 166 countries worldwide (see Figure 1.5 and
Annex A).
The domestic and international neutrality properties of the VAT have encouraged its
spread around the world. Many developing countries have introduced a VAT during the last
two decades to replace lost revenues from trade taxes following trade liberalisation. In the
EU, VAT is directly associated with the development of its internal market. The adoption of
a common VAT framework in the EU was intended to remove the trade distortions
associated with cascading indirect taxes that it replaced and to facilitate the creation of a
common market in which Member States cannot use taxes on production and
consumption to protect their domestic industries and investment (Ebrill et al., 2001). A VAT
is operated in 34 of the 35 OECD countries, the only exception being the United States.
Figure 1.5. Number of countries having implemented a VAT 1960-2016
180
160
140
120
100
80
60
40
20
19
6
19 0
64
19
6
19 7
6
19 8
6
19 9
7
19 0
7
19 1
72
19
7
19 3
7
19 4
75
19
7
19 6
7
19 7
8
19 0
8
19 2
8
19 3
8
19 4
8
19 5
8
19 6
8
19 7
88
19
8
19 9
9
19 0
9
19 1
9
19 2
9
19 3
94
19
9
19 5
9
19 6
9
19 7
9
19 8
9
20 9
00
20
0
20 1
0
20 2
0
20 3
04
20
0
20 5
0
20 6
0
20 7
0
20 8
0
20 9
1
20 0
1
20 1
1
20 2
1
20 4
16
0
Source: F. Annacondia, International – Overview of General Turnover Taxes and Tax Rates, 27 International VAT Monitor 2 (2016), Journals
IBFD.
1 2 />
1.5. The main features of VAT design
Although there is a wide diversity in the way VAT systems are implemented, the VAT
can be defined by its purpose and its specific tax collection mechanism. The OECD
International VAT/GST Guidelines (OECD, 2016b) provide an overview of the core features of
VAT, which are summarised below.
A tax on final consumption
VAT is a broad-based tax on consumption by households as, in principle, only private
individuals, as distinguished from businesses, engage in the consumption at which a VAT
is targeted. In other words “businesses buy and use capital goods, office supplies and the like – but
they do not consume them in this sense” (Keen and Hellerstein, 2010). In practice, however,
many VAT systems impose VAT burden not only on consumption by private individuals,
but also on various entities that are involved in non-business activities.
CONSUMPTION TAX TRENDS 2016 © OECD 2016
19
1.
TAXING CONSUMPTION
From a legal and practical standpoint, VAT is essentially a transaction tax. In “real life”
things can be consumed in many ways. Some can be consumed fully and immediately (like
a taxi ride); some can be bought and fully consumed later (like a sandwich); some can be
consumed over a longer period of time (like a desk or a subscription to an on-line
database). However, VAT does not actually tax such material consumption. Rather, it aims
at taxing the sale to the final consumer through a staged payment process along the supply
chain.
VAT is collected by businesses through a staged process but, since it is a tax on final
consumption by households, the burden of the VAT should not rest on businesses, except
when they acquire goods, services or intangibles for private consumption by their owners
or their employees.
It can be argued, however, that the economic burden of the VAT can lie in variable
proportion on business and consumers. Indeed, the effective incidence of VAT, like that of
any other tax, is determined not only by its formal nature but also by market
circumstances, including the elasticity of demand and the nature of competition between
suppliers (Ebrill et al., 2001).
The staged collection process
The central design feature of a VAT, and the feature from which it derives its name, is
that the tax is collected through a staged process on the value added at each stage of
production and distribution. Each business in the supply chain takes part in the process of
controlling and collecting the tax, remitting the proportion of tax corresponding to its
margin, i.e. on the difference between the VAT imposed on its taxed inputs and the VAT
imposed on its taxed outputs. Businesses collect VAT on the value of their outputs from
their customers and are entitled to deduct the tax they have paid on purchases and must
account and remit the difference (or receive a refund from) to the tax authorities. In this
respect, the VAT differs from a retail sales tax (“RST”), which taxes consumption through a
single-stage levy imposed in theory only at the point of final sale.
This mechanism reflects the central design feature of the VAT as a tax collected by
businesses through a staged payment process coupled with the fundamental principle that
the burden of the tax does not rest on businesses but on final consumers. This requires a
mechanism for relieving businesses of the burden of the VAT they pay when they acquire
goods, services or intangibles.
There are two main approaches for operating the staged collection process:
20
●
Under the invoice credit method (which is a “transaction based method”), each trader
charges VAT at the rate specified for each supply and passes to the purchaser an invoice
showing the amount of tax charged. The purchaser is in turn able to credit that input tax
against the output tax it charges on its sales, remitting the balance to the tax authorities
and receiving refunds when there are excess credits. This method is based on invoices
that could, in principle, be cross-checked to pick up any overstatement of credit
entitlement. By linking the tax credit on the purchaser’s inputs to the tax paid by the
purchaser, the invoice credit method is designed to discourage fraud.
●
Under the subtraction method (which is an “entity based method”), the tax is levied
directly on an accounts-based measure of value added, which is determined for each
business by subtracting the VAT calculated on allowable purchases from the VAT
calculated on taxable supplies.
CONSUMPTION TAX TRENDS 2016 © OECD 2016
1.
TAXING CONSUMPTION
Almost all jurisdictions that operate a VAT use the invoice-credit method. In the OECD,
only Japan uses the subtraction method.
Neutrality
The staged collection process, whereby tax is in principle collected from businesses
only on the value added at each stage of production and distribution, gives to the VAT its
essential character in domestic trade as an economically neutral tax. The full right to
deduct input tax through the supply chain, except by the final consumer, ensures the
neutrality of the tax, whatever the nature of the product, the structure of the distribution
chain, and the means used for its delivery (e.g. retail stores, physical delivery, Internet
downloads). As a result of the staged payment system, VAT “flows through the businesses”
to tax supplies made to final consumers.
Where the deductible input VAT for any period exceeds the output VAT collected, there
is an excess of VAT credit, which should in principle be refunded. This is generally the case
in particular for exporters, since their output is in principle free of VAT under the
destination principle, and for businesses whose purchases are larger than their sales in the
same period (such as new or developing businesses or seasonal businesses). These are
especially important groups in terms of wider economic development, so it is important
that VAT systems provide for an effective treatment of excess credits to avoid the risk that
VAT introduces significant and costly distortions for these groups of business. At the same
time, however, the payment of refunds evidently can create significant opportunities for
fraud and corruption. It is important therefore that an effective refund system is also
closely connected to the proper implementation of a comprehensive audit program (Ebrill
et al., 2001).
When the right of deduction covers all business inputs, the final burden of the tax
does not lie on businesses but on consumers. This is not always the case in practice, as
restrictions on the right to deduct input tax may be restricted in a number of ways. Some
are deliberate and some result from imperfect administration (see Chapter 2).
Deliberate restrictions to the deduction of input VAT result in particular from the
application of VAT exemptions. When a supply is VAT-exempt, no VAT is charged on the
supply and the supplier is not entitled to deduct the related input VAT. Many VAT systems
apply exemptions for social (health, education and charities), practical (financial services,
insurance) or historical (immovable property, land) reasons.
Another set of restrictions to the right of deduction of input VAT relates to purchases
used, or deemed to be used, for the private consumption of the owners of a business, or of
its employees or clients (e.g. cars and entertainment). Restrictions to the deduction of
input VAT have also often been imposed in relation to investment goods or capital assets.
This implies that an irrecoverable tax is embedded in the VAT base of final consumption
and leads to a form of cumulative tax. However, most VAT systems accept the principle of
full deduction and refunding of input VAT on investment goods.
Chapter 2 of the OECD’s International VAT/GST Guidelines presents the key principles of
VAT-neutrality and a set of internationally agreed standards to support neutrality of VAT in
international trade.
CONSUMPTION TAX TRENDS 2016 © OECD 2016
21
1.
TAXING CONSUMPTION
1.6. Main design features of Retail Sales Taxes
A retail sales tax is a tax on general consumption charged only once on products at the
last point of sale to the end user. In principle, only consumers are charged the tax; resellers
are exempt if they are not final end users of the products. To implement this principle,
business purchasers are normally required to provide the seller with a “resale certificate,”
which states that they are purchasing an item to resell it. The tax is charged on each item
sold to purchasers who do not provide such a certificate. The retail sales tax covers not only
retailers, but all businesses dealing with purchasers who do not provide a resale or other
exemption certificate signifying that no tax is due (e.g. a public body or a charity, unless
specific exemption applies).
The basis for taxation is the sales price. Unlike multi-stage cumulative taxes and like
the VAT, this system allows the tax burden to be calculated precisely and it does not in
principle discriminate between different forms of production or distribution channels. In
practice, however, at least in the United States, the failure of the retail sales tax to reach
many services and the limitation of the resale exemption to products that are resold in the
same form that they are purchased, or are physically incorporated into products that are
resold, leads to substantial taxation of business inputs.
In theory, the final outcomes of VAT and retail sales tax should be identical: they both
ultimately aim to tax final consumption of a wide range of products where such
consumption takes place. They also both tax the consumption expenditure i.e. the
transaction between the seller and the buyer rather than the actual consumption. In
practice, however, the end result is somewhat different given the fundamental difference
in the way the tax is collected. Unlike VAT where the tax is collected at each stage of the
value chain under a staged payment system (see Section 1.5 above), sales taxes are
collected only at the very last stage i.e. on the sale by the retailer to the final consumer. The
latter method has significant disadvantages: the higher the rate the more pressure is
placed on the weakest link in the chain – the retailer, especially numerous small retailers;
all the revenue is at risk if the retailer fails to remit the tax and the audit and invoice trail
is poorer than under a VAT, especially for services; there are inevitably troublesome “enduse exemptions”; and revenue is not secured at the easiest stage, that is at the time of
importation and this can be crucial for many developing countries. As a result, a single
point resale sales tax is efficient at relatively low rates, but is increasingly difficult to
administer as rates rise (Tait, 1988).
The United States is the only OECD country that employs a retail sales tax as the
principal consumption tax. However, the retail sales tax in the United States is not a
federal tax. Rather, it is a tax imposed at the state and local government levels. Currently,
45 of the 50 States as well as thousands of local tax jurisdictions impose general retail sales
taxes. In general, the local taxes are almost identical in coverage to the state-level tax, are
administered at the state level and amount in substance simply to an increase in the state
rate, with the additional revenues distributed to the localities. Retail sales taxes are
complemented in every state by functionally identical “use” taxes imposed on goods
purchased from out-of-state vendors, because the state has no power to tax out-of-state
“sales” and therefore imposes a complementary tax on the in-state “use” (Hellerstein,
Hellerstein and Swain, 2016).
Combined state and local sales tax rates vary widely in the United States, from 1.78%
(Alaska), 4.35% (Hawaii) and 5.41% (Wisconsin) to 9.46% (Tennessee), 9.30% (Arkansas) and
22
CONSUMPTION TAX TRENDS 2016 © OECD 2016
1.
TAXING CONSUMPTION
9.00% (Louisiana). Five states do not have a state-wide sales tax (Alaska, Delaware,
Montana, New Hampshire, and Oregon and of these, two allow localities to charge local
sales taxes (Alaska and Montana) (Tax Foundation 2016). These rates are much lower than
the applicable VAT rates in OECD countries (except Canada, Japan and Switzerland). This is
due to two main factors: the compliance risks associated with the sales tax collection
method (see above) and the competition between jurisdictions (see below).
Retail sales and use taxes in force in the United States are subject to significant
competitive pressure, especially in the context of interstate and international trade.
Supreme Court rulings prohibit states from requiring vendors to collect tax with respect to
cross-border sales when they are not physically present in the purchaser’s state. States have
therefore been unable effectively to collect use taxes with respect to cross-border sales from
remote sellers. This problem has become increasingly significant with the advent of the
Internet and online sales. To address this problem, as well as others caused by the lack of
harmonisation in state sales and use taxes, a number of states have entered into the
Streamlined Sales and Use Tax Agreement (SSUTA available at www.streamlinedsalestax.org).
This agreement aims at establishing a uniform set of definitions of potentially taxable
items that states can choose to tax or not (e.g. digital products). The Streamlined member
states have also developed a Streamlined Sales Tax Registration System (SSTRS) that
enables taxpayers to register voluntarily in order to participate in SSUTA. Voluntary
registration requires sellers to collect sales and use taxes in all states into which they make
sales, regardless of their physical presence there, and it permits sellers to benefit from
increased legal certainty as regards their tax liability. Vendor collection of use taxes due on
cross-border sales could become mandatory if the US Congress approves proposed
legislation authorising states to require such collection if they have adopted SSUTA or
similar measures to ease compliance burdens for vendors.
1.7. Main characteristics of consumption taxes on specific goods and services
In the OECD nomenclature, taxes on specific goods and services (5120) include a range
of taxes such as excises, customs and import duties, taxes on exports and taxes on specific
services. Consumption Tax Trends focuses on excise duties only.
A number of general characteristics differentiate excise duties from value added taxes:
●
They are levied on a limited range of products.
●
They are not normally due until the goods enter free circulation, which may be at a late
stage in the supply chain.
●
Excise charges are generally assessed by reference to the weight, volume, strength or
quantity of the product, combined in some cases, with ad valorem taxes.
Consequently, and unlike VAT, the excise system is characterised by a small number of
taxpayers at the manufacturing or wholesale stage (although, in some cases they can also
be levied at the resale stage).
As with VAT, excise taxes aim to be neutral internationally. As the tax is normally
collected when the goods are released into free circulation, neutrality is often ensured by
holding exports under controlled regimes (such as bonded warehouses) and certification of
final export (again under controlled conditions) by Customs. Similarly, imported excise
goods are levied at importation although frequently the goods enter into controlled taxfree regimes until released into free circulation.
CONSUMPTION TAX TRENDS 2016 © OECD 2016
23