Japanese equities a practical guide to investing in the nikkei
Bạn đang xem bản rút gọn của tài liệu. Xem và tải ngay bản đầy đủ của tài liệu tại đây (2.1 MB, 177 trang )
Japanese Equities
Japanese Equities
A Practical Guide to Investing
in the Nikkei
MICHIRO NAITO
This edition first published 2019
© 2019 John Wiley & Sons, Ltd
Registered office
John Wiley & Sons Ltd, The Atrium, Southern Gate, Chichester, West Sussex, PO19 8SQ,
United Kingdom
For details of our global editorial offices, for customer services and for information about
how to apply for permission to reuse the copyright material in this book please see our
website at www.wiley.com.
All rights reserved. No part of this publication may be reproduced, stored in a retrieval
system, or transmitted, in any form or by any means, electronic, mechanical,
photocopying, recording or otherwise, except as permitted by the UK Copyright, Designs
and Patents Act 1988, without the prior permission of the publisher.
Wiley publishes in a variety of print and electronic formats and by print-on-demand. Some
material included with standard print versions of this book may not be included in
e-books or in print-on-demand. If this book refers to media such as a CD or DVD that is
not included in the version you purchased, you may download this material at http://
booksupport.wiley.com. For more information about Wiley products, visit www.wiley
.com.
Designations used by companies to distinguish their products are often claimed as
trademarks. All brand names and product names used in this book are trade names,
service marks, trademarks or registered trademarks of their respective owners. The
publisher is not associated with any product or vendor mentioned in this book.
Limit of Liability/Disclaimer of Warranty: While the publisher and author have used their
best efforts in preparing this book, they make no representations or warranties with
respect to the accuracy or completeness of the contents of this book and specifically
disclaim any implied warranties of merchantability or fitness for a particular purpose. It is
sold on the understanding that the publisher is not engaged in rendering professional
services and neither the publisher nor the author shall be liable for damages arising
herefrom. If professional advice or other expert assistance is required, the services of a
competent professional should be sought.
Library of Congress Cataloging-in-Publication Data is Available
ISBN 978-1-119-60366-5 (hardback) ISBN 978-1-119-60369-6 (ePub)
ISBN 978-1-119-60368-9 (ePDF) ISBN 978-1-119-60367-2 (Obook)
Cover Design: Wiley
Cover Image: © MarsYu/Getty Images
Set in 10/12pt ITCGaramondStd by SPi Global, Chennai, India
Printed in Great Britain by TJ International Ltd, Padstow, Cornwall, UK
10 9 8 7 6 5 4 3 2 1
Contents
About the Author
vii
Acknowledgments
ix
Preface
xi
CHAPTER 1
Macro Indicators and Seasonality
1
CHAPTER 2
Policy Impact
25
CHAPTER 3
Topics Derivatives
65
CHAPTER 4
Market Tops and Bottoms
93
CHAPTER 5
Other Market Movers
111
CHAPTER 6
September 2017–December 2018
145
Epilogue
165
Index
169
v
About the Author
Michiro Naito began working in the securities industry in 1994, after
graduating from the University of Texas at Austin with a Ph.D. in theoretical nuclear physics. His initial position was in the capacity of an
equity derivatives strategist at BZW Securities Japan, where he primarily
focused on convertibles and warrants markets. In the following years, he
was hired as a Japanese convertibles analyst at Merrill Lynch in Tokyo,
where he analyzed the convertibles market and instruments, and as an
equities analyst at Teacher Retirement System of Texas in Austin, where he
helped in making investment decisions with regard to Japanese, Korean,
Taiwanese, and Australian equities. From 2004 to 2017, Dr. Naito worked
as an equity derivatives/quantitative strategist at J.P. Morgan Securities
Japan. His work involved analyzing the Japanese equities market as well
as derivatives instruments. He also advised domestic and international
investors, which included pension funds and hedge funds.
vii
Acknowledgments
T
his book stems from my knowledge and experience as an equity
derivatives/quantitative strategist and equity analyst specialized
in the Japanese equities market. I was fortunate to work for some of
the world’s finest financial institutions—BZW Securities, Merrill Lynch,
Teacher Retirement System of Texas, and J.P. Morgan—and my gratitude
goes to them as well as to my ex-colleagues at those outstanding
organizations for their friendship and support.
The success of the Japanese version of the book convinced me that
there would be a worldwide demand for its English translation. In this
regard, I am deeply indebted to Hiroshi Hanaoka of Kinzai for pushing
forward with the Japanese version and to Tomoko Uetake of Thomson
Reuters for serving as a bridge between Kinzai and me.
Last but not least, my utmost appreciation goes to Matt Holt, Gladys
(Syd) Ganaden, Elisha Benjamin, Sharmila Srinivasan, and Amy Handy of
John Wiley & Sons for believing in the value of this book and working
on it to get it published in English. Because of their vision, this book can
now reach investors around the world.
—Michiro Naito, Ph.D.
ix
Preface
“Noise”
When we think of how the securities industry operates, perhaps the first
word that comes to mind is “efficiency.” The industry of elites, where
bright minds and ample experiences go to war against one another in
order to attain maximum profits and unimaginable wealth, may be the
image conveyed by movies such as Wall Street.
In reality, however, transfer of knowledge and wisdom has not been
executed very efficiently or smoothly in the securities industry. Some may
point to a mountain of research papers written on a vast variety of subjects
and say this is not so, while others may argue that modern technology has
allowed us to amass a level of information unprecedented in quantity and
quality. Indeed, bookshelves are filled with thousands of titles written on
the subject of the securities market, stocks and bonds, and other financial
instruments.
If we are to define knowledge or wisdom to be valuable and useful
information, however, I am not at all sure how much knowledge and wisdom are actually being accumulated over time and generationally passed
down in the securities industry. I worked in the securities industry for
roughly a quarter of a century, and during my tenure, I heard the same
questions asked and saw the same mistakes repeated over and over again.
I believe that these facts alone constitute good enough evidence of “poor”
transfer of knowledge and wisdom in the industry.
Richard Bernstein, the founder and CEO and CIO of Richard Bernstein Advisors and former Chief Investment Strategist at Merrill Lynch,
in his book titled Navigate the Noise: Investing in the New Age of Media
and Hype, said, “Investors are showered with so much irrelevant information, or noise, that the truly relevant information gets quickly buried
or overlooked as being too obvious to be important. Investors probably
need a great deal less information than is available to make an informed
xi
xii
Preface
investment decision. More important, they need less information than
they think they need” (Wiley, 2001, p. xii).
I cannot agree more with Bernstein.
There are several reasons for the “poor” knowledge and wisdom
transfer in the securities industry, in my view. First, the people who work
in the industry are highly specialized and proprietary. In some sense,
equity researchers, sales representatives, and traders are like professional
baseball or football players. Although they share some traits, their skills
and know-how are often unique and cannot be easily shared. In addition,
since their accumulated knowledge is their proverbial bread and butter,
they have little incentive to readily dispense it.
The second reason somewhat overlaps the first, but the very nature
of the securities industry hinders the generational bridging of knowledge and wisdom. By this, I am alluding to the rather quick and abrupt
turnover of employees. The securities industry is well known not only
for its oversized paychecks but also for its propensity to restructure at
will, as the market goes up and down. Employees are typically given little notice before receiving pink slips, and thus there is no time to pass
down what they know to the next generation of employees (and even
if they have the time, they may not do so for the reasons stated in the
previous paragraph).
The third reason is twofold: information overload and the size of the
paycheck itself. On a daily basis, as Mr. Bernstein puts it, “Investors are
showered with so much irrelevant information, or noise.” On the other
hand, brokers are getting paid handsome salaries by simply disseminating
the “noise.” Why would brokers bother to judge what is important and
what is not if they are getting paid by distributing noise? Needless to say,
the responsibility also lies with investors. This is because if investors like
noise, brokers are almost obliged to supply them with noise.
Fourth, on the surface, the ever-changing nature of the market makes
it difficult to discern what is relevant or important. The market is a
mirror of the economy and collective sentiment of the people who participate in it. As such, the market is a “living” thing and thus evolves
constantly. On the surface, therefore, there is no universal or natural law
that governs the market into eternity. I have intentionally emphasized
the phrase “on the surface” here. Although there is probably no “eternal”
law, there are myriad laws and patterns that govern the market at least for
some extended period of time, in my view. It may be difficult to uncover
these laws and patterns, but with some effort, it can be done.
Preface
xiii
The motivation for writing this book is to transfer what I learned
about the Japanese equity market through years in the industry. I worked
for BZW Tokyo from 1994 to 1997, Merrill Lynch Japan from 1998 to
2000, Teachers Retirement System of Texas from 2000 to 2003, and J.P.
Morgan Japan from 2004 to 2017. Having worked in the capacity of equity
derivatives strategist during most of these periods, I saw the market from
both the top down and the bottom up.
I lived through the aftermath of the collapse of the 1980s colossal
Japanese bubble and saw the spectacular rise of the Japanese equity
market during the internet bubble. I experienced the 2005–2007 global
credit bubble, the subsequent market crash of 2008–2009, and the effect
on the stock market of the Fukushima nuclear accident induced by the
Great East Japan Earthquake in 2011. The next big thing for Japan was
“Abenomics,” which effectively began at the end of 2012, and I am now
privileged to witness what the Japanese equity market will do in light of
Brexit in the UK and Donald Trump’s presidency in the US.
What is written here stems from the accumulation of facts and ideas
from all those periods. In this regard, this is a history book as well as a
guidebook, although the focus is on the period since 2004, after I began
working for J.P. Morgan Japan. Also, this book is not a typical “Equity
101” book. I will not tell you how to pick “good stocks” in general terms.
In fact, I am not even sure if picking “good stocks” works all that well in
Japan (Warren Buffett may disagree on this point).
While some of the subjects covered in the book may be of historical
interest and value only, these were significant at the time and were surely
not “noise.” To understand these historical facts and the lessons learned
from them should no doubt benefit future generations of investors. What
I have tried to do is lay out a simple map of investing in Japanese equities,
with a belief that the paths depicted on this map may indeed help attentive
and shrewd investors pave their own paths to enormous wealth.
On business trips overseas, some investors told me that they would
not invest in Japanese equities because of the nation’s shrinking population and lack of structural reform. While over a very long period of time
their views may prove wise, that is not how you make money in equities.
In my view, the Japanese equity market, when timed correctly, offers the
best money-making opportunities among any major developed markets.
I hope, by reading this book, investors will be able to take advantage of
these fantastic opportunities in the future.
xiv
Preface
History Repeats Itself
“The Japanese equity market, when timed correctly, offers the best moneymaking opportunities among any major markets” is the assertion made in
the last section. Whether we trade equities or other assets, the basic rule is
to “buy low and sell high.” In this sense, the above assertion is not an earthshaking statement. The issue is to know the proper “timing” of the trade.
The reason the Japanese equity market “offers the best money-making
opportunities” is that proper “timing” is relatively easy to identify. This is
because the Japanese equity market, among major developed markets in
the world, responds most sensitively to the global economic conditions,
a tendency largely unbroken since the early 1990s.
Analysts knowing the stock market is similar to doctors knowing
illnesses. The stock market is ever-changing, but what is underneath are
human thoughts and behaviors, just as human blood and genes play a
major role in identifying illnesses. And just as doctors refer to past cases
to find remedies, we need to reflect on past incidents to respond to the
elusive stock market.
This is the reason why I consider this book “a history book,” because
it is a book of case studies. The various indicators and indices that we
may learn about in a textbook only come alive in the context of history.
Whether macro indicators or seasonality, the reason we focus on them is
because they have been useful over significant time. Otherwise, they are
just “noise.”
As long as the equity market follows the trail of corporate profits,
it is a reflection of the economy. If we know which way the economy
is headed, therefore, we should know which way the equity market is
headed. And knowing historical patterns helps us predict the direction of
the economy to a large extent.
The short-term fluctuations of the equity market are not necessarily
due to the economy, however. What is needed in forecasting short-term
moves is an understanding of the “time” or “current,” as those are often
caused by “events.” The word “events” refers not only to policy decisions
and natural disasters, but also to supply-demand imbalance, leading to
sudden fluctuations in the market. Once again, turning the pages of history should help us properly grasp the influence of these “events.”
Needless to say, history does not enable us to know the direction
of the equity market 100%. “History repeats itself” is only a figure of
speech, since after all, time flows only in one direction and the past is
Preface
xv
never exactly the same as the present or the future. But the importance
of knowing history cannot be emphasized enough. If buy-low/sell-high
is the basic principle of equity investing, then knowing the proper timing
is all there is to it, and knowing history generally leads to more accurate
assessment of the timing.
Clearly, I do not claim to know all the causes and effects of the past
events. What is written here are the conclusions I’ve reached from my
experience and analysis and, to that extent, probably does not represent
the full picture. This said, the picture drawn here is perhaps more insightful than most and should aid in guiding investors through a complex
territory called the Japanese equity market.
CHAPTER
1
Macro Indicators and Seasonality
Japanese Equities: A Practical Guide to Investing in the Nikkei, First Edition.
Michiro Naito.
© 2019 John Wiley & Sons, Ltd. Published 2019 by John Wiley & Sons, Ltd.
Macro Indicators and Seasonality
3
I
f the equity market is a reflection of the economy, then what can tell us
about the state of the economy? The answer lies in macro indicators.
Here, we focus on those I believe to be the most effective when used
with the Japanese equity market, the OECD CLI and Economy Watchers’
DI, and those perhaps less effective but nevertheless important, ISMPMI
and seasonality.
OECD CLI
OECD CLI stands for Organization of Economic Co-operation and
Development Composite Leading Indicators, which are the series of
macroeconomic indicators released monthly by the OECD. Since an
in-depth explanation of how these indicators are constructed and
calculated is beyond the scope of this book, interested readers should
refer to the relevant section on the OECD homepage (d
.org/sdd/leading-indicators/).
The OECD CLIs were originally developed by the OECD to forecast
the peaks and valleys of the economy. The history of CLIs goes back to
the 1960s, and throughout the years since, the OECD has endeavored to
examine and improve the accuracy of these indicators. At present, CLIs
are published for each of the OECD member countries, as well as for
larger economic regions.
More concretely, the CLIs result from the collection of economic data
released by the member nations, and thus, the figures calculated monthly
are released about a month and ten days after the fact (e.g., a January
number is usually released around March 10). We may wonder how effective leading indicators can be if the release of the number is delayed
that much. The fact of the matter is that even though the numbers are
released about a month and ten days late, the OECD CLIs still function
as the leading indicators.
Because there are many CLIs corresponding to each OECD member
nation and various regions, the question is which one of them is the most
effective in forecasting the direction of the Japanese equity market. To
my knowledge, the answer is the G7 OECD CLI, which was developed
to predict the direction of the G7 economy. Table 1.1 lists the weight
allocated to the G7 countries in the CLI and which time series are used
for each country to calculate the monthly CLI.
4
Japanese Equities
TABLE 1.1 G7 OECD CLI component countries and weights,
and time series used
Country
Country Weight
Indices
USA
49.95%
Dwelling started
Durable goods new orders
Share price index
Consumer sentiment
Weekly hours of work
Purchasing managers index
Interest rate spread
Japan
13.98%
Inventories to shipment ratio
Import/Export ratio
Loans/Deposits ratio
Monthly overtime hours
Dwelling started
Share price index
Interest rate spread
Small business survey
Germany
10.74%
Business climate
Orders inflow/demand
Export order
Total new orders
Finished goods stocks
Interest rate spread
UK
7.51%
Business climate
New car registration
Consumer confidence
3-month eligible bank bills
Production future tendency
Finished goods stocks
FTSE nonfinancial share price
France
7.30%
New car registration
New job vacancies
Consumer confidence
5
Macro Indicators and Seasonality
TABLE 1.1 (Continued)
Country
Country Weight
Indices
Eonia interest rate
Interest rate spread
Production future tendency
Industrial sector prospects
Finished goods stocks
SBF 250 share price index
Terms of trade
Italy
5.95%
Consumer confidence
3-month interbank rate
Production future tendency
Deflated net new orders
Order books or demand
Terms of trade
Canada
4.56%
Deflated money supply
Housing starts large cities
US purchasing managers index
Consumer confidence
Interest rate spread
Inventories to shipment ratio
Share price index
Source: OECD
The OECD homepage has a further and detailed description of this
CLI, and the monthly time series since January 1959 can be downloaded
here: />A major word of caution is needed when using the time series, however: Investors need to use the deviation from the 1-year moving average
of the original time series. When the deviation is in a positive direction
from the moving average, the market is a “buy,” and otherwise the market is a “sell.” This simple process is an amazingly effective formula in
trading the Japanese equity market.
In the 25-year period of September 1991 to August 2016, by hypothetically trading TOPIX futures according to the above prescription, the
6
Japanese Equities
TABLE 1.2 Trading TOPIX by G7 OECD CLI
Cumulative Return
2083.20%
Average Return
Stdev
11.70%
19.70%
Win Ratio
72.00%
Sources: OECD, TSE
“win ratio” (the percentage of positive returns from the buy-sell process)
is over 72% and the cumulative return is about 2100% (Table 1.2).
Roughly speaking, had we invested JPY10 million in TOPIX futures
at the beginning of 1990, the investment would have generated JPY210
million by August 2016. Had we just held on to TOPIX futures during
the same period, the return could have been negative (depending on
the exact dates). Because the Nikkei 225 (or the “Nikkei”) moves largely
in unison with the TOPIX, similar results should be attained by trading
Nikkei futures by the OECD CLI.
I do not expect readers to accept this claim on face value. Those
skeptical are advised to download the aforementioned G7 OECD CLI
time series onto Excel and conduct their own backtest. What needs to be
done is to calculate the return, assuming that TOPIX was traded based
upon the “buy” and “sell” signals attained from the indicator.
Here, a few salient points should be mentioned. The OECD homepage lists multiple G7 OECD CLI time series. Each is calculated using
different methods, but the time series to be used for the backtest are those
of the Amplitude-adjusted CLI. For generation of appropriate signals, a
1-year moving average of this time series data should be employed.
Additionally, the results obtained by performing this backtest may
not be the exact replica of Table 1.2. The reason, as explained below,
is that the OECD habitually revises the time series, and thus the current
time series may differ from the time series used to calculate Table 1.2.
Consequently, the peaks and troughs of the economy may shift by a
month or so, but that does not affect the long-term performance of the
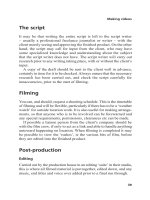
CLI (Figure 1.1).
We also need to take note that this indicator does not function well
pre-1990. The Japanese equity market during the 1980s was the “bubble”
market, which, by definition, tends to defy economic conditions. And
the Japanese economy before the ’80s, except for the hyperinflationary
periods due to the “oil shocks,” is largely characterized by high growth,
and thus was generally not in tune with global economic conditions.
7
Macro Indicators and Seasonality
FIGURE 1.1 Peaks and troughs calculated from G7 OECD CLI and TOPIX
6.00%
3000
OECD CLI
TOPIX
4.00%
2500
2000
0.00%
1500
–2.00%
1000
–4.00%
7
7/
31
/2
01
5
2
01
/2
31
1/
/2
01
31
7/
1/
31
/2
01
0
7
00
/2
00
31
7/
1/
31
/2
00
0
31
7/
/2
31
1/
/2
00
99
5
31
7/
/1
31
1/
/1
99
99
0
/1
99
/1
31
7/
31
5
0
2
–8.00%
7
500
2
–6.00%
1/
TOPIX
OECD CLI
2.00%
Sources: OECD, TSE
As for the revision of the time series, as mentioned above, the CLI is
calculated from a collection of economic data provided by each nation.
Accordingly, often the original economic data may not become available
in time for its first release or be revised by the source after first release
(governments often revise their economic data). In addition, since the
OECD employs a normalization algorithm in calculating the CLI, the past
time series may not match the present ones.
If the time series data is revised on a monthly basis, its validity in
capturing the economic reality of the time may seem questionable. The
OECD, however, in response to this concern, conducted an extensive
examination a few years ago and came to the conclusion that frequent
revisions of the time series do not engender significant errors in the
judgment of economic peaks and troughs. What this means is that the
effectiveness of the CLI examined as of ten years ago, for example, does
not vary greatly from the effectiveness of the CLI ten years ago examined
by using the current time series data.
Table 1.3 is the result of hypothetically trading TOPIX futures by
using the G7 OECD CLI signals generated by the time series frozen at
one arbitrary point in time. In addition, from 2004 on, the “real-time”
data points, as they were released by the OECD, were used for the return
8
Japanese Equities
calculation (in other words, the results are not affected by the time series
alteration).
In the table, “Period” refers to the span of time where the OECD CLI
signal was either going up or coming down, “Long Return” denotes the
return by holding the TOPIX long, and “Short Return” denotes the return
by shorting the TOPIX. In reality, returns were calculated assuming that
TOPIX long and short positions are alternately held.
As the “Win Ratio” of over 70% suggests, we see more positive returns
than negatives. Also, whenever there were significant market moves, the
OECD CLI signals were able to capture them. This is particularly notable
during the internet bubble of the late 1990s, the Koizumi bull market
of mid-2005 to mid-2006, the 2007–2008 Global Financial Crisis, and the
Abenomics bull market from late 2012 onward.
Since the OECD CLI is an economic indicator, when unexpected
events not attributable to the economy take place, the signals generally
suffer inferior returns. Most of the negative returns recorded in Table 1.3
are of this category.
For example, the return well below 10% from May 1997 to October
1997 (TOPIX futures bought following the OECD CLI “buy” signal ended
in a loss) is a direct result of the outbreak of the Asian Financial Crisis in
July of that year. We also see over 20% loss by holding TOPIX long from
June 2001 to July 2002. The loss is due to the collapse of the internet
bubble and 9/11.
The cases where losses were incurred by holding the TOPIX short
tend to be related to policy actions. A good example of this is the –14%
return recorded from February 2014 to January of the next year. In this
case, in order to stimulate the ailing economy of the time, the Bank of
Japan (BoJ) launched the second campaign of quantitative easing (QE)
on October 31, and on the same day, the Government Pension Investment
Fund (GPIF) announced its major asset allocation change, boosting equity
weight to an unprecedented level. In other words, the market rose on the
hopes and expectations based on the potential consequences of these
policy changes, ignoring the weak economic reality.
While this manuscript was being written, at the end of October 2017,
despite the OECD CLI signal that had turned negative in May of the same
year, the Japanese equity market continued to rise. We could identify
several reasons for this.
First, the US equity market was robust, which apparently stemmed
from the signs of the recovery of US economic health and hopes for
9
Macro Indicators and Seasonality
TABLE 1.3 Trading TOPIX futures by OECD CLI
Period
12/10/91–1/11/93
1/11/93–8/10/94
8/10/94–9/11/95
9/11/95–12/10/96
12/10/96–5/12/97
5/12/97–10/13/97
10/13/97–11/10/98
11/10/98–12/10/99
12/10/99–6/11/01
6/11/01–7/10/02
7/10/02–5/12/03
5/12/03–2/10/04
2/10/04–7/11/05
7/11/05–5/12/06
5/12/06–12/11/06
12/11/06–7/10/07
7/10/07–4/10/09
4/10/09–3/5/10
3/5/10–1/11/11
1/11/11–4/11/11
4/11/11–1/12/12
1/12/12–7/9/12
7/9/12–11/9/12
11/9/12–10/9/13
10/9/13–1/14/14
1/14/14–2/10/14
2/10/14–1/13/15
1/13/15–4/9/15
4/9/15–1/12/16
1/12/16–2/8/16
2/8/16–4/11/16
4/11/16–5/10/17
Sources: OECD, TSE
Long Return (%)
Short Return (%)
23.84
29.43
12.45
5.84
3.02
−10.58
19.50
50.35
19.37
−20.24
19.06
23.06
−15.49
41.91
2.51
9.44
51.40
7.88
−0.38
−8.60
13.37
4.39
4.63
60.58
−8.50
−6.29
−14.03
16.75
12.22
−2.94
7.29
23.86
10
Japanese Equities
massive tax cuts. Second, the Chinese economy, not part of the G7
OECD CLI, was strong. Third, there was a landslide victory for the ruling
Liberal Democratic Party (LDP) in Japan’s lower house election held on
October 22. Fourth, there were significant monetary policy differences
between the US and Japan (to be discussed in later chapters).
Indeed, the total OECD CLI, which includes China, turned up in
August 2017 and was able to capture the upside between then and October. Whether we are witnessing a paradigm shift of some sort, where
the G7 OECD CLI may no longer be effective in the world of super-low
interest rates and increasing Chinese influence, remains to be seen.
More on OECD CLI
To understand and appreciate the validity of the OECD CLI, perhaps a
further elaboration is justified. As stated earlier, the G7 OECD CLI is a
collection of economic data from each of the G7 member nations. For its
calculation, the data sets are weighted roughly in proportion to the GDP
of the member nations (the weights are reviewed occasionally).
The US, with the largest GDP, has about 50% weight in the indicator
and therefore is the most influential. The US equity market (more specifically, the S&P500) has low sensitivity to the G7 OECD CLI, however. Not
only that, but even the sensitivity to the American OECD CLI is low. In
other words, the OECD CLI is effective with the Japanese equity market
but not with the US equity market.
To repeat, the Japanese equity market before 1990 also had low sensitivity to the OECD CLI. Viewed long-term, equity markets tend to follow
nominal GDP growths, and thus, if the GDP is growing constantly, the
equity market should grow constantly as well. Accordingly, the difference in the US-Japan GDP growth rates are reflected in the equity market
performance of the two nations.
In the last quarter century, the US equity market saw large downturns
only twice, precipitated by the collapse of the internet bubble and the
2007–2008 Global Financial Crisis (GDP suffered simultaneously). The
rest of the time, the US equity market has largely sloped upward, showing insensitivity to the OECD CLIs, which are designed to capture the
“change” in the economy. Put simply, the US, with its almost constantly
growing GDP, and Japan, with its fluctuating GDP, understandably exhibit
differing patterns in their respective equity market behaviors.
Macro Indicators and Seasonality
11
“Buy and hold” refers to an investment strategy where investors buy
the asset at one point in time and hold it for some period. This strategy is
generally effective in the US equity market. Had we held on to the S&P 500
Index (by renewing futures contracts) since the early 1990s, the return
would have been over 700%, but had we done the same with TOPIX
futures, as mentioned earlier, the return would have been mediocre at
best. No wonder US equity investors generally have “faith” in their equity
market.
Incidentally, regarding the GPIF’s major asset allocation change at the
end of October 2014, briefly touched upon earlier, the investment community was surprised by this bold move, since the 12% weight previously
allocated to domestic equities was elevated to 25% (50% equity weight
including foreign equities). This “event” will be a subject of discussion
later in this book, but the GPIF’s move was undoubtedly patterned after
US pension funds, which generally allocated well over 50% of their assets
to equities.
Funds exposed to the upward-sloping US equity market and funds
exposed to the up-and-down high volatility Japanese equity market
perhaps deserve different asset allocations and treatments, because any
long-term returns of the two markets would be divergent. Whether the
GPIF management paid enough attention to the varying characteristics
of the two markets is questionable, however.
Going back to the main theme of this section, since Japan is a member
nation of the OECD, the organization also calculates the Japanese OECD
CLI. Since the Japanese OECD CLI is uniquely geared toward Japan, we
might expect the Japanese equity market to be more sensitive to this
CLI than to the G7 OECD CLI. The reality, however, is that the Japanese
equity market has behaved more in tune with the G7 OECD CLI (using
the deviation from the 1-year moving average of the original time series).
Anyone who has studied the Japanese equity market should know
that foreign investors play a major role in determining the market’s direction (to be discussed in detail later in this book). Since the 1990s, roughly
two-thirds of the daily trading volume has been attributed to foreign
investors, and this number alone is a testament to their dominance. It is a
little-known fact, however, that the weekly foreign investors’ net transaction data released by the Tokyo Stock Exchange (TSE) largely coincides
with the divergence from the 1-year moving average of the G7 OECD CLI,
the very indicator under consideration.
12
Japanese Equities
This is not to say that every foreign investor follows the OECD CLI
when trading Japanese equities. Rather, it is reasonable to assume that
macro funds and others that trade equity futures probably time their
investments by some sort of macroeconomic indicators (one of which
could be the OECD CLI). In fact, the grapevine says that a world-famous
hedge fund once used the G7 OECD CLI in trading Japanese equities
during the ’90s and never saw a year with a negative return.
Since the OECD CLI is an economic indicator, we would not be surprised to see its effectiveness with other assets outside of equities, as long
as the asset price follows the economy. In this category, I have only tested
the oil price against the G7 OECD CLI, but other commodity prices are
likely to follow a more or less similar path.
As for the oil price, the backtest was conducted very much the same
way as the backtest done with the TOPIX. From the beginning of 2001 to
the end of 2013, the win ratio was an impressive 76% and the cumulative
return was 1045%. The result may not be too surprising, however, as it
only says that the oil price is sensitive to global economic conditions.
“If the OECD CLI is so important, can’t we know the number before
its release?” is a fair question. The answer is, “to some extent, yes.” There
are two reasons why the term “to some extent” is being used here.
As explained earlier, the elements of the OECD CLI are economic
data of the member nations. The data releases are often delayed and may
not make it into the calculation of the OECD CLI in time for first release.
The resulting possibility of revisions in the CLI time series was alluded to
earlier in the text. If the data sets are often not available on time, then it
is even more difficult to get them beforehand. This is the first reason.
The second reason is that the exact computational algorithm of the
CLI is complex. Even if we know every data point that goes into the
computation, we cannot make accurate predictions unless we know
exactly how each data point fits into the equations. Unless we are able
to obtain the exact computational software used by the OECD, the task
is close to impossible.
Still, whether the new CLI figure will come out weaker or stronger
than a month before depends on the changes in each constituent data
point, and some of the constituent data can be attained before their official
release. This is the reason why we can make predictions “to some extent.”
To offer a few examples, if we limit our discussion to the G7 OECD
CLI, the US, which has approximately 50% weight in the indicator as
seen in Table 1.1, has seven elements (as of February 2016)—Housing
Macro Indicators and Seasonality
13
Starts, Durable Goods New Orders, NY Stock Index, Consumer Sentiment,
Weekly Hours of Work, ISMPMI (to be discussed later), and Long-term
Short-term Interest Rate Spread—and all of these can most certainly be
assessed before the official release date of the OECD CLI.
Japan, which has the second largest weight, has elements such as the
Inventory to Shipment Ratio, Import/Export Ratio, Loans/Deposits Ratio,
Monthly Overtime Hours, Dwelling Started, Share Price Index, Interest
Rate Spread, and Small Business Survey. Out of these, at least the Share
Price Index and Interest Rate Spread are readily available to the public
long before the OECD release date. The case is the same with the other
G7 members. If these data points come out significantly “stronger” or
“weaker” than the numbers from the month before, we can likely make
assumptions before their official release that the next OECD CLI numbers
may turn up or down.
The last salient point to be raised is a repeat of what we saw in the
last section and has to do with the fact that the OECD CLI was originally
developed to forecast peaks and troughs of the economy, but asset prices,
whether equities or commodities, while reflecting economic conditions,
do not move because of the economy alone.
To be more precise, over a long period of time, equity markets move
largely in unison with the economy, but in the shorter term, often the
market movements are more affected by factors outside of economic conditions (e.g., policy changes, wars, supply-demand imbalance). It cannot
be emphasized enough that the OECD CLI is suitable for forecasting the
direction of the Japanese equity market over an extended period of time
but not for short-term fluctuations.
The 72% win ratio of the G7 OECD CLI (last reminder, using the
deviation from the 1-year moving average of the original time series)
in predicting the direction of the Japanese equity market is probably
a satisfactory figure for any macroeconomic indicator. The pathway to
“enormous wealth” may be considered well paved by this indicator alone,
and readers may wish to close this book at this point. In other words, if a
reader does not require a return above what the OECD CLI may be able
to provide, the remainder of this book may be considered “noise.”
Simultaneously, however, if we wish to pursue better returns or a
higher probability of winning odds, what the 72% win ratio tells us is
that sometimes we may need to bet against the signals of the OECD CLI.
To make such judgments, we need a better understanding of the market,
which includes not only economic conditions but also information about
14
Japanese Equities
elements outside of the economy, such as policy implications, wars, natural disasters, and seasonality. To quantify the influence of these elements
is clearly not an easy task.
In the future, perhaps AI can solve this problem, but at present, we
can only resort to experience in the market and introspection into human
nature. The remainder of this book will be dedicated to providing and
studying potentially valuable indicators and factors, on top of the OECD
CLI, for better understanding of and benefiting from the Japanese equity
market.
Economy Watchers’ DI
There are myriad macroeconomic indicators, and even casual readers
must have heard somewhere in news reports such terms as “BoJ Tankan,”
“Preliminary GDP,” “US Unemployment Statistics,” and “Manufacturing
PMI.” I have not tested the validity of all of the available macroeconomic
indicators against the Japanese equity market. I have, however, tested
those commonly believed to be important. The conclusion reached is
that most of those indicators were more or less unqualified as leading
indicators of the Japanese equity market.
In the last couple of sections, the validity of the OECD CLI was argued
for extensively (for simplicity, henceforth the term “OECD CLI” will be
used to mean the “deviation from the 1-year moving average of the G7
OECD CLI”). In this section, I would like to introduce another macroeconomic indicator that has the promise of becoming as good as or even
better than the OECD CLI. That macroeconomic indicator is the Economy
Watchers’ DI.
The Economy Watchers’ DI (Diffusion Index) is the resultant data
points and time series of the monthly Economy Watchers’ Survey conducted by the Japanese Cabinet Office. The details of the survey can be
found on the Cabinet Office homepage ( />.html), but put simply, the DI is the collection of answers from 2,500
individuals in position to observe economic activities such as household,
industrial, and employment.
The survey is conducted every month from the 25th to the month’s
end, and the results are made public from the 8th to the 12th of the
following month. The questions asked in the survey are simple: pick the
best answers from “Good,” “Fair,” “Neutral,” “Poor,” and “Bad” about (1)
Macro Indicators and Seasonality
15
the current state of the economy compared with three months before and
(2) the expected future state of the economy two to three months ahead.
Answers come with points weighted by the number of eligible answers
and are summed in the end to calculate the final scores. The time series
“Headline” and “Outlook” are thus generated.
As the effectiveness of the OECD CLI comes alive not from the original time series but from its deviation from the 1-year moving average, it
is interesting to note that the Economy Watchers’ DI also measures the
“change” from 3 months before and to 2 to 3 months ahead. For the Economy Watchers’ DI to have forecasting power comparative to the OECD
CLI, however, the raw time series needs to be modified, according to
backtested results.
The first modification needed is seasonality adjustment, which generally refers to a statistical procedure to eliminate seasonality from time
series data. For example, if we look at retail numbers, we will not be
surprised to see retail business pick up during the Christmas season. If
we ignore the seasonality factor, it looks as though the whole economy
has picked up suddenly. If we really wish to know the state of the economy, rather than comparing November numbers to December numbers,
we should instead compare December numbers this year with December
numbers the year before.
Although a few different statistical methods exist for seasonality
adjustment, the Cabinet Office, fortunately, already provides seasonally
adjusted “Headline” and “Outlook” time series. The actual computational
method used for seasonality adjustment is within the realm of statistics
explained in the aforementioned Cabinet Office homepage. One issue
we may note, however, is that the historical validity of the Economy
Watchers’ DI cannot be examined directly from the raw seasonally
adjusted time series. This is because the seasonality adjustment is
performed once a year and at that time, the whole historical time series
gets modified.
If the whole historical time series gets modified every year, then the
historical backtest appears to become meaningless, because what we see
today as history was not what we saw as history when it was released in
earlier years.
The Cabinet Office, well aware of this issue, examined the difference between the “original” seasonally adjusted time series and the time
series after annual modifications. The conclusion was that the difference
between the two was not of large magnitude. Thus, though perhaps not