The macroeconomics of corruption governance and growth
Bạn đang xem bản rút gọn của tài liệu. Xem và tải ngay bản đầy đủ của tài liệu tại đây (4.04 MB, 312 trang )
Springer Texts in Business and Economics
Maksym Ivanyna
Alex Mourmouras
Peter Rangazas
The Macroeconomics
of Corruption
Governance and Growth
Springer Texts in Business and Economics
More information about this series at />
Maksym Ivanyna • Alex Mourmouras
Peter Rangazas
The Macroeconomics
of Corruption
Governance and Growth
Maksym Ivanyna
Joint Vienna Institute
Vienna, Austria
Alex Mourmouras
Washington, DC, USA
Peter Rangazas
IUPUI Economics, CA 518
Indianapolis, IN, USA
The password protected Solutions Manual is available online at
/>ISSN 2192-4333
ISSN 2192-4341 (electronic)
Springer Texts in Business and Economics
ISBN 978-3-319-68665-3
ISBN 978-3-319-68666-0 (eBook)
/>Library of Congress Control Number: 2017954933
# Springer International Publishing AG 2018
This work is subject to copyright. All rights are reserved by the Publisher, whether the whole or part
of the material is concerned, specifically the rights of translation, reprinting, reuse of illustrations,
recitation, broadcasting, reproduction on microfilms or in any other physical way, and transmission or
information storage and retrieval, electronic adaptation, computer software, or by similar or dissimilar
methodology now known or hereafter developed.
The use of general descriptive names, registered names, trademarks, service marks, etc. in this
publication does not imply, even in the absence of a specific statement, that such names are exempt
from the relevant protective laws and regulations and therefore free for general use.
The publisher, the authors and the editors are safe to assume that the advice and information in this book
are believed to be true and accurate at the date of publication. Neither the publisher nor the authors or the
editors give a warranty, express or implied, with respect to the material contained herein or for any errors
or omissions that may have been made. The publisher remains neutral with regard to jurisdictional claims
in published maps and institutional affiliations.
Printed on acid-free paper
This Springer imprint is published by Springer Nature
The registered company is Springer International Publishing AG
The registered company address is: Gewerbestrasse 11, 6330 Cham, Switzerland
Preface
This book examines the reasons why governments fail to live up to their
responsibilities or worse engage in outright corruption. We focus on the quality
of governance because of its importance in real-world policy making and because it
serves to motivate the development and application of macroeconomic models of
political economy. The book can be viewed as macroeconomic theory mixed with
applied fiscal policy analysis. We especially concentrate on the tendencies of the
government to burden future generations rather than invest in them and the
consequences that this has for long-run economic growth. We present the underlying theories in a serious but self-contained fashion, accessible to anyone who has a
background in intermediate-level microeconomics. A thorough appendix is
provided with the necessary technical background to insure that all those who
wish to follow the analysis carefully will be able to do so. Each chapter includes
exercises to refine understanding and sharpen modeling skills. Solutions to the
exercises can be found on the Springer.com page for the book.
As suggested, the thinking in the book is guided and disciplined by formal
economic models. Formal models are needed, not only to articulate, explain, and
quantify the effects of government corruption and short-sighted policies but also to
demonstrate how economics is intertwined with politics. For example, we use
models to argue that the policies generating the looming fiscal crisis in the developed world are closely connected to other common economic problems: the
slowdown in economic growth, the rise in wage inequality, and the exploding
costs of medical care and higher education.
Most of the basic ideas are illustrated using a two-period model that shows the
future cost of fiscal policies that favor present consumption and misallocate investment (Chap. 2). The more subtle and advanced issues are examined and quantified
using the overlapping-generations model of economic growth (Chap. 4). These base
models, first used to demonstrate the fundamental mechanisms of economic
growth, are then extended to incorporate politics and the behavior of public officials
(Chaps. 3, 5, and 6). The new political economy of macroeconomics can be
technically difficult and conceptually challenging.1 We sacrifice full generality to
incorporate the relevant thinking from the political economy literature as simply as
possible while adding a few new twists along the way. The final product offers a
unified explanation for the causes and consequences of government failure, the
v
vi
Preface
fiscal crisis, growth slowdowns, and rising inequality. The needed policy reforms
that emerge from the analysis are also discussed in detail (Chap. 7).
We have used the text with undergraduates by taking a slow pace, making use of
the background material in the technical appendix, and assigning easier questions
and problems. For example, we have based an intermediate macroeconomics course
on Chap. 2 (Sects. 2.1, 2.2, 2.3, 2.4, and 2.10), Chap. 4, and Chap. 7. In graduate
courses, we go through the material in Chaps. 2 and 4 more quickly; mix in some
political economy from Chaps. 3, 5, and 6; and hold the students responsible for the
harder problems. For researchers, the more original material proposes common
causes of the Big Three economic problems facing the developed world (Sects. 2.4
and 4.8, and Chap. 7), models the cultural connection between tax evasion and
corruption (the portion of Chap. 5 that summarizes our 2016 Economic Inquiry
article), and extends this model to include the interaction between tax evasion,
corruption, and public debt (Chap. 6).
The book has benefited from the comments and assistance of three excellent
young scholars: Mark Giblin, John Hanks, and Stephen Rangazas. We are grateful
that they took an interest in the project and devoted their time to improving the
exposition and clarity of the text.
Vienna, Austria
Washington, DC, USA
Indianapolis, IN, USA
Maksym Ivanyna
Alex Mourmouras
Peter Rangazas
Contents
1
2
Introduction . . . . . . . . . . . . . . . . . . . . . . . . . . . . . . . . . . . . . . . . . .
1.1
Corruption . . . . . . . . . . . . . . . . . . . . . . . . . . . . . . . . . . . . . . .
1.2
Close Cousins: Kleptocracy, Corruption, and Rent-Seeking . . .
1.3
Modeling the Government . . . . . . . . . . . . . . . . . . . . . . . . . . .
1.3.1
Focus on the National Interest . . . . . . . . . . . . . . . . . .
1.3.2
Efficiency of Resource Use . . . . . . . . . . . . . . . . . . . .
1.3.3
Limit Economic Disparity . . . . . . . . . . . . . . . . . . . . .
1.3.4
Value Future Generations . . . . . . . . . . . . . . . . . . . . .
1.4
Tax Evasion . . . . . . . . . . . . . . . . . . . . . . . . . . . . . . . . . . . . . .
1.5
Taxation and Government Debt . . . . . . . . . . . . . . . . . . . . . . .
1.5.1
Endogenous Tax Rates . . . . . . . . . . . . . . . . . . . . . . .
1.5.2
Endogenous Government Debt . . . . . . . . . . . . . . . . . .
1.6
Economic Growth . . . . . . . . . . . . . . . . . . . . . . . . . . . . . . . . .
1.7
Modeling the Culture of Corruption . . . . . . . . . . . . . . . . . . . .
1.8
The Big Three: Growth Slowdown, Wage Inequality,
and Fiscal Crisis . . . . . . . . . . . . . . . . . . . . . . . . . . . . . . . . . . .
1.9
Policy Reforms . . . . . . . . . . . . . . . . . . . . . . . . . . . . . . . . . . .
1.10 Outline . . . . . . . . . . . . . . . . . . . . . . . . . . . . . . . . . . . . . . . . .
1.11 Exercises . . . . . . . . . . . . . . . . . . . . . . . . . . . . . . . . . . . . . . . .
References . . . . . . . . . . . . . . . . . . . . . . . . . . . . . . . . . . . . . . . . . . . .
.
.
.
.
.
.
.
.
.
.
.
.
.
.
1
2
4
8
8
8
8
8
11
14
15
15
18
19
.
.
.
.
.
20
22
24
25
27
Two-Period Model of Government Investment . . . . . . . . . . . . . . . .
2.1
The Life-Cycle Model of Consumption and Saving . . . . . . . . .
2.1.1
Borrowing Constraints . . . . . . . . . . . . . . . . . . . . . . . .
2.2
Introducing the Government . . . . . . . . . . . . . . . . . . . . . . . . . .
2.2.1
Taxes and Government Investment . . . . . . . . . . . . . . .
2.2.2
Public Debt and Government Investment . . . . . . . . . .
2.3
The Small-Open Economy Model . . . . . . . . . . . . . . . . . . . . . .
2.3.1
Private and Public Credit . . . . . . . . . . . . . . . . . . . . . .
2.3.2
Only Public Credit . . . . . . . . . . . . . . . . . . . . . . . . . . .
2.4
Human Capital, Inequality, and Public Debt . . . . . . . . . . . . . .
2.5
Public Capital and Productivity . . . . . . . . . . . . . . . . . . . . . . . .
.
.
.
.
.
.
.
.
.
.
.
31
32
34
35
36
37
38
39
41
43
46
vii
viii
3
Contents
2.6
2.7
2.8
Pure and Impure Public Capital . . . . . . . . . . . . . . . . . . . . . . . .
The Allocation of Public Capital . . . . . . . . . . . . . . . . . . . . . . .
Fiscal Federalism . . . . . . . . . . . . . . . . . . . . . . . . . . . . . . . . . .
2.8.1
Tax Financing of Regional Investment . . . . . . . . . . . .
2.8.2
Bond Financing of Regional Investment . . . . . . . . . . .
2.9
A Note on Migration . . . . . . . . . . . . . . . . . . . . . . . . . . . . . . .
2.10 A Dynamic Generational Model . . . . . . . . . . . . . . . . . . . . . . .
2.10.1 The Growth Model . . . . . . . . . . . . . . . . . . . . . . . . . .
2.10.2 The Investment Share . . . . . . . . . . . . . . . . . . . . . . . .
2.11 Principles for Tax Collection . . . . . . . . . . . . . . . . . . . . . . . . .
2.12 Conclusion . . . . . . . . . . . . . . . . . . . . . . . . . . . . . . . . . . . . . .
2.12.1 Basic Principles . . . . . . . . . . . . . . . . . . . . . . . . . . . . .
2.12.2 Regional Issues and Inequality . . . . . . . . . . . . . . . . . .
2.12.3 Identifying the Influence of Politics . . . . . . . . . . . . . .
2.13 Exercises . . . . . . . . . . . . . . . . . . . . . . . . . . . . . . . . . . . . . . . .
References . . . . . . . . . . . . . . . . . . . . . . . . . . . . . . . . . . . . . . . . . . . .
.
.
.
.
.
.
.
.
.
.
.
.
.
.
.
.
47
49
52
52
54
56
57
58
60
62
62
62
63
63
64
70
Politics and Corruption in the Two-Period Model . . . . . . . . . . . . .
3.1
Fiscal Policy with Policy Makers . . . . . . . . . . . . . . . . . . . . . .
3.2
The Politics of Investment Allocation . . . . . . . . . . . . . . . . . . .
3.3
Fiscal Federalism with Politics . . . . . . . . . . . . . . . . . . . . . . . .
3.3.1
Extending the Fiscal Federalism Model . . . . . . . . . . .
3.3.2
No Political Influence . . . . . . . . . . . . . . . . . . . . . . . .
3.3.3
Equilibrium with Political Influence . . . . . . . . . . . . . .
3.3.4
A Note on Decentralization . . . . . . . . . . . . . . . . . . . .
3.4
Foreign Funding and Regional Inequality . . . . . . . . . . . . . . . .
3.4.1
Foreign Funding for the Poor Region . . . . . . . . . . . . .
3.4.2
Focusing on Corruption . . . . . . . . . . . . . . . . . . . . . . .
3.5
Political Polarization . . . . . . . . . . . . . . . . . . . . . . . . . . . . . . .
3.5.1
Polarization and Deficit Bias . . . . . . . . . . . . . . . . . . .
3.5.2
Public Investment . . . . . . . . . . . . . . . . . . . . . . . . . . .
3.5.3
Fiscal Rules . . . . . . . . . . . . . . . . . . . . . . . . . . . . . . .
3.6
Interest Groups and Rent Seeking . . . . . . . . . . . . . . . . . . . . . .
3.6.1
Cooperative Solution . . . . . . . . . . . . . . . . . . . . . . . . .
3.6.2
Non-cooperative Solution . . . . . . . . . . . . . . . . . . . . .
3.6.3
Foreign Aid . . . . . . . . . . . . . . . . . . . . . . . . . . . . . . . .
3.7
Determinants of Corruption . . . . . . . . . . . . . . . . . . . . . . . . . .
3.7.1
Behavior of a Public Official . . . . . . . . . . . . . . . . . . .
3.7.2
Equilibrium Corruption . . . . . . . . . . . . . . . . . . . . . . .
3.7.3
Further Issues to Be Resolved . . . . . . . . . . . . . . . . . .
3.8
Conclusion . . . . . . . . . . . . . . . . . . . . . . . . . . . . . . . . . . . . . .
3.9
Exercises . . . . . . . . . . . . . . . . . . . . . . . . . . . . . . . . . . . . . . . .
Appendix . . . . . . . . . . . . . . . . . . . . . . . . . . . . . . . . . . . . . . . . . . . . .
References . . . . . . . . . . . . . . . . . . . . . . . . . . . . . . . . . . . . . . . . . . . .
.
.
.
.
.
.
.
.
.
.
.
.
.
.
.
.
.
.
.
.
.
.
.
.
.
.
.
73
75
77
81
81
83
84
86
87
87
89
89
89
91
93
94
96
96
99
100
101
102
102
103
104
107
108
Contents
4
5
Overlapping-Generations Model of Economic Growth . . . . . . . . . .
4.1
Firms, Production, and the Demand for Capital . . . . . . . . . . . .
4.2
Household Saving and the Supply of Capital . . . . . . . . . . . . . .
4.2.1
The Supply of Labor and Capital . . . . . . . . . . . . . . . .
4.2.2
Household Saving . . . . . . . . . . . . . . . . . . . . . . . . . . .
4.2.3
Supply of Capital per Worker . . . . . . . . . . . . . . . . . . .
4.3
Competitive Equilibrium in a Growing Economy . . . . . . . . . . .
4.3.1
Steady State Growth—Technical Progress . . . . . . . . .
4.4
Quantitative Theory . . . . . . . . . . . . . . . . . . . . . . . . . . . . . . . .
4.4.1
Calibration . . . . . . . . . . . . . . . . . . . . . . . . . . . . . . . .
4.4.2
Historical Simulation . . . . . . . . . . . . . . . . . . . . . . . . .
4.5
Introducing the Government . . . . . . . . . . . . . . . . . . . . . . . . . .
4.5.1
The Fiscal Gap . . . . . . . . . . . . . . . . . . . . . . . . . . . . .
4.5.2
Government Capital and Private Production . . . . . . . .
4.5.3
Households with Taxes and Transfers . . . . . . . . . . . . .
4.5.4
Capital Market Equilibrium and Fiscal Policy . . . . . . .
4.6
Fiscal Policy . . . . . . . . . . . . . . . . . . . . . . . . . . . . . . . . . . . . .
4.6.1
Government Purchases–Consumption . . . . . . . . . . . . .
4.6.2
Government Purchases–Consumption
and Investment . . . . . . . . . . . . . . . . . . . . . . . . . . . . .
4.6.3
Intergenerational Policy . . . . . . . . . . . . . . . . . . . . . . .
4.6.4
Debt Policy #1 . . . . . . . . . . . . . . . . . . . . . . . . . . . . .
4.6.5
Debt Policy #2 . . . . . . . . . . . . . . . . . . . . . . . . . . . . .
4.6.6
Government Pensions—Fully Funded . . . . . . . . . . . . .
4.6.7
Government Pensions—Pay-As-You-Go (PAYG) . . . .
4.7
Capital Accumulation in an Open Economy . . . . . . . . . . . . . . .
4.7.1
Open Capital Markets and Growth
in Developing Countries . . . . . . . . . . . . . . . . . . . . . .
4.8
The Fiscal Crisis . . . . . . . . . . . . . . . . . . . . . . . . . . . . . . . . . .
4.8.1
The Fundamentals . . . . . . . . . . . . . . . . . . . . . . . . . . .
4.8.2
The Politics . . . . . . . . . . . . . . . . . . . . . . . . . . . . . . . .
4.9
Generational Accounting . . . . . . . . . . . . . . . . . . . . . . . . . . . .
4.10 Exercises . . . . . . . . . . . . . . . . . . . . . . . . . . . . . . . . . . . . . . . .
Appendix . . . . . . . . . . . . . . . . . . . . . . . . . . . . . . . . . . . . . . . . . . . . .
The Government Intertemporal Budget Constraint . . . . . . . . . .
Tax Rates . . . . . . . . . . . . . . . . . . . . . . . . . . . . . . . . . . . . . . .
References . . . . . . . . . . . . . . . . . . . . . . . . . . . . . . . . . . . . . . . . . . . .
Politics, Corruption, and Economic Growth . . . . . . . . . . . . . . . . . .
5.1
Government: Benevolent Dictator or Kleptocrat? . . . . . . . . . . .
5.1.1
Firms . . . . . . . . . . . . . . . . . . . . . . . . . . . . . . . . . . . .
5.1.2
Households . . . . . . . . . . . . . . . . . . . . . . . . . . . . . . . .
5.1.3
Capital Market Equilibrium . . . . . . . . . . . . . . . . . . . .
5.1.4
Government . . . . . . . . . . . . . . . . . . . . . . . . . . . . . . .
5.1.5
Steady State Equilibria and Income Gaps . . . . . . . . . .
ix
.
.
.
.
.
.
.
.
.
.
.
.
.
.
.
.
.
.
111
112
116
116
117
118
119
122
123
125
127
129
131
131
132
133
133
134
.
.
.
.
.
.
.
135
136
137
138
138
139
139
.
.
.
.
.
.
.
.
.
.
140
142
144
145
146
148
155
155
156
157
.
.
.
.
.
.
.
159
162
162
162
163
163
166
x
Contents
5.1.6
Opening the Economy . . . . . . . . . . . . . . . . . . . . . . . .
5.1.7
Foreign Aid . . . . . . . . . . . . . . . . . . . . . . . . . . . . . . . .
5.2
Wagner’s Law and Interest Groups . . . . . . . . . . . . . . . . . . . . .
5.2.1
Households . . . . . . . . . . . . . . . . . . . . . . . . . . . . . . . .
5.2.2
Firms . . . . . . . . . . . . . . . . . . . . . . . . . . . . . . . . . . . .
5.2.3
Open Economy . . . . . . . . . . . . . . . . . . . . . . . . . . . . .
5.2.4
Government Policy . . . . . . . . . . . . . . . . . . . . . . . . . .
5.3
Tax Evasion . . . . . . . . . . . . . . . . . . . . . . . . . . . . . . . . . . . . . .
5.4
A Benchmark Economy Without Corruption-Evasion . . . . . . . .
5.4.1
Private Households . . . . . . . . . . . . . . . . . . . . . . . . . .
5.4.2
Public Officials . . . . . . . . . . . . . . . . . . . . . . . . . . . . .
5.4.3
Firms . . . . . . . . . . . . . . . . . . . . . . . . . . . . . . . . . . . .
5.4.4
Capital Market Equilibrium and Fiscal Policy . . . . . . .
5.4.5
Fiscal Policy . . . . . . . . . . . . . . . . . . . . . . . . . . . . . . .
5.4.6
Calibrating the Benchmark Economy . . . . . . . . . . . . .
5.5
An Economy with Corruption and Evasion . . . . . . . . . . . . . . .
5.5.1
Preferences . . . . . . . . . . . . . . . . . . . . . . . . . . . . . . . .
5.5.2
Private Households . . . . . . . . . . . . . . . . . . . . . . . . . .
5.5.3
Public Officials . . . . . . . . . . . . . . . . . . . . . . . . . . . . .
5.5.4
Corruption, Evasion, and Investment for a Given
Tax Rate . . . . . . . . . . . . . . . . . . . . . . . . . . . . . . . . . .
5.5.5
Economy’s Transition Equations . . . . . . . . . . . . . . . .
5.5.6
Corruption, Evasion, and the Tax Rate . . . . . . . . . . . .
5.5.7
Calibration . . . . . . . . . . . . . . . . . . . . . . . . . . . . . . . .
5.5.8
Corruption, Evasion, and Output . . . . . . . . . . . . . . . .
5.6
Conclusion . . . . . . . . . . . . . . . . . . . . . . . . . . . . . . . . . . . . . .
5.7
Exercises . . . . . . . . . . . . . . . . . . . . . . . . . . . . . . . . . . . . . . . .
References . . . . . . . . . . . . . . . . . . . . . . . . . . . . . . . . . . . . . . . . . . . .
6
Corruption and Public Debt . . . . . . . . . . . . . . . . . . . . . . . . . . . . . .
6.1
Theories of Government Debt . . . . . . . . . . . . . . . . . . . . . . . . .
6.2
Corruption and Altruism in the Two-Period Model . . . . . . . . .
6.2.1
Fiscal Policy . . . . . . . . . . . . . . . . . . . . . . . . . . . . . . .
6.3
An Overlapping-Generations Model Without Corruption
and Evasion . . . . . . . . . . . . . . . . . . . . . . . . . . . . . . . . . . . . . .
6.3.1
The Baseline Model . . . . . . . . . . . . . . . . . . . . . . . . . .
6.3.2
Calibration . . . . . . . . . . . . . . . . . . . . . . . . . . . . . . . .
6.4
An Economy with Corruption and Evasion . . . . . . . . . . . . . . .
6.4.1
Calibration and Simulation . . . . . . . . . . . . . . . . . . . . .
6.4.2
Empirical Implications . . . . . . . . . . . . . . . . . . . . . . . .
6.5
Empirical Evidence . . . . . . . . . . . . . . . . . . . . . . . . . . . . . . . .
6.5.1
Public Debt Cycles . . . . . . . . . . . . . . . . . . . . . . . . . .
6.5.2
Corruption and Debt . . . . . . . . . . . . . . . . . . . . . . . . .
6.5.3
Public Debt, Corruption, and Growth . . . . . . . . . . . . .
.
.
.
.
.
.
.
.
.
.
.
.
.
.
.
.
.
.
.
168
169
170
171
172
172
173
176
177
177
177
179
179
179
180
181
182
182
183
.
.
.
.
.
.
.
.
185
186
187
188
189
190
191
193
.
.
.
.
195
196
198
200
.
.
.
.
.
.
.
.
.
.
203
203
208
208
211
213
216
217
217
219
Contents
xi
6.6
Conclusion . . . . . . . . . . . . . . . . . . . . . . . . . . . . . . . . . . . . . . .
6.7
Exercises . . . . . . . . . . . . . . . . . . . . . . . . . . . . . . . . . . . . . . . . .
References . . . . . . . . . . . . . . . . . . . . . . . . . . . . . . . . . . . . . . . . . . . . .
219
220
222
7
The Political Economy of Fiscal Reforms . . . . . . . . . . . . . . . . . . . .
7.1
Economic Fundamentals . . . . . . . . . . . . . . . . . . . . . . . . . . . . .
7.1.1
Aging and Rising Health Care Costs . . . . . . . . . . . . . .
7.1.2
Slowing Long-Run Economic Growth . . . . . . . . . . . .
7.1.3
Rising Wage Inequality . . . . . . . . . . . . . . . . . . . . . . .
7.1.4
Policies Addressing the Economic Fundamentals . . . .
7.2
Politics . . . . . . . . . . . . . . . . . . . . . . . . . . . . . . . . . . . . . . . . .
7.2.1
Corruption, Tax Evasion, and Public Debt . . . . . . . . .
7.2.2
Interest Groups and Public Debt . . . . . . . . . . . . . . . . .
7.2.3
Transparency . . . . . . . . . . . . . . . . . . . . . . . . . . . . . .
7.2.4
Budget Process and Rules . . . . . . . . . . . . . . . . . . . . .
7.2.5
Polarization . . . . . . . . . . . . . . . . . . . . . . . . . . . . . . . .
7.2.6
Summary . . . . . . . . . . . . . . . . . . . . . . . . . . . . . . . . .
7.3
Reforming Foreign Aid . . . . . . . . . . . . . . . . . . . . . . . . . . . . .
7.3.1
Needed: Accountants Without Borders . . . . . . . . . . . .
7.3.2
Alternative Pre-conditions for Aid . . . . . . . . . . . . . . .
7.3.3
Multi-lateral Aid . . . . . . . . . . . . . . . . . . . . . . . . . . . .
7.3.4
A Knowledge Bank of Development Projects . . . . . . .
7.3.5
Deal with Corruption First . . . . . . . . . . . . . . . . . . . . .
7.4
Exercises . . . . . . . . . . . . . . . . . . . . . . . . . . . . . . . . . . . . . . . .
References . . . . . . . . . . . . . . . . . . . . . . . . . . . . . . . . . . . . . . . . . . . .
.
.
.
.
.
.
.
.
.
.
.
.
.
.
.
.
.
.
.
.
.
227
228
228
231
237
239
248
249
250
251
254
255
256
256
256
257
258
258
259
259
261
8
Conclusion . . . . . . . . . . . . . . . . . . . . . . . . . . . . . . . . . . . . . . . . . . .
8.1
Summary . . . . . . . . . . . . . . . . . . . . . . . . . . . . . . . . . . . . . . . .
8.1.1
Why Does Sustained Modern Economic
Growth Fail to Take-Off? . . . . . . . . . . . . . . . . . . . . .
8.1.2
Why Does Foreign Aid to Governments
of Developing Countries Fail to Generate Growth? . . .
8.1.3
Why Does Long-Run Growth Eventually Slow? . . . . .
8.1.4
Why Is Income Inequality on the Rise? . . . . . . . . . . . .
8.1.5
Why Have Fiscal Crises Become Commonplace,
Threatening the Prosperity of Most Developed
Countries? . . . . . . . . . . . . . . . . . . . . . . . . . . . . . . . . .
8.2
Is Government Failure Inevitable? . . . . . . . . . . . . . . . . . . . . . .
8.3
Historical Lessons? . . . . . . . . . . . . . . . . . . . . . . . . . . . . . . . .
8.3.1
Is the United States, Rome? . . . . . . . . . . . . . . . . . . . .
8.3.2
Other Empires . . . . . . . . . . . . . . . . . . . . . . . . . . . . . .
8.4
Suggestions for Further Reading and Study . . . . . . . . . . . . . . .
References . . . . . . . . . . . . . . . . . . . . . . . . . . . . . . . . . . . . . . . . . . . .
.
.
267
267
.
267
.
.
.
268
268
269
.
.
.
.
.
.
.
270
271
272
273
276
281
282
xii
Contents
Technical Appendix . . . . . . . . . . . . . . . . . . . . . . . . . . . . . . . . . . . . . . .
A.1 Two Useful Functions . . . . . . . . . . . . . . . . . . . . . . . . . . . . . . . . . .
A.2 Optimization . . . . . . . . . . . . . . . . . . . . . . . . . . . . . . . . . . . . . . . .
A.3 Nonnegativity Constraints and Corner Solutions . . . . . . . . . . . . . . .
A.4 Total Differentials and Linear Approximations . . . . . . . . . . . . . . . .
A.5 L’Hospital’s Rule . . . . . . . . . . . . . . . . . . . . . . . . . . . . . . . . . . . . .
A.6 Expected Utility . . . . . . . . . . . . . . . . . . . . . . . . . . . . . . . . . . . . . .
A.7 Game Theory and Nash Equilibrium . . . . . . . . . . . . . . . . . . . . . . .
A.8 Quadratic Equations . . . . . . . . . . . . . . . . . . . . . . . . . . . . . . . . . . .
A.9 Infinite Series . . . . . . . . . . . . . . . . . . . . . . . . . . . . . . . . . . . . . . . .
.
.
.
.
.
.
.
.
.
.
285
285
288
292
295
296
297
298
299
300
Index . . . . . . . . . . . . . . . . . . . . . . . . . . . . . . . . . . . . . . . . . . . . . . . . . . .
301
1
Introduction
It is clear that the government is needed to lay the foundation for economic
development. Development cannot occur without a public infrastructure that
establishes and facilitates markets via the provision of national defense, a transportation system, legal protection of private property and marketable ideas, education
and basic research, and a stable currency. In the early stages of development,
governments also establish the first banks and corporations, often in partnership
with private owners. The fundamental issue of public sector economics is how to
constrain the government to provide these goods and services in a way that benefits
most citizens rather than the private interests of politicians and the relatively small
groups of their most important supporters.
The performance of governments in leading their country’s economic growth is
frequently disappointing. Selfish and political motives pull resources away from
investment in future productivity and toward financing current consumption of
favored groups. As a result, sustained growth in many poor countries has never
occurred. Previously successful economies have seen growth stall and income
inequality increase. Expanding social insurance programs in rich countries have
resulted in public debt trajectories that place heavy fiscal burdens on future
generations, to the point of creating potential fiscal crises that could send their
economies into recessions or worse.
Education policies in developed countries are misallocating human capital
investments, contributing to a slowdown in economic growth and a rise in wage
inequality. Partly due to selfish motives and partly due to ignorance, there is too
much attention and funding focused on college and college-preparation. Despite
this bias, enrollment and graduation rates at 4 year universities have not significantly improved. Standards are also slipping as both high school and college have
an increasingly larger “consumption” component. College costs are rising faster
than income at the same time that the skills being acquired are falling. The small
minority of each age-cohort that obtains more than a 4-year degree is the main
reason for the high average return to college. The majority of each age-cohort does
not even attend or fails to graduate from a 4-year program and, because of the bias
# Springer International Publishing AG 2018
M. Ivanyna et al., The Macroeconomics of Corruption, Springer Texts in Business
and Economics, />
1
2
1
Introduction
toward college preparation in high school, has acquired few productive skills to fall
back on.
Why do governments fail to live up to their responsibilities or worse, engage in outright
corruption?
1.1
Corruption
The ancient Greeks invented a democracy with perhaps more direct participation by
(male) citizens than democracies today. Despite the active participation of its
citizenry, they remained quite worried about the selfish motives of politicians.
Aristotle was concerned that the government could assume a perverted form
where rulers’ decisions are dominated by private interest.1 The ancient Greek
historian Polybius focused on corruption, which he defined as the decay of government into one that fails to deliver for, and even mistreats, its citizens.2 Thucydides
saw the root of corruption as the broader human failing to avoid greed and
overreach when placed in positions of wealth and power.3
Similar to the ancient Greeks, many analysts today define corruption broadly as
government behavior that ignores the public’s welfare in favor of narrow private
interests.4 This broad definition includes rent seeking behavior that is technically
legal but has the potential to reduce economic efficiency by creating excessive pork
barrel spending, monopoly power, and weak enforcement of justifiable regulations.
Although we discuss several aspects of rent seeking, as well as simply bad policies
carried out by selfish dictators, we define corruption more narrowly to include
activities that are illegal within the laws of a country.
At least in principle, this conservative approach makes corruption easier to
detect and measure, apart from the flaws of legal politics and policy making.
However, a perfect separation is impossible. Illegal corruption is probably highly
correlated with the most offensive and costly types of legal rent seeking and the
worst policy abuses of dictators. In addition, selfish behavior of government
officials may be technically legal, by the standards of the country’s laws, but
essentially equivalent to corruption in terms of economic consequences. In some
places, such as Ukraine, corruption is so infused throughout the government that
corruption and the government’s normal day-to-day operations cannot be separated
in a meaningful way.5 All activities that are not in the national interest can distort
fiscal policy away from growth, efficiency, and fairness considerations, so any
1
Wallis (2006, p. 23).
Glaeser and Goldin (2006, p. 7).
3
Woodruff (1993).
4
See, for example, Bueno and Smith (2012) and Cost (2015).
5
de Wall (2016).
2
1.1
Corruption
3
attempt at perfectly clear distinction is somewhat artificial. In the end, it would
perhaps be better to let corruption be defined in the eye of the beholder, independent
of a particular legal definition. The methods that we develop to study corruption can
also be used to study many forms of legal rent-seeking and selfish policy making.
We also make a distinction between petty corruption and grand corruption. Petty
corruption involves bribing bureaucrats who are responsible for implementing and
enforcing laws and regulations. If the laws and regulations of a country are
counterproductive, then bribes that help avoid them can improve efficiency. For
this reason, we focus on the grand corruption of high-level politicians who are
responsible for setting the country’s economic policy. Grand corruption has not
received as much attention in the literature but we think it is more closely related to
fiscal crises and more likely to undermine an economy’s growth.
Our interest in economic growth leads us to examine the corruption associated
with budgeting and implementing public investment projects. There is evidence
that large fractions of the budgets allocated for public school investments6 and
physical capital infrastructure7 are diverted to public officials and their supporters
for private use. The diversion of funds can take the form of direct skimming of the
investment budgets or through bribes that cause public officials to select overpriced bids on public projects and procurements.
Large construction projects (e.g. schools, roads, ports, dams, military
complexes) are favorites in more autocratic regimes of developing countries
because they create easy-pickings for dictators and their cronies.8 However, these
projects also create corruption opportunities in the democracies of developed
countries. For example, corruption problems intensified during the 1980s in Greece,
Italy, and Turkey as infrastructure spending rose. In Greece, much of the corruption
involved collusion between government officials and foreign companies in Europe
that supplied equipment, defense goods, and infrastructure construction to Greece.9
In Italy, the famous mani pulite trials of the 1990s exposed widespread corruption
associated with public works projects that had been going on for decades.10 In
Turkey, the early eighties saw domestic market liberalization, privatization of staterun industries, and an expansion in infrastructure projects. The expansion in
economic activity caused a rise in corruption associated with privatization deals
and public contracting.11
Brazil is currently embroiled in corruption scandals that reach to the highest
levels of government. One aspect of the scandals is the rigging and over-budgeting
6
Reinikka and Svensson (2004).
Tanzi and Davoodi (1997), Pritchett (1996, 2000), Keefer and Knack (2007), Olken (2007),
Baliamoune-Lutz and Ndikumana (2008), and Hague and Kneller (2008, 2012).
8
Bueno de Mesquita and Smith (2012), van der Does de Willebois et al. (2011), and
Chayes (2015).
9
Zoakos (2010).
10
Cohen and Federico (2001), Brosio and Marchese (1986), and Tanzi and Davoodi (1997).
11
Olsson (2014, pp. 271–272) and Zurcher (2004, pp. 267, 286, and 308–309).
7
4
1
Introduction
of construction contracts paid out to Brazil’s two largest construction companies.
This is just the most recent example of inefficient government investment made by
the Brazilian government— investment made not in the national interest, but rather
to maximize the bribes received by public officials.12
Even countries that appear clean by standard measures have significant corruption issues. Ireland has little in the way of petty corruption where bribes are offered
to avoid laws and regulations or to obtain timely governments services. However,
corruption played a role in Ireland’s housing bubble and financial crisis, with the
government heavily involved in side-deals with builders and property developers.13
In Japan, standard corruption measures fail to capture deeply institutionalized legal
political corruption.14 The Japanese practice of amakudari involves systematically
stockpiling assets and opportunities for the benefit of specific subgroups of public
servants. Part of this system involves building infrastructure of questionable utility
to support quasi-public corporations charged with operating them. The amakudari
tradition has given Japan one of the largest collections of government-controlled
physical assets. Using tax payer funds, those operating these corporations receive
lucrative salaries and benefits.
It seems likely that high-level political corruption in Ireland and entrenched
corruption in Japan played some role in the sharp expansion of unnecessary
investment projects financed by public debt. While the role of corruption in their
stories might be missed by studies using available measures of corruption, they fit
the corruption-investment scenario modeled in the book. The fact that corruption
and the infrastructure spending that is needed for economic growth often go handin-hand in both autocratic and democratic regimes is a major reason for our focus.
Beyond the direct consequences of corruption itself, we also consider how the
form of fiscal policy is affected by the opportunity to divert public funds for private
use (Chaps. 3, 5, and 6). We link rent seeking and corruption to the level of tax
rates, the composition of government expenditures, and the extent to which public
debt is relied on for financing. The effects of the resulting changes in fiscal policy
on economic growth are then also studied.
1.2
Close Cousins: Kleptocracy, Corruption, and Rent-Seeking
Bad governance, where public officials serve themselves and close supporters at the
expense of the nation as a whole, takes many forms. In strong autocratic regimes
with little threat of overthrow, the dictator and his close supporters establish the
rules and the resulting policies. In this setting, little effort is made to disguise the
intent of the government’s objectives. In less powerful autocracies and weak
democracies, there is some independent rule of law or some threat of political
12
Romeromarch (2016) and Lyons and Luhnow (2016).
Clarke and Hardiman (2012).
14
Jones (2015).
13
1.2
Close Cousins: Kleptocracy, Corruption, and Rent-Seeking
5
Table 1.1 Government size—selected low-income countries (1985)
Country
Angola
Burkina Faso
Central African Republic
Comoros
Ethiopia
Gambia
Mozambique
Uganda
Average
Government purchases/GDP
0.36
0.29
0.44
0.49
0.28
0.37
0.31
0.28
0.32
yUS/ycountry
11
33
17
10
40
17
33
33
24
Source: Alan Heston, Robert Summers, and Bettina Aten, Penn World Table Version 6.1, Center
for International Comparisons at the University of Pennsylvania, October 2002
entry by other groups.15 Here, policy must have a broader appeal and corruption
must be more subtle and discrete. In strong democracies, it is harder to be corrupt
without getting caught. The bigger problem becomes legal rent seeking, which in
the end often has similar effects as corruption proper.
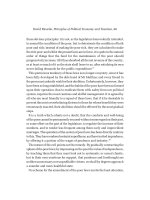
Strong autocratic regimes tend to set tax rates to maximize revenue without
regard to efficiency considerations. This causes the country to have a large government, especially relative to its stage of development. For example, several poor
African countries have ratios of government purchases to GDP in excess of 30%,
far greater than the less than 20% ratios found in countries such as the U.S.16
Table 1.1 gives examples of poor countries (1/10 of US worker productivity,
denoted by yUS, or less) with ratios of government purchases to GDP that about
double those of the US. The comparison is for 1985, a year that generates close to
the largest income gaps between the U.S. and most the African countries during the
twentieth century.17 Starting in the 1990s, Africa began growing faster. Most of the
countries in Table 1 have grown between 4 and 9% per year since the mid-1990s.
The exceptions are the Central African Republic and Comoros, whose growth rates
remain low and thus have seen their income gaps expand.
We should not be viewed as picking on Africa. There are plenty examples of
similar behavior outside of Africa, where the majority is heavily taxed to benefit a
small minority. Consider the regimes of Milosevic in Serbia, Suharto in Indonesia,
and Duvalier in Haiti. In some cases, the incentive to both benefit the coalition of
supporters and harm opponents with high taxes is so strong that the country’s tax
rates exceed those that maximize government revenue.18 We provide an explanation for this counter-intuitive policy choice in Chap. 5.
15
Mulligan and Tsui (2015).
Das et al. (2015) and Mourmouras and Rangazas (2009).
17
Van der Does de Willebois et al. (2011, Table 1.1).
18
Padro i Miguel (2007).
16
6
1
Introduction
In Chap. 5, we also develop a growth model with endogenous fiscal policy
formation. We use the model to capture the ways that autocratic regimes set their
fiscal policy. The information in Table 1.1 is used to calibrate a parameter that
captures the relative weight the government places on the welfare of private
households versus its own consumption. Variation in this determinant of government quality can be used to compute different fiscal policies and their effects on
economic growth.
In less strong autocracies and weak democracies of developing countries, more
subtlety must be used to circumvent laws or make the redistribution of wealth less
obvious. A common strategy is to label government spending as public investment,
when in fact the majority of the spending is simply a transfer to government
officials and supporters—a key feature of one of the models used in Chap. 5. In
Egypt since the 1970s, a large portion of public funds have been used for projects
that essentially create consumption benefits for the military and big businesses
closely aligned with the ruling party. Public investment elsewhere in the country
was consistently over-budgeted and carried out with low quality materials,
providing plenty of unused cash for public officials. In Afghanistan during the
1980s, contracts were written to build hundreds of structures for drying grapes.
About 20 were actually built, the rest of the funds were pocketed by public officials
and favored contractors.19 In the Philippines under Marcos, two billion dollars were
budgeted to build a nuclear power plant that never was able to produce energy.20
From 1996 to 2000, the government of Trinidad and Tobago rigged the bidding to
select overpriced bids for the construction of an international airport. The government officials involved in the scandal went as high as the country’s finance minister.
In 2002, the Kenyan government awarded a contract to a fictitious company for
32 million euros to replace its passport printing system and then subcontracted it to
a French company to do the job for six million euros.21
Several well-established democracies in richer countries have also failed to
control corruption. Despite the mani pulite trials mentioned above, Italy has failed
to establish long-term reforms capable of limiting the return and growth of corruption. Recent arrests of government officials, including several high-ranking ones,
were reported in 2014 and 2015. The arrests were based on illegal involvement in
public construction projects that diverted funds for private use. The more highprofile cases among these were associated with Expo 2015 in Milan, the Venice
flood barrier, and high speed train rails in Florence.22 Reflecting on these events,
Antonio Di Pietro, a leading magistrate during the mani pulite investigations, said,
19
Chayes (2015).
Pritchett (1996).
21
van der Does de Willebois et al. (2011).
22
See Rueters news service reports for May 9, 2014, June 13, 2014, and March 16, 2015 on
Rueters.com.
20
1.2
Close Cousins: Kleptocracy, Corruption, and Rent-Seeking
7
There is nothing new under the sun. Corruption continues to exist, like back then, and
nothing has been done to introduce transparency in public administration.23
In Chap. 6, we show that this type of corruption is connected to public debt and the
fiscal crisis facing many developed countries.
In rich countries with stronger checks on corruption, the main problem is rent
seeking, a topic we address in Chap. 3. Rent seeking diverts funds that could be
used for investment toward transfer payments and government consumption. Rent
seeking can also cause the funds that are budgeted for investment to be
misallocated, as political considerations dominate economic ones. In the U.S., for
example, when politicians gain positions on the committees charged with allocating
investment budgets, the funds tend to be used in the politician’s home districts or in
areas where the politicians personally own businesses and land.24 In Japan, standard
corruption measures fail to capture deeply institutionalized legal political corruption. The legal corruption involves building infrastructure of questionable utility to
support quasi-public corporations that generate lucrative salaries and benefits for
public officials.25
When one takes the time to look around, it is easy to see that rent seeking and
legal corruption are pervasive parts of modern societies. Consider public high
schools and universities. The public officials and teachers that run these institutions
should have the interest of all young people in mind. However, they have a vested
interest in protecting a status quo that, as we mentioned earlier, is clearly not
working for the majority of students in many countries. The educated elite benefit
from the current system and are reluctant to even consider reallocating society’s
human capital investment funds toward preschool or vocational training despite
evidence that this may raise economic growth and reduce wage inequality.26
Richard Reeves begins his book Dream Hoarders with a revealing account of
President Obama’s attempt to remove tax benefits from the 529 college saving
plan in favor of tax credits that would help the broad middle class. Despite the fact
that the President’s proposal shifts subsidies away from high income households to
ones that benefit households with average incomes and below, it was attacked by
liberal Democrats and quickly withdrawn.
How different is advocating for subsidies to higher education than lobbying for
subsidies to, or deregulation of, the financial industry and large corporations? Both
types of interest groups can claim that the government subsidies would promote
greater capital formation and economic growth. The subsidies in either case would
predominately raise the welfare of high income households.
23
Rueters report, May 9, 2014.
Cost (2015, Chap. 10).
25
Jones (2015).
26
For discussion of the college bias that serves to misallocate human capital investment see
Murray (2008) and Bennett and Wilezol (2013). The potentially high returns for many students
from preschool and vocational training are discussed in Heckman (2013) and Newman and
Winston (2016).
24
8
1.3
1
Introduction
Modeling the Government
Any assessment of government must be guided by some criteria that define “good”
governance. We take a pragmatic approach to this issue based on principles of good
governance that are widely accepted on equity and efficiency grounds.27 The first
three of these principles are commonly cited. The fourth is less so, but we feel it
also reflects a sentiment that most people share and has influenced the laws that
restrain individual behavior in most societies.
1.3.1
Focus on the National Interest
The government should not be a vehicle to redistribute income to public officials or
to a relatively small group of their supporters. Given the inherently selfish nature of
people, especially when placed in positions of power, keeping the focus on the
national interest could be the largest challenge of good governance.
1.3.2
Efficiency of Resource Use
Policies that maximize total output by promoting efficiency of resource use should
be given a priority. The level and allocation of government investment ought to be
productively efficient, directed to projects and locations where the rate of return is
the highest. It also means that policy makers should seek to raise revenue in a way
that minimizes any negative effects on productive activity.
1.3.3
Limit Economic Disparity
There should be a tendency to limit large disparities in consumption and to equalize
opportunities for economic success. This principle can conflict with the attempt to
maximize total output. The efficiency-equity tension should cause policy makers to
focus on equalizing economic outcomes by investing in the productivity of disadvantaged households rather than relying heavily on simply redistributing income.
1.3.4
Value Future Generations
Finally, the temptation to redistribute wealth to current generations from unborn
generations should be limited. This last principle follows straightforwardly from the
notion of fairness, which is bolstered by the intergenerational altruism we feel
27
Besley (2007, pp. 21–25) provides a nice discussion of the issues involved in defining good
governance.
1.3
Modeling the Government
9
toward our children and is evident in laws that prevent children from being legally
responsible for their parents’ financial debt in most societies. Some regard this
principle as a crucial element of a good society.28
The essence of these principles can be represented by a utilitarian social welfare
function. This social welfare function is simply the sum of the utility functions of
individual households.29 Chapter 2 uses the utilitarian social welfare function to
think about what good policies look like in our setting. Chapters 3, 5, and 6 present
positive theories of government that create deviations from good policies.
Our positive theory of government behavior assumes the government officials
that determine economic policy are fundamentally no different than private
households. Their behavior is motivated by a mix of public and private concerns.
They have public concerns because they are members of the society like everyone
else. Their private concerns arise because they are aligned with particular groups or
regions or because they seek political support from those groups. They may also
have opportunities to divert public funds for private use while serving, i.e. they may
have opportunities for corruption. It is the private desire of public officials to favor
certain groups or raise their own income that causes the government to fail to
perform in the national interest.
One approach to understanding government focuses on the role of elections in
disciplining the behavior of self-interested politicians. The idea is that governments
behave better in stronger democracies because only politicians that create policies
serving the national interest will be re-elected. While we believe elections do
provide some discipline to officials’ behavior, the discipline is weak and insufficient to guarantee good behavior of public officials and policies that are in the
national interest.
Our skepticism about elections being an effective disciplining device causes us
not to focus on the selection of public officials or the even precise form of
government. We do not explicitly model voting or the less peaceful struggles to
achieve political positions. We abstract from these details for several reasons. First,
we believe that government performance is largely independent of exactly who
serves—any government official faces the same influence from the more powerful
groups of the society and faces the same temptations to abuse their position once in
office.30 Second, for similar reasons, we believe the exact form of government is
not of first order importance. Powerful groups and individual temptation will play a
28
See, for example, Ferguson (2012, pp. 43–45).
The utilitarian social welfare function is commonly used, but is also subject to criticism.
Arguments in favor of making the interpersonal comparisons of utility, that are needed to make
the social welfare approach logically consistent and pragmatic, can be found in Besley (2007,
pp. 21–25 and Chap. 2), Binmore (2007, Chap. 19), and Stigler and Becker (1977). We view the
utilitarian social welfare function as a simple way of expositing the rationale for the principles of
good governance.
30
See Besley (2007) for an analysis of the situation where particular politicians matter—i.e. of the
situation where there are different types and where who gets selected into office makes a
difference.
29
10
1
Introduction
major role in all types of governments. Third, while voters tend to be rational about
the incentives they are directly presented with, their understanding of the economy
as a whole and what policies are ultimately in their best interest is flawed. Public
officials have access to much more technical expertise than voters on the effects of
different policies. Voters are generally unequipped to make a rational assessment of
policies.31 Finally, trying to include more institutional details has costs. Voting,
heterogeneity in household types, and institutional details associated with different
forms of government, add complexity that makes dynamic general equilibrium
macroeconomic modeling difficult. Our book is an introduction and we purposely
avoid complexity that stems from features we feel are not absolutely essential. We
leave a complete analysis to more advanced treatments. Chapter 8 contains some
suggestions for important extensions and further reading that direct students toward
more detailed discussions of the issues we introduce.
Mulligan et al. (2004) offer some empirical support for our approach. They find
that the composition of policies coming from democracies is not different from
those of nondemocracies. Furthermore, while the overall size of government is
smaller in democracies than in communist regimes, it is not in autocracies more
generally. Instead, government size and policies are determined by economic and
demographic fundamentals. For example, countries with higher per capita income
have larger governments (Wagner’s Law) and a smaller fraction of the budget
devoted to government consumption purchases. A higher percentage of the work
force in agriculture is associated with smaller government and a smaller allocation
of the government budget to social transfers.32 An older population raises the
fraction of the budget devoted to social transfers. In addition to economic and
demographic fundamentals, our model attempts to capture the harder to measure
influence of culture and social norms. We view culture and social norms as
important determinants of good governance and we treat them as endogenous
variables in our model, along-side the economic variables.
The positive theory of government in Chaps. 5 and 6 assumes each public
official manages a public sector investment project. They consider the possibility
of diverting public funds, earmarked to finance investment projects, for their own
private use. In addition, each private household considers hiding income from the
government to avoid taxation. Both illegal activities are potentially costly to the
individual because resources are lost in attempting to conceal the illegal actions.
The stronger are the government’s detection institutions, the more resources are lost
in avoiding detection.
However, the empirical literature indicates tax evasion cannot be explained by
the detection of illegal activity alone, tax payer guilt also plays role. To capture this
result, we assume households experience a loss in utility, “guilt” from violating a
social norm, when evading taxes. Furthermore, as the empirical also suggests, the
31
Caplan (2007, 2009) makes a case against assuming fully rational voters.
For an explanation of the connection between the relative sizes of agriculture and government,
see Das et al. (2015, Chap. 6).
32
1.4
Tax Evasion
11
strength of the guilt associated with tax evasion varies inversely with the average
level of corruption by government officials.33
We assume the same social norm enters the minds of politicians who consider
engaging in corruption. Similar to tax evasion, given the relatively low expected
penalty, it is difficult to explain why there isn’t more corruption. The average
behavior of the government sets a social norm by which all individuals judge
their own illegal actions, both tax evasion and corruption. In this sense, private
households and government officials are the same “type.” Each considers taking
illegal actions when the opportunity presents itself. Each is affected by social norms
when deciding on the extent of their illegal activity.
Our model follows the research focusing on the horizontal transmission of
culture on preferences.34 There are several important examples of the horizontal
transmission of culture in economics. Lindbeck et al. (1999) assume that
individuals receiving a pecuniary gain from welfare programs also experience a
disutility from living on public transfers rather than their own work. Culture enters
because the disutility or stigma from public transfers is weaker the greater is the
number of individuals in the society who receive government welfare. Fernandez
(2010) assumes that a women’s disutility for work is a function of the mean
disutility for work by women in the society. In this way a women’s preference for
work is affected by the labor force participation rate of women in the economy as a
whole. Butler et al. (2012) argue that standard pecuniary preferences need to be
augmented with a moral cost function. Based on experimental evidence, they
propose a moral cost function that is a decreasing function of the deviation of an
individual’s behavior from what society expects from him.
Similar to the approach of these authors, we assume there is a disutility
associated with illegal behavior. Horizontal cultural transmission enters our
model because we further assume that the average amount of corruption in society
influences the individual’s disutility associated with their own illegal behavior.
1.4
Tax Evasion
Tax evasion receives a good deal of attention in some of the models. We provide
some additional background material on the topic here. As mentioned, tax evasion
is an illegal activity that has close ties to government corruption. One immediately
thinks of the petty corruption associated with bribes to tax collectors made by
households and businesses to avoid paying taxes. However, tax evasion is also
connected to corruption in other ways.
Azariadis and Ioannides (2015) attempt to explain why corruption and tax
evasion are currently so widespread in Greece. A key factor in their explanation
is the social norm of corruption—“an individual’s perception that others engage in
33
34
Lambsdorff et al. (2005, p. 3).
Cavalli-Sforza and Feldman (1981).
12
1
Introduction
corrupt practices may provide an incentive for him or her to also do so (p. 7).” The
suggestion is that tax evasion is justified by government corruption. We agree that
corruption and tax evasion are connected, at least in part, because of the cultural
dimension stressed by Azariadis and Ioannides.
In the previous section we indicated that there is growing evidence about how
culture alters individual attitudes and economic behavior.35 In particular, it is well
known that the standard neoclassical approach to explaining tax evasion is incomplete: the predicted levels of tax evasion are too high and the responsiveness of tax
evasion to the expected penalty is too weak to explain observed behavior.36 In
addition to the deterrent from legal penalties, the personal guilt associated with the
violation of social norms plays a significant role in limiting tax evasion. Furthermore, the strength of the social norm in creating the personal guilt depends on
perceptions of the government’s performance. Uslander (2005, p. 87), similar to
Azariadis and Ioannides, argues that there is a causal connection between corruption and tax evasion—“Countries with high levels of corruption also have higher
levels of theft and tax evasion. People see corrupt regimes and believe it is
acceptable to steal and especially to withhold their taxes.”
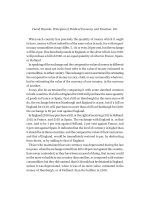
A culture of corruption effect is consistent with the evidence provided in
Figs. 1.1 and 1.2. The figures are based on data from the World Values Survey
(1980–2007). The survey asks households questions about their views on government performance and tax evasion. The public perception of government performance and the presence of corruption is plotted on the horizontal axis and public
willingness to engage in tax evasion is plotted on the vertical axis. In both cases
there is a positive and statistically significant correlation between the public’s
concerns about their government and the public’s willingness to evade taxes. The
correlations exhibited in Figs. 1.1 and 1.2 are consistent with studies that find a
positive correlation between actual evasion and more objective measures of corruption based on expert opinion from outside the country being studied.37
The cultural effects of corruption are not limited to tax evasion alone. There is
also evidence that the average level of government corruption in an economy
affects the willingness of individual government officials to engage in corruption.
Experimental evidence shows that guilt affects corrupt behavior and that guilt may
be influenced by cultural factors.38 Perhaps even more convincing is the now
famous natural experiment identified by Fisman and Miguel (2007, 2008 (Ch. 4)).
They find that the corrupt behavior of government officials during their visits to the
U.S. is highly correlated with the level of corruption in their home country. Their
35
Guiso et al. (2006) and Fernandez (2010).
Fischer et al. (1992), Erard and Feinstein (1994), Andreoni et al. (1998), King and Sheffrin
(2002), Orviska and Hudson (2002), Slemrod (2003), and Schneider and Klinglmair (2004).
37
Johnson et al. (1999, Figs. 6–9), Uslaner (2005, Table 5.3), Alm and Torgler (2006), and Buehn
and Schneider (2009, Fig. 1.2).
38
Schulze and Frank (2003), Barr and Serra (2010), and Robert and Arnad (2013).
36