OECD economic surveys lithuania 2018
Bạn đang xem bản rút gọn của tài liệu. Xem và tải ngay bản đầy đủ của tài liệu tại đây (3.93 MB, 154 trang )
OECD Economic Surveys
LITHUANIA
JULY 2018
OECD Economic Surveys:
Lithuania
2018
This document, as well as any data and any map included herein, are without prejudice
to the status of or sovereignty over any territory, to the delimitation of international
frontiers and boundaries and to the name of any territory, city or area.
Please cite this publication as:
OECD (2018), OECD Economic Surveys: Lithuania 2018, OECD Publishing, Paris.
/>
ISBN 978-92-64-30219-8 (print)
ISBN 978-92-64-30220-4 (PDF)
Series: OECD Economic Surveys
ISSN 0376-6438 (print)
ISSN 1609-7513 (online)
The statistical data for Israel are supplied by and under the responsibility of the relevant Israeli authorities. The use
of such data by the OECD is without prejudice to the status of the Golan Heights, East Jerusalem and Israeli
settlements in the West Bank under the terms of international law.
Photo credits: Cover © iStockphoto.com/Krivinis.
Corrigenda to OECD publications may be found on line at: www.oecd.org/about/publishing/corrigenda.htm.
© OECD 2018
You can copy, download or print OECD content for your own use, and you can include excerpts from OECD publications, databases and
multimedia products in your own documents, presentations, blogs, websites and teaching materials, provided that suitable
acknowledgment of the source and copyright owner(s) is given. All requests for public or commercial use and translation rights should be
submitted to Requests for permission to photocopy portions of this material for public or commercial use shall be
addressed directly to the Copyright Clearance Center (CCC) at or the Centre francais d’exploitation du droit de copie
(CFC) at
TABLE OF CONTENTS
│3
Table of contents
Executive Summary .............................................................................................................................. 9
Assessment and recommendations ..................................................................................................... 13
The economic situation is favourable ................................................................................................ 20
Maintaining financial stability ........................................................................................................... 28
Fiscal policy for inclusive growth...................................................................................................... 33
Greening the economy ....................................................................................................................... 37
Promoting productivity and inclusive growth .................................................................................... 40
Ageing together.................................................................................................................................. 54
References.......................................................................................................................................... 61
Annex. Progress in structural reforms ............................................................................................... 64
Thematic chapters ............................................................................................................................... 67
Chapter 1. Boosting productivity and inclusiveness......................................................................... 69
Convergence can be more sustainable and inclusive ......................................................................... 71
A coordinated policy response is needed to increase productivity and foster inclusiveness ............. 81
Helping firms to become more productive and support inclusive growth ......................................... 82
Helping individuals to meet their productive potential ...................................................................... 99
References........................................................................................................................................ 117
Annex 1.A. Labour productivity growth: shift share analysis ......................................................... 120
Chapter 2. Ageing together ............................................................................................................... 123
Pensions ........................................................................................................................................... 125
Health care ....................................................................................................................................... 131
Life-long learning and labour market .............................................................................................. 137
Emigration and immigration ............................................................................................................ 140
Family policy ................................................................................................................................... 143
An ageing society also offers opportunities ..................................................................................... 146
References........................................................................................................................................ 148
Tables
Table 1. Potential impact of structural reforms on GDP per capita after 10 years ................................ 19
Table 2. Type of reforms used in the simulations ................................................................................. 19
Table 3. Macroeconomic indicators and projections ............................................................................. 20
Table 4. Possible extreme shocks to the Lithuanian economy .............................................................. 28
Table 5. Lithuania’s spending and revenue mix, 2016 .......................................................................... 36
Table 6. Estimated fiscal impact of some OECD recommendations..................................................... 38
OECD ECONOMIC SURVEYS: LITHUANIA 2018 © OECD 2018
4 │ TABLE OF CONTENTS
Figures
Figure 1. Lithuania is growing faster than most OECD countries ........................................................ 15
Figure 2. Well-being could be considerably improved ......................................................................... 15
Figure 3. Inequality and poverty rates are high ..................................................................................... 16
Figure 4. Strictness of employment protection legislation .................................................................... 18
Figure 5. Economic indicators ............................................................................................................... 21
Figure 6. Investment rates remain low .................................................................................................. 22
Figure 7. Labour market and wage developments ................................................................................. 23
Figure 8. External positions appear sustainable .................................................................................... 25
Figure 9. Export diversification indicators ............................................................................................ 26
Figure 10. Lithuania is an open economy but low-medium technology exports dominate ................... 27
Figure 11. Credit and housing development .......................................................................................... 30
Figure 12. Soundness indicators ............................................................................................................ 31
Figure 13. Fiscal policy is relatively sound ........................................................................................... 33
Figure 14. The debt sustainability path under different structural deficit assumptions......................... 35
Figure 15. The spending mix favours inclusive growth ........................................................................ 35
Figure 16. Recurrent taxes on immovable property are low ................................................................. 37
Figure 17. Green growth indicators ....................................................................................................... 39
Figure 18. GDP per capita convergence according to different scenarios ............................................ 40
Figure 19. Product market regulations, 2013 ........................................................................................ 41
Figure 20. Service Trade Restrictiveness Index, 2017 .......................................................................... 42
Figure 21. A large informal economy ................................................................................................... 43
Figure 22. Insolvency framework needs to be improved ...................................................................... 44
Figure 23. Innovation and digitalisation indicators ............................................................................... 46
Figure 24. Skill mismatch is high .......................................................................................................... 47
Figure 25. Finding the right skills is an obstacle to firms ..................................................................... 47
Figure 26. The labour market could become more inclusive ................................................................ 48
Figure 27. Wage inequality is high........................................................................................................ 48
Figure 28. A high tax wedge ................................................................................................................. 49
Figure 29. Unemployment benefits became more generous ................................................................. 50
Figure 30. Child income poverty rates are high, especially in jobless households ............................... 51
Figure 31. Financial incentives to take up a job are weaker for large households ................................ 52
Figure 32. Expenditure on activation policies ....................................................................................... 53
Figure 33. Old-age dependency ratio, 2010 and 2060 ........................................................................... 54
Figure 34. Replacement rate is average ................................................................................................. 55
Figure 35. The recent reform is set to increase sustainability of the pension system ............................ 55
Figure 36. Old-age poverty is high ........................................................................................................ 56
Figure 37. Life expectancy of men is low ............................................................................................. 57
Figure 38. Lithuania’s health care system has undergone deep reforms but is still hospital-centred.... 57
Figure 39. Life-long-learning propensity in Lithuania is low ............................................................... 58
Figure 40. Emigration is high and volatile ............................................................................................ 59
Figure 41. Both birth rates and female employment are above OECD averages .................................. 60
Figure 1.1. The convergence process needs to be strengthened ............................................................ 70
Figure 1.2. Low labour productivity explains most of the gap in incomes ........................................... 72
Figure 1.3. Total factor productivity and capital deepening weakened ................................................. 72
Figure 1.4. Productivity and labour shares trends by sector .................................................................. 73
Figure 1.5. Participation in global value chains can be deepened ......................................................... 74
Figure 1.6. Income inequality is high .................................................................................................... 75
Figure 1.7. Wage inequality is high....................................................................................................... 76
OECD ECONOMIC SURVEYS: LITHUANIA 2018 © OECD 2018
TABLE OF CONTENTS
│5
Figure 1.8. The tax and transfers system could be more effective in reducing inequality .................... 76
Figure 1.9. Poverty rates remain large................................................................................................... 77
Figure 1.10. Labour market inclusiveness can improve ........................................................................ 78
Figure 1.11. Undeclared activities remain widespread.......................................................................... 79
Figure 1.12. Earnings are low and low-pay widespread........................................................................ 80
Figure 1.13. Lithuanian employees perceive their career prospects to be weak, 2015 ......................... 81
Figure 1.14. Income inequality is positively correlated with productivity disparities across sectors ... 82
Figure 1.15. Product market regulations, 2013 ..................................................................................... 83
Figure 1.16. Service Trade Restrictiveness Index, 2017 ....................................................................... 84
Figure 1.17. SOEs performance varies across sectors ........................................................................... 87
Figure 1.18. Firm dynamics can be improved ....................................................................................... 88
Figure 1.19. Access to finance for businesses ....................................................................................... 89
Figure 1.20. The insolvency framework can become more efficient .................................................... 91
Figure 1.21. There is scope to catch up with more innovative countries .............................................. 92
Figure 1.22. Firm level innovation and absorptive capacity are low..................................................... 93
Figure 1.23. Business innovation is low despite generous tax incentives ............................................. 94
Figure 1.24. Indicators of digitalisation ................................................................................................ 96
Figure 1.25. There is scope to increase collaborative research ............................................................. 97
Figure 1.26. Infrastructure quality in international comparison ............................................................ 98
Figure 1.27. Labour resources could be allocated more efficiently .................................................... 100
Figure 1.28. Lithuania has a highly educated workforce but the skill mix needs to improve ............. 101
Figure 1.29. The enrolment rates in VET are low ............................................................................... 102
Figure 1.30. There is need to strengthen basic skills for the digital working environment ................. 103
Figure 1.31. Employment protection legislation was eased ................................................................ 104
Figure 1.32. Distribution of enterprises by size................................................................................... 106
Figure 1.33. The tax wedge is high ..................................................................................................... 107
Figure 1.34. Unemployment benefits became more generous ............................................................ 108
Figure 1.35. Receipt of social benefits increased but support remains weak ...................................... 109
Figure 1.36. Child income poverty rates are high, especially in jobless households .......................... 110
Figure 1.37. Financial incentives to take up a job are weaker for large households ........................... 113
Figure 1.38. Expenditure on active labour market programmes ......................................................... 115
Figure 1.A.1. Shift-share analysis of labour productivity ................................................................... 121
Figure 2.1. Lithuania is ageing rapidly ................................................................................................ 124
Figure 2.2. Pension spending is relatively low, despite high contribution rates ................................. 127
Figure 2.3. The recent reform is expected to increase sustainability of the pension system ............... 127
Figure 2.4. The Lithuanian pension system is very distributive .......................................................... 129
Figure 2.5. Old-age poverty is high ..................................................................................................... 129
Figure 2.6. Funded pensions are gradually replacing the pay-as-you-go system ................................ 130
Figure 2.7. Life expectancy is low and the gender gap large .............................................................. 132
Figure 2.8. Lithuania spends little on health ....................................................................................... 133
Figure 2.9. Access to health care for all income groups is good ......................................................... 134
Figure 2.10. The health care system has undergone deep reforms but is still hospital-centred........... 136
Figure 2.11. Life-long learning in Lithuania is not well developed .................................................... 139
Figure 2.12. Economic factors are driving migration .......................................................................... 141
Figure 2.13. Remittances are declining ............................................................................................... 142
Figure 2.14. Both birth rates and female employment are above OECD averages ............................. 146
OECD ECONOMIC SURVEYS: LITHUANIA 2018 © OECD 2018
6 │ TABLE OF CONTENTS
Boxes
Box 1. The New Social Model: a wide reaching structural reform ....................................................... 17
Box 2. Illustrative simulations of the potential impact of structural reforms ........................................ 19
Box 3. Prudential regulations in Lithuania ............................................................................................ 32
Box 4. The long-term fiscal effects of some key OECD recommendations ......................................... 38
Box 1.1. Reforms in employment procedures for foreign workers: main provisions ........................... 86
Box 1.2. Social assistance and in-work benefits schemes: main features ........................................... 111
Box 1.3. Recommendations on raising productivity for inclusive growth .......................................... 116
Box 2.1. Main features of the Lithuanian old age security system...................................................... 126
Box 2.2. Main characteristics of the health care financial system....................................................... 134
Box 2.3. Lithuania’s population is declining while employment is increasing ................................... 138
Box 2.4. Policies to attract high skilled workers in neighbouring countries ....................................... 144
Box 2.5. Family policy and its effect on fertility and female labour participation .............................. 145
Box 2.6. Recommendations to address an ageing society ................................................................... 147
OECD ECONOMIC SURVEYS: LITHUANIA 2018 © OECD 2018
This Survey was discussed at a meeting of the Economic and Development Review
Committee on 5 March 2018. The draft was revised in the light of the discussions and
given final approval as the agreed report of the whole Committee on 11 April 2018. The
Survey is published on the responsibility of the Secretary-General of the OECD.
The Secretariat’s draft report was prepared for the Committee by Hansjörg Blöchliger
and Vassiliki Koutsogeorgopoulou under the supervision of Piritta Sorsa. Analytical and
statistical research was provided by Demetrio Guzzardi and Hermes Morgavi and
editorial assistance was provided by Carolina González.
The previous Survey of Lithuania was issued in March 2016.
OECD ECONOMIC SURVEYS: LITHUANIA 2018 © OECD 2018
Basic Statistics of Lithuania, 2017
LAND, PEOPLE AND ELECTORAL CYCLE
3.1
45.5
(37.2)
Population density per km²
14.5
(17.9) Life expectancy (years, 2015)
74.5
(80.5)
17.3
(17.0)
Men
69.2
(74.5)
0.6
Women
79.7
(79.8)
-0.6
(0.6) Latest general election
October
ECONOMY
Gross domestic product (GDP)
Value added shares (%)
In current prices (billion USD)
47.2
Primary sector
1.7
(2.5)
In current prices (billion EUR)
41.9
Industry including construction
37.2
(26.9)
Latest 5-year average real growth (%)
3.0
(2.1)
Services
67.1
(70.6)
Per capita (000 USD PPP)
32.1
(43.8)
GENERAL GOVERNMENT
Per cent of GDP
Expenditure
33.3
(0.0) Gross financial debt
48.0
(0.0)
33.8
(39.3) Net financial debt
17.8
(0.0)
Revenue
EXTERNAL ACCOUNTS
0.885
Exchange rate (EUR per USD)
Main exports (% of total merchandise exports)
0.482
Wholesale and retail trade; repair of motor
41.2
PPP exchange rate (USA = 1)
vehicles and motorcycles
Manufacture of chemicals and chemical
9.8
In per cent of GDP
products
81.3
(55.7)
9.1
Exports of goods and services
Manufacture of food products
79.3
(51.3) Main imports (% of total merchandise imports)
Imports of goods and services
0.4
(0.4)
Wholesale and retail trade; repair of motor
54.1
Current account balance
vehicles and motorcycles
-37.8
Manufacture of coke and refined petroleum
33.4
Net international investment position
products
Manufacture of chemicals and chemical
8.3
products
LABOUR MARKET, SKILLS AND INNOVATION
Employment rate for 15-64 year-olds (%, 2016)
69.4
(67.0) Unemployment rate, Labour Force Survey (age
7.9
(6.3)
15 and over) (%, 2016)
Men
70.0
(74.8)
Youth (age 15-24, %)
14.5
(13.0)
Women
68.8
(59.4)
Long-term unemployed (1 year and over, %)
3.0
(2.0)
Participation rate for 15-64 year-olds (%, 2016)
75.5
(71.7) Tertiary educational attainment 25-64 year-olds
39.7
(35.7)
(%)
1 885
(1 763) Gross domestic expenditure on R&D (% of GDP,
Average hours worked per year (2016)
1.0
(2.4)
2015)
ENVIRONMENT
Total primary energy supply per capita (toe, 2014)
2.2
(4.2) CO2 emissions from fuel combustion per capita
3.3
(9.2)
(tonnes, 2015)
Renewables (%, 2014)
(9.4) Water abstractions per capita (1 000 m3, 2015)
0.1
Exposure to air pollution (more than 10 g/m3 of PM2.5, % of
94.6
(75.2) Municipal waste per capita (tonnes, 2015)
0.4
(0.5)
population, 2015)
SOCIETY
Income inequality (Gini coefficient, 2015)
0.372
(0.313) Education outcomes (PISA score, 2015)
Relative poverty rate (%, 2015)
16.5
(11.2)
Reading
472
(493)
Median disposable household income (000 USD PPP, 2015)
12.7
(22.3)
Mathematics
478
(490)
Public and private spending (% of GDP)
Science
475
(493)
Health care (2016)
6.5
(8.7) Share of women in parliament (%)
21.3
(28.7)
Pensions (2015)
6.9
(9.1) Net official development assistance (% of GNI,
0.14
(0.38)
2016)
Education (primary, secondary, post sec. non tertiary, 2014)
2.6
(3.7)
Note: Where the OECD aggregate is not provided in the source database, a simple OECD average of latest available data is calculated where
data exist for at least 29 member countries.
Source: Calculations based on data extracted from the databases of the following organisations: OECD, International Energy Agency, World
Bank, International Monetary Fund and Inter-Parliamentary Union.
Population (million)
Under 15 (%)
Over 65 (%)
Foreign-born (%, 2016)
Latest 5-year average growth (%)
OECD ECONOMIC SURVEYS: LITHUANIA 2018 © OECD 2018
EXECUTIVE SUMMARY
Executive Summary
GDP continues to converge
Boosting productivity and inclusiveness
Addressing an ageing society
OECD ECONOMIC SURVEYS: LITHUANIA 2018 © OECD 2018
│9
10 │ EXECUTIVE SUMMARY
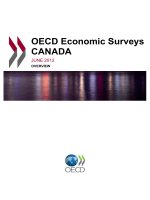
GDP continues to converge
GDP per capita
2010 USD
PPP
45 000
Lithuania
40 000
OECD
35 000
30 000
25 000
20 000
15 000
10 000
0
2000
2001
2002
2003
2004
2005
2006
2007
2008
2009
2010
2011
2012
2013
2014
2015
2016
2017
5 000
Source: OECD Economic Outlook database.
StatLink 2 />
Since renewed independence in 1991 and transition from a
centrally planned to a market economy, Lithuania has
substantially raised well-being of its citizens. Thanks to a
market-friendly environment the country grew faster than most
OECD countries over the past ten years. The financial system is
resilient, and fiscal positions stabilised after a long period of
deficits and rising debt. Yet productivity has remained subdued
due to stringent labour market regulations, informality and skills
mismatch. Wage and income inequality are high, fuelling
emigration. The population is ageing fast and declining,
particularly because of emigration, putting pressure on the
pension system. A wide-reaching labour market, unemployment
benefits and pension reform entitled “New Social Model”
implemented in 2017 is expected to reinvigorate inclusive
growth and underpin the sustainability of public finances.
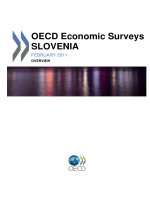
Boosting productivity and inclusiveness
The productivity gap¹ remains large
%
0
-10
-20
-30
2017
2016
2015
2014
2013
2012
2011
2010
2009
2008
2007
2006
2005
-50
2004
-40
Catch-up and more inclusive growth will require raising
productivity that still remains well below the OECD average,
and has slowed down in recent years. In addition to the New
Social Model, this calls for further easing regulations on the
employment of non-EU workers, financial constraints for
productive firms, and reducing informality. Moreover,
continuing governance reforms would enhance the performance
of state-owned enterprises. Recent reforms, such as more relaxed
regulations for high skilled non-EU workers and a modernisation
of labour relations are welcome. Greater inclusiveness also
requires a better tailoring of education to labour market needs
and more effective help for those out of work to find a good job.
1. Labour productivity gap with respect to the OECD average.
Source: OECD Economic Outlook database.
StatLink 2 />
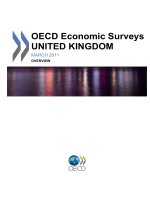
Addressing an ageing society
Lithuania is ageing rapidly
Rapid ageing and high emigration shrink the labour force by 1%
every year, requiring a comprehensive approach to address the
economic consequences. The pension part of the “New Social
Model” strengthened the sustainability of the pension system,
but did little to reduce old-age poverty. Health care is improving
well-being of the elderly, but outpatient and long-term care
remain hospital-oriented. The need to upgrade skills, especially
of older workers, calls for a broad-based life-long-learning
system. Better access to childcare would allow families to have
more children and improve labour market opportunities for
working parents. Migration policy, including a focused outreach
to emigrants and a less restrictive approach to immigration,
could help slow down the labour force decline.
Old age dependency ratio
projections, 2010 - 2040
% population 65+ on population 15-64
50
45
40
35
30
25
20
Lithuania
15
EU
OECD
10
5
0
2010
2015
2020
2025
2030
2035
2040
Source: United Nations, Department of Economic and Social
Affairs, Population Division (2015). World Population
Prospects.
StatLink 2 />
OECD ECONOMIC SURVEYS: LITHUANIA 2018 © OECD 2018
EXECUTIVE SUMMARY
│ 11
MAIN FINDINGS
KEY RECOMMENDATIONS
Fiscal And Financial Policies To Support Inclusive Growth
High taxation of labour and of low-incomes reduce labour Reduce social security contributions, especially for
supply and contribute to informality.
low-income workers, while ensuring that benefits and deficit
targets are maintained.
Increase immovable property taxation, while exempting
low-income households
The public spending mix fosters inclusive growth, but Assess spending efficiency by carrying out regular spending
spending efficiency is weak, especially in education and reviews.
health care.
Debt is stabilising but the fiscal framework allows for some Set a debt target and establish a credible frontloaded path to
fiscal slippage.
reach it.
Low interest rates and growing credit fuel housing market Actively use macroprudential measures once imbalances
activity and prices.
threaten to emerge.
Promoting productivity and inclusiveness
The business environment is good but foreign investment Strengthen the monitoring capacity of the Governance
remains low, state-owned enterprises dominate many sectors Coordination Centre, building on the recent increase in its
and governance could be improved; firms face barriers to budget.
finance while weak insolvency procedures hold back Simplify bankruptcy procedures and establish more
business dynamism.
favourable conditions for restructuring.
Innovation remains weak and collaboration between Continue the implementation of the institutional reform of
business and research sectors is limited.
innovation policy by improving coordination, and consolidate
agencies and support programmes where overlaps exist.
Give more weight on collaborative research when allocating
funds to public research institutions.
Skill mismatch remain high, weighing on foreign investment, Strengthen work-based learning, including by linking the
productivity and inclusiveness.
length of apprenticeships to the level of acquired
The low efficiency of the education system contributes to skill competencies.
mismatch
Provide differentiated awards for tertiary courses with skills
closely linked to labour market needs.
Continue with overall reform of the education system at all
levels, addressing skill mismatch.
Further increase the level of social assistance, while ensuring
Protection for the most vulnerable is low
strong work incentives.
Increase investment in active labour market programmes
upon a close monitoring of their outcomes.
Addressing an ageing society
The pension system is highly redistributive but not targeted at Continue the shift of pensions from the pay-as-you-go
the poor. Social security contributions put a high tax wedge system (“first pillar”) towards pension funds (”second pillar”),
on labour contributing to informality.
and make payments to pension funds compulsory.
Fund the wage-independent basic pensions through the
general government budget rather than social security
contributions.
The health care system remains hospital-care centred, while Continue reorganising the hospital sector; and improve
outpatient and long-term care for the elderly lags behind.
outpatient- and long-term care.
Life-long learning is modest. Older workers in particular do Provide financial incentives for life-long learning, involving
not take part in adult education.
both firms and employees.
The workload for working mothers is high.
Extend and improve support for childcare.
Emigration is still high and immigration restricted, contributing Implement a well-integrated migration policy, including a
to population decline and skills shortages.
focused outreach to emigrants and a less restrictive
approach to immigration.
OECD ECONOMIC SURVEYS: LITHUANIA 2018 © OECD 2018
ASSESSMENT AND RECOMMENDATIONS
Assessment and recommendations
The economic situation is favourable
Maintaining financial stability
Fiscal policy for inclusive growth
Greening the economy
Promoting productivity and inclusive growth
Ageing together
OECD ECONOMIC SURVEYS: LITHUANIA 2018 © OECD 2018
│ 13
14 │ ASSESSMENT AND RECOMMENDATIONS
Lithuania, a country with less than three million people, has been successful in the
transition from a centrally planned to a market economy since it renewed independence in
1991. The political and economic environment is overall democratic and market-friendly.
Per-capita income growth over the last 25 years was above most OECD countries and
exceeded other economies in the region, facilitating convergence towards OECD average
incomes (Figure 1). Lithuania is closely integrated in the international community as it
joined the World Trade Organization in 2001, the European Union in 2004 and the euro
area in 2015. The country’s fiscal position is sound, after a protracted period of deficits
and rising debt. Since 2000 living standards increased rapidly, dented only by the global
financial crisis of 2009 when especially foreign investment stopped abruptly and
unemployment reached almost 18%, and in 2014 when exports were hit by the recession
in Russia and a slowdown in other major trading partners.
Despite strong economic performance and bold reforms over the last 25 years, Lithuania
faces several challenges going forward. Labour productivity is still at around two-thirds
of OECD average, partially influenced by labour informality and skills mismatch
(Figure 1). Wage inequality is high and job quality often unsatisfactory. High social
security contributions and, until recently, stringent labour market regulation weigh on
labour market opportunities, exacerbating inequality and diminishing tax revenues, and
contribute to informality. Despite low barriers, foreign investment remains subdued.
Demography is of particular concern. Lithuania’s population is ageing fast and declining,
particularly because of emigration of the young. The labour force continues to shrink by
around 1% every year. Immigration of talent is held back by stringent regulation and the
lack of attractive job opportunities.
Lithuania can be praised for having profoundly raised wellbeing of its citizens in the past,
yet some areas remain below OECD levels and more could be done (Figure 2). The
quality of housing is rapidly increasing as investment in residential housing is sustained,
but many dwellings are still too small and poorly equipped. Health outcomes are
improving thanks to a health care system which is becoming ever more efficient and more
accessible, yet some health indicators such as low life expectancy suggest potential for
improvement in the population’s health status. Surveys and polls indicate that many
Lithuanians are unhappy with the social and psychological climate in the country,
pointing at a lack of community spirit. Finally, environmental quality is good in this
country, which is rich in natural beauty, except that water quality is low in some lakes
and rivers.
Income inequality and poverty are relatively high, especially among older Lithuanians
and those living in rural areas. Household income inequality is higher than in most OECD
countries, driven by unequal earnings, low social benefits and a tax system which is not
very redistributive (Figure 3). The number of low-skilled and vulnerable workers is above
OECD average. Around 17% of the population lives in relative poverty with an income
below 50% of the median. Women, the youngest and the elderly are particularly affected.
As with other countries, the risk of poverty in Lithuania tends to fall with the level of
education, as those not having completed secondary education are facing a high risk.
Regional disparities in income and unemployment remain considerable (Statistics
Lithuania, 2016).
OECD ECONOMIC SURVEYS: LITHUANIA 2018 © OECD 2018
ASSESSMENT AND RECOMMENDATIONS
Figure 1. Lithuania is growing faster than most OECD countries
A. Real GDP per capita
Average annual growth 200617
5
4
3
2
1
0
Turkey
Lithuania
Poland
Latvia
Slovak Republic
Chile
Korea
Estonia
Israel
Czech Republic
Hungary
Iceland
Germany
Slovenia
New Zealand
Mexico
Sweden
OECD
Australia
Netherlands
Japan
Austria
United States
Canada
Switzerland
Belgium
United Kingdom
France
Luxembourg
Spain
Denmark
Italy
Finland
-2
Greece
-1
B. Labour productivity is low, 2017
USD PPP per worker
180 000
160 000
140 000
120 000
100 000
60 000
40 000
20 000
0
Mexico
Chile
Latvia
Hungary
Estonia
Lithuania
Portugal
Poland
Greece
Czach Rep.
Slovenia
New Zealand
Israel
Slovak Rep.
Turkey
Korea
Japan
OECD
Spain
Uniter Kingdom
Iceland
Germany
Italy
Finalnd
Canada
Austria
Australia
Netherland
Denmark
France
Sweden
Switzerland
Belgium
United States
Norway
Luxembourg
Ireland
80 000
Source: OECD Economic Outlook database.
StatLink 2 />
Figure 2. Well-being could be considerably improved
OECD
Lithuania
Housing
8
Safety
6
Lowest OECD¹
Income and jobs
4
2
Life Satisfaction
0
Health
Community
Education
Environment
1. Lowest OECD refer to the 17 countries with the lowest score among the OECD countries. Data are for
2016 or latest available year.
Source: OECD Better life index indicators database; Eurostat; Gallup database; and World Bank World
Development Indicators.
StatLink 2 />
OECD ECONOMIC SURVEYS: LITHUANIA 2018 © OECD 2018
│ 15
16 │ ASSESSMENT AND RECOMMENDATIONS
Figure 3. Inequality and poverty rates are high
50
45
40
35
30
25
20
15
10
5
0
Iceland
Slovenia
Slovak Rep.
Denmark
Czech Rep.
Finland
Belgium
Norway
Austria
Sweden
Luxembourg
Hungary
Germany
Poland
France
Korea
Switzerland
Ireland
Netherlands
OECD
Canada
Italy
Estonia
Japan
Portugal
Australia
Greece
Spain
Latvia
New Zealand
Israel
United…
Lithuania
United States
Turkey
Chile
Mexico
A. Gini index
2015 or latest year vailable
B. Relative poverty rate
2015 or latest year vailable
%
25
20
15
10
0
Denmark
Finland
Czech Rep.
Iceland
Netherlands
France
Luxembourg
Norway
Slovak Rep.
Austria
Ireland
Slovenia
Sweden
Germany
Belgium
Switzerland
Hungary
New Zealand
United…
Poland
OECD
Portugal
Australia
Italy
Korea
Canada
Greece
Spain
Chile
Estonia
Japan
Latvia
Lithuania
Mexico
United States
Turkey
Israel
5
Note: The two indicators are calculated in disposable income after taxes and transfers.
Source: OECD Income Distribution and Poverty database.
StatLink 2 />
The government has acknowledged these challenges and has initiated deep-reaching and
comprehensive reforms to make growth more inclusive. These reforms, which entered
into force in 2017 under the umbrella “new social model”, bring a growth-enhancing
labour market reform together with stronger social protection and more sustainable public
finances (Box 1 and Figure 4).
OECD ECONOMIC SURVEYS: LITHUANIA 2018 © OECD 2018
ASSESSMENT AND RECOMMENDATIONS
Box 1. The New Social Model: a wide reaching structural reform
Reform efforts over the past years focused on the New Social Model, an encompassing
reform of labour relations, unemployment insurance and pensions based on flexicurity.
The reform entered into force in three stages in 2017 and 2018. The reform relaxed
labour market regulations, increased unemployment benefits, strengthened active labour
market policies, and put the pension system on a more sustainable path (Figure 4). In
detail, the reform involved the following changes:
Labour Code
Permanent employment contracts were eased by relaxing the rules on individual
dismissal for employees with a permanent contract and reducing the notice period
and severance pay for these employees. A central fund, out of social security
contributions, will provide supplementary severance pay for workers with long
tenure (five years or more).
Temporary employment was also eased. As a safeguard, fixed-term contracts do
not account for more than 20% of all employment contracts for a given employer.
Moreover, the variety of contracts was increased, including for apprenticeships.
Working-time arrangements also became much less regulated, including through
the possibility of working-time averaging over a three-month period.
Strengthening collective agreements through changes in collective representation.
Work councils must be formed in all firms with 20 or more employees, apart from
the cases where more than a third of employees belong to trade union. Moreover,
the competencies of the trade unions and work councils at the company level are
divided, with work councils having responsibility for all information and
consultation activity and trade unions for representation and collective
bargaining.
Clarifying the procedure for minimum wage determination, strengthening the
transparency of the payment system, applying the minimum wage for nonqualified employees.
Lifelong learning is promoted by allowing employees to take up training for up to
five partially paid days per year to attend non-formal adult education
programmes.
The work–life balance is improved by offering parents more possibilities for part-time
and remote working, flexible working schedules and individual working time
arrangements. The new law introduces specific exemptions for small firms (up to 10
employees). Small-size firms are exempted from the obligation to approve the selection
criteria for redundancy and to form a selection committee when dismissing employees on
the ground on the initiative of employer, or to provide information to their employees
regarding the company’s situation in terms of fixed-term contracts and temporary work.
In addition, these firms are not obliged to provide a payment of study leave for
employees participating in non-formal training, but rather this payment is based on an
agreement between the employer and the employee.
Pensions
Social security contributions for the first pillar pension system were reduced by
one percentage point.
Pensions not linked to former wage levels(“basic pensions”) will be gradually
OECD ECONOMIC SURVEYS: LITHUANIA 2018 © OECD 2018
│ 17
18 │ ASSESSMENT AND RECOMMENDATIONS
moved from the pension fund to the general government budget.
A first-time pension indexation rule links the growth of individual pensions to the
average growth of the wage sum over 7 years: 3 previous years, current year and
3 coming years (projections made by the Ministry of Finance), replacing the
former defined-benefit system.
A transparent and simple formula (point system) by which contributions translate
into pension rights was introduced.
An increase of the mandatory insurance period for the full basic pension
entitlement from 30 to 35 years will be gradually phased-in.
Taxation
Personal income tax exemptions for low-income households were increased by a factor of
two.
Figure 4. Strictness of employment protection legislation
A. Individual and collective dismissals
Scale from 0 (least restrictions) to 6 (most
restrictions), latest year available¹
4
B. Temporary employment
Scale from 0 (least restrictions) to 6 (most
restrictions), latest year available¹
Collective dismissals
Difficulty of dismissal
Notice and severance pay for no-fault individual dismissal
Procedural inconveniance
3.5
3
2.5
3.5
3
2.5
Fixed-term contracts
Temporary work agency employment
2
2
Lithuania
(pre-reform)
Estonia
Poland
OECD
Latvia
Lithuania
(post-reform)
Latvia
0
Lithuania
(pre-reform)
0
Poland
0.5
OECD
1
0.5
Estonia
1
Lithuania
(post-reform)
1.5
1.5
1. 2013 except 2014 for Slovenia and the United Kingdom and 2015 for Latvia.
Source: OECD (2018), OECD Reviews of Labour Market and Social Policies: Lithuania.
StatLink 2 />
Against this background, this Economic Assessment of Lithuania has two main messages:
Boost productivity and inclusiveness: Labour productivity growth has slowed and
inequality and poverty remain high. Income convergence and high well-being
require that this twin challenge is addressed through a systematic policy approach
that promotes business dynamism, provides individuals with the opportunities and
skills needed to meet their productive potential, and supports the most vulnerable.
Less informality is a win-win for both productivity and inclusiveness.
Address the economic consequences of ageing: Lithuania is ageing fast, and
emigration exacerbates the demographic pressure and contributes to skills
shortages. Addressing the economic consequences of an ageing population
requires a comprehensive approach that embodies several policy areas such as the
pension and health care system, adult education and life-long learning, migration,
and family policy.
According to OECD simulations, structural reforms as discussed in this Survey could
boost new sources of growth substantially (Box 2).
OECD ECONOMIC SURVEYS: LITHUANIA 2018 © OECD 2018
ASSESSMENT AND RECOMMENDATIONS
│ 19
Box 2. Illustrative simulations of the potential impact of structural reforms
Simulations, based on historical relationships between reforms and growth in
OECD countries, allow gauging the impact of structural reforms proposed in this
Survey. The simulations are based on specific examples of reforms in the area of
product and labour market regulation, investment policy, and fiscal policy, and
include the effect of new labour market policies which were implemented in 2017
as part of the “new social model” package (Table 1 and Table 2). The estimates
assume swift and full implementation of the reforms. Results should be taken with
care, and countries are advised to assess growth impacts using methodologies that
reflect the situation in their country.
Table 1. Potential impact of structural reforms on GDP per capita after 10 years
Structural policy
Policy change
2016
After
reform
Total effect on
GDP per
capita
Impact on supply side components
Productivity
Investment
Employment
in percent
Investment specific policies
Increase in R&D expenditure
Fiscal policy
Reduce social security
contributions
Labour market policies
Improve labour market
regulations (regular contracts)
Increase spending on activation
Increase family benefits in kind
0.3%
0.6%
0.4
40%
35%
0.8
2.4
2.1
0.7
5.7%
8.9%
0.3
0.7%
1.0%
0.6
in percent
in pp2
0.4
0.5
0.1
0.2
0.2
0.3
Source: OECD calculations based on Balázs Égert and Peter Gal (2017), "The quantification of
structural reforms in OECD countries: A new framework", OECD Journal: Economic Studies, Vol.
2016/1 and Balázs Égert (2017), “The quantification of structural reforms: taking stock of the results
for OECD and non-OECD countries”, OECD Economics Department Working Papers, forthcoming.
Table 2. Type of reforms used in the simulations
Structural policy
Reduce social security
contributions
Structural policy changes
Investment specific policies
Increase business expenditure in R&D for 0.3% of GDP to 0.6% of GDP, bring it to around half of the
OECD average.
Fiscal policy
Reduce social security contributions, which fund pensions, health care and unemployment benefits, from
40% of gross wages to 35%.
Improve labour market
regulations
Labour market policies
Implement the regulations of the new labour code (individual and collective dismissal, severance pay etc.)
adopted in 2017 as part of the new social model
Increase business spending
in R&D
Increase spending on
activation
Increase family benefits in
kind
Increase expenditure per unemployed as a percentage of GDP per capita from 5.7% to 8.9%..
Increase family benefits in kind, such as childcare support, from 0.7% of GDP to 1%.
OECD ECONOMIC SURVEYS: LITHUANIA 2018 © OECD 2018
20 │ ASSESSMENT AND RECOMMENDATIONS
The economic situation is favourable
Growth has strengthened
Economic activity strengthened in 2017, recovering from a slowdown in 2015 and 2016,
and remains solid into 2018 (Table 3 and Figure 5). Household consumption is supported
by falling unemployment, rapid wage increases and favourable credit conditions. After
last year's impressive performance on the back of broad based external demand recovery,
export growth weakened. Domestic investment rebounded in 2017, largely due to
growing business investment in double digits. Knowledge-based investment growth was
particularly strong. High capacity utilisation continues to spur private investment,
although the investment rate in the business sector is well below its pre-crisis level
(Figure 6). Low business confidence may be part of the explanation but other factors,
including the difficulties faced by firms in finding adequately-skilled workers, and large
informality can also deter investment. As a catching up economy Lithuania needs more
investment to boost productivity and close the income gap. Inflation has receded in early
2018 as the impact of last year's hikes in some excise duties is abating (Figure 5, Panel
E). Service price inflation remains elevated, however, reflecting strong wage and
domestic demand growth.
Table 3. Macroeconomic indicators and projections
Annual percentage change, volume (2010 prices)
2014
current prices
(EUR million)
Gross domestic product (GDP)
Private consumption
Government consumption
Gross fixed capital formation
Final domestic demand
Stockbuilding¹
Total domestic demand
Exports of goods and services
Imports of goods and services
Net exports¹
Other indicators (growth rates, unless specified)
Potential GDP
Output gap²
Employment
Unemployment rate
GDP deflator
Harmonised consumer price index
Harmonised core consumer price index
Current account balance³
General government financial balance³
Underlying government financial balance²
Underlying government primary financial balance²
General government gross debt³
General government gross debt, Maastricht definition³
36 568
22 777
6 073
6 905
35 756
35 809
29 658
28 898
2015
2016
2017
2018
2019
2.0
4.0
0.2
4.8
3.5
3.8
7.2
-0.4
6.2
-5.2
2.3
4.9
1.3
-0.5
3.3
-0.8
2.3
3.5
3.5
-0.1
3.9
3.8
1.0
7.3
3.9
-0.9
3.1
13.6
12.8
0.8
3.4
3.7
0.9
7.6
3.9
-0.5
3.7
6.9
7.1
-0.1
2.9
3.5
0.8
5.3
3.4
0.0
3.4
4.4
5.1
-0.4
2.6
0.1
1.2
9.1
0.3
-0.7
1.9
-2.9
-0.2
-0.5
1.0
53.8
42.6
2.6
-0.1
2.0
7.9
1.0
0.7
1.7
-1.2
0.3
0.2
1.5
51.7
40.1
2.5
1.3
-0.5
7.1
4.2
3.7
2.6
0.4
0.5
0.1
1.2
48.0
39.7
2.6
2.1
-0.4
6.6
3.1
2.8
2.0
-0.2
0.5
-0.1
0.9
43.1
34.8
2.8
2.2
-0.4
6.2
2.8
2.6
2.5
-0.5
0.5
-0.2
0.7
41.6
33.4
1. Contributions to change in real GDP.
2. As a percentage of potential GDP.
3. As a percentage of GDP.
Source: OECD Economic Outlook 103 database and updates.
StatLink 2 />
OECD ECONOMIC SURVEYS: LITHUANIA 2018 © OECD 2018
ASSESSMENT AND RECOMMENDATIONS
│ 21
Figure 5. Economic indicators
A. Real GDP
Y-o-y %
change
15
B. GDP components
Y-o-y %
change
Lithuania
OECD
Private final consumption expenditure
50
10
5
30
0
10
-5
Private non-residential and government fixed capital
formation
-10
-10
2018
2017
2016
2015
2014
2013
2012
2011
2010
2009
2008
2007
-50
2006
2018
2017
2016
2015
2014
2013
2012
2011
2010
2009
2008
2007
2006
C. Exports of goods and services
D. Export performance¹
Index
2005=100
160
Lithuania
150
Latvia
140
Estonia
130
Poland
120
110
100
E. Consumer price index
2017
2016
2015
2014
2013
2012
7
Lithuania
8
2011
%
8
Euro area
10
2010
F. Interest rates²
Y-o-y %
change
12
2009
2008
2007
2006
80
2005
2018
2017
2016
2015
2014
2013
2012
2011
2010
2009
2008
90
2007
2005
Y-o-y %
change
30
25
20
15
10
5
0
-5
-10
-15
-20
-25
2006
2005
6
6
5
4
4
2
3
1. Export performance is measured as actual growth in exports relative to the growth of the country’s export
market, which represents the potential export growth for a country assuming that its market shares remain
unchanged.
2. Data refer to annualised agreed rate on loans other than revolving loans and overdrafts, convenience and
extended credit card debt to non-financial corporations of less or equal to 1 million euros.
Source: OECD Economic Outlook database; and Eurostat.
StatLink 2 />
OECD ECONOMIC SURVEYS: LITHUANIA 2018 © OECD 2018
2018
2017
2016
2015
2014
2013
2012
Euro area
2011
2010
2008
2007
Lithuania
2006
2018
2017
2016
2015
2014
2013
2012
2011
2010
2009
2008
0
2007
1
-6
2006
-4
2005
2
2004
-2
2005
0
2009
-20
2005
-30
-15
22 │ ASSESSMENT AND RECOMMENDATIONS
Figure 6. Investment rates remain low
A. Investment rate
% of GDP
40
35
30
B. Investment composition
% of GDP
25
Lithuania
EA16
Latvia
Estonia
Poland
Business investment
Government investment
20
Households investment
15
25
10
20
2016
2015
2014
2013
2012
2011
2010
2009
2008
2007
2006
2005
2004
2003
2002
0
2001
2000
2001
2002
2003
2004
2005
2006
2007
2008
2009
2010
2011
2012
2013
2014
2015
2016
2017
2018
10
2000
5
15
Source: OECD Economic Outlook database; and Eurostat.
StatLink 2 />
Stronger activity has also helped reduce unemployment, which edged down to less than
7% of the labour force towards the end of 2017, more than 10 percentage points below its
2010-peak (Figure 7). Lower unemployment is due not only to the employment gains in
sectors such as industry and services, but also reflects a shrinking labour force as a result
of unfavourable demographics. At the same time, labour force participation, especially
among older workers, rose potentially reflecting a rising retirement age and low pensions
and social support.
External positions are sustainable with foreign debt at 83% of GDP in 2017 and the net
international investment position on an improving trend (Figure 8) The deficit is financed
essentially by a rise in foreign direct investment (FDI) and in portfolio investment. The
inward FDI stock stood at around 37 % in 2017, less than in other Baltic countries. Many
projects in recent years concerned shared services centres, which require little capital
expenditure and hence do not contribute much to the FDI stock. By this token more FDI
would not only improve external sustainability but help boost productivity with transfer
of know how (OECD, 2016a). Therefore, improving the business environment to attract
FDI remains important.
OECD ECONOMIC SURVEYS: LITHUANIA 2018 © OECD 2018
ASSESSMENT AND RECOMMENDATIONS
│ 23
Figure 7. Labour market and wage developments
B. Population and labour foce participation
A. Labour force, employment and unemployment
rate
Index,
2005=100
110
Index.
% labour
force 15-74 2005=100
21 120
Total employment
105
Labour force
70
18 100
68
100
Unemployment rate 15
80
66
95
12
60
64
90
9
40
62
85
6
20
Population 15-74
60
Agriculture
-3%
D. Real wages and productivity
Index,
2005Q1 =100
C. Employment dynamics
Average annualised quarterly contribution 20112017
Others
26%
0
2002
2003
2004
2005
2006
2007
2008
2009
2010
2011
2012
2013
2014
2015
2016
2017
3
2017
2016
2015
2014
2013
2012
2011
2010
2009
2008
2007
2005
80
2006
Labour force participation rate (RHS)
160
Construction
9%
Labour productivity of the total economy
Real wage rate, total economy
150
Manufacturin
g
13%
140
130
120
Professional
activities
28%
StatLink 2 />
2018
2017
2016
2015
2014
2013
2012
2011
2010
2009
EA16
Estonia
Source: OECD Labour force statistics database; OECD Economic Outlook database; and Eurostat.
OECD ECONOMIC SURVEYS: LITHUANIA 2018 © OECD 2018
2018
2017
2016
2015
2014
2013
2012
2011
2010
2009
2008
Lithuania
Latvia
Poland
2008
2005
United States
Mexico
Spain
Czech Rep.
Japan
Estonia
Netherlands
Ireland
Canada
Germany
Slovak Rep.
Greece
United Kingdom
Belgium
Korea
OECD
Latvia
Hungary
Lithuania
Australia
Poland
Luxembourg
Israel
Portugal
Slovenia
France
New Zealand
Chile
Turkey
2007
2006
Index,
2005=100
160
150
140
130
120
110
100
90
80
Ratio
0.8
0.7
0.6
0.5
0.4
0.3
0.2
0.1
0
F. Competitiveness indicator
(unit labour costs)
2007
E. Minimum wage to median wage of full time
workers, 2016
2006
100
Trade
21%
2005
110
58