Above ground biomass estimation by using variant allometric equations on various age groups of teak (tectona grandis) trees in forest plantation of mae ho phra, chiang mai province, thailand
Bạn đang xem bản rút gọn của tài liệu. Xem và tải ngay bản đầy đủ của tài liệu tại đây (1.77 MB, 75 trang )
THAI NGUYEN UNIVERSITY
UNIVERSITY OF AGRICULTURE AND FORESTRY
NAFILA TAUFIK ARINAFRIL
ABOVE-GROUND BIOMASS ESTIMATION BY USING VARIANT
ALLOMETRIC EQUATIONS ON VARIOUS AGE GROUPS OF TEAK
(Tectona grandis) TREES IN FOREST PLANTATION OF MAE HO PHRA,
CHIANG MAI PROVINCE, THAILAND
BACHELOR THESIS
Study Mode:
Full-time
Major:
Environmental Science and Management
Faculty:
Advanced Education Program
Batch:
2014 – 2018
Thai Nguyen, 25/09/2018
DOCUMENTATION PAGE WITH ABSTRACT
Thai Nguyen University of Agriculture and Forestry
Degree Program
Student name
Bachelor of Environmental Science and Management
Nafila Taufik Arinafril
Student ID
DTN1454290104A
Thesis Title
Above-Ground Biomass Estimation by Using Variant
Allometric Equations on Various Age Groups of Teak
(Tectona grandis) Trees in Forest Plantation of Mae Ho
Phra, Chiang Mai Province, Thailand
Supervisors
1. Dr. Teerapong Saowaphak
2. Dr. Sa-nguansak Thanapornpoonpong
3. Ho Ngoc Son, Ph.D.
Supervisor’s
signature
Abstract:
Deforestation may lead into the reduction of global terrestrial carbon sink and
substantially contribute towards global climate change. Quantifying biomass of tree
crops by using allometric equations models to determine the Carbon (C) stocks
potential of the tree is vital for understanding the role and contribution of forests on
climate change mitigation effort. On the contrary, reforestation, also by specific tree
crops plantation that can help not only by increasing the global terrestrial carbon sink,
it can also reduce pressure on timber extraction from natural forest leading to forest
conversation, could contribute with the climate change mitigation attempts. Among
all the carbon pool of trees, above-ground biomass constitutes the major portion of
carbon on trees. Hence, this study used variant allometric equations that is designed
to estimate the total amount of above-ground biomass in teak trees, in the northern
part of Thailand. This study was carried out to distinguish the difference on pattern
i
from each equation by three different authors. A total of 291 trees, from three different
age groups of trees, 7 years, 13 years and 21 years old as plot 1, plot 2 and plot 3,
respectively, were measured for above-ground biomass model comparison. The
sample trees were measured for its Girth at Breast Height (GBH) which then later on
converted into Diameter at Breast Height (DBH), and Total Height (H) which were
necessary for the calculation. Equation authorized by Ounban et al. (2016), Jain and
Ansari (2013), and Mwangi (2015) that were used for the calculation, shows a total of
26.29 tC/rai, 40.62 tC/rai and 51.07 tC/rai, respectively, above-ground biomass
content is stored in the measured trees from three different plots combined. The results
showed a significant difference on the total amount of above-ground biomass from
each equation, meaning that there are some factors that needs to be considered before
implementing any equation.
Keywords
Above-Ground Biomass, Allometric Equations, Carbon
Sink, Forest Plantation, Teak (Tectona grandis) Tree.
Number of pages
48
Date of Submission
25/09/2018
ii
ACKNOWLEDGEMENT
First and foremost, I would like to thank Allah SWT, our Almighty God, who by
His grace and blessings, I had the opportunity to accomplish this study.
Second, I would like to express my gratitude to my advisors, Dr. Teerapong and
Dr. Sa-nguansak of Faculty of Agriculture, Chiang Mai University, and Dr. Ho Ngoc
Son of Thai Nguyen University of Agriculture and Forestry (TUAF), for their
constructive criticism and efficacious supervision, leading to the success of this study.
Also, to the staff officers from the Faculty of Agriculture and International Office of
Chiang Mai University, for all the help during my stay in Chiang Mai. Special gratitude
goes to Ms. Yim and Ms. Linn, who spent a lot of their time assisting me despite their
tight schedule. Moreover, I highly appreciate all the help and effort from my Thai
buddies, Mr. Gene and Ms. Giff, which without their guides throughout my daily lives
in Chiang Mai, would have been impossible. And also, to Mr. Adisorn and staff officers
of Mae Ho Phra Forest Plantation, I would like to give my gratitude for their assistance
in data collection.
Finally, for the unconditional love and uncountable advice and moral support from
both of my parents, Ayah and Bunda, and my two siblings, Nabila and Naufal, I would
like to give my sincerest gratefulness, which without it, I would not have the courage
and strength to carry out this study.
Sincerely,
Nafila Taufik Arinafril
iii
TABLE OF CONTENTS
LIST OF FIGURES ................................................................................................... vi
LIST OF TABLES ................................................................................................... vii
LIST OF ABBREVIATIONS ................................................................................. viii
PART I. INTRODUCTION ....................................................................................... 1
1.1. Research Rationale .............................................................................................. 1
1.2. Research Objectives ............................................................................................ 3
1.3. Research Questions and Hypotheses ................................................................... 4
1.4. Limitations ........................................................................................................... 5
1.5. Definitions ........................................................................................................... 5
1.5.1. Mae Ho Phra Forest Plantation......................................................................... 5
1.5.2. Haga Altimeter ................................................................................................. 6
PART II. LITERATURE REVIEW ........................................................................... 8
2.1. Greenhouse Gases and Climate Change .............................................................. 8
2.2. Forest as Climate Change Mitigation Option ...................................................... 9
2.3. Forest Plantation as Carbon Sequestration Potential ......................................... 11
2.4. Teak (Tectona grandis) Tree ............................................................................. 12
2.5. Land Carbon Stock ............................................................................................ 13
2.6. Carbon Cycle ..................................................................................................... 15
2.7. Tree Biomass Estimation Using Allometric Equation ...................................... 16
PART III. METHODS .............................................................................................. 18
3.1. Materials ............................................................................................................ 18
3.2. Methods ............................................................................................................. 18
iv
3.2.1. Collection Site ................................................................................................ 18
3.2.2. Transect Determination .................................................................................. 20
3.2.3. Plot Determination.......................................................................................... 21
3.3. Tree Height and Diameter at Breast Height Measurement ............................... 22
3.3.1. Tree Height Measurement .............................................................................. 22
3.3.2. Diameter at Breast Height (DBH) Measurement ........................................... 23
3.4. Above-Ground Biomass Measurement ............................................................. 24
PART IV. RESULTS AND DISCUSSION ............................................................. 28
4.1. Results ............................................................................................................... 28
4.1.1. Characteristics of Trees .................................................................................. 28
4.1.2. Above-Ground Biomass ................................................................................. 30
4.1.3 Cluster Analysis ............................................................................................... 33
PART V. CONCLUSION ........................................................................................ 42
REFERENCES ......................................................................................................... 43
APPENDICES .......................................................................................................... 49
v
LIST OF FIGURES
Figure 1. Haga Altimeter ................................................................................................ 7
Figure 2. Annual sink absorption of human carbon emissions (Gt CO₂) ..................... 15
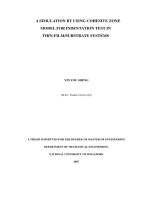
Figure 3. (a) Map of Chiang Mai province, Thailand and (b) map of Teak plantation in
Mae Ho Phra Forest Plantation ..................................................................................... 19
Figure 4. Transect locations .......................................................................................... 20
Figure 5. Sample plot .................................................................................................... 22
Figure 6. Angles for Using Haga Altimeter .................................................................. 23
Figure 7. (a) Tree diameter measurement using diameter tape and (b) Locating breast
height............................................................................................................................. 24
Figure 8. (a) Average Girth and diameter at breast height of trees and (b) Average
height of trees in each plot ............................................................................................ 30
Figure 9. Total amount of above-ground biomass in each plot .................................... 32
Figure 10. Total amount of above-ground biomass ...................................................... 33
Figure 11. Cluster analysis dendrogram of (a) Tree Height and (b) DBH of Tree ...... 36
Figure 12. Cluster analysis dendrogram of above-ground biomass content in (a) Plot 1;
(b) Plot 2 and (c) Plot 3 ................................................................................................. 41
vi
LIST OF TABLES
Table 1. Coordination point of each transections ......................................................... 21
Table 2. Allometric equations comparison ................................................................... 27
Table 3. Diameter and Girth at Breast Height, and Height range of measured trees ... 29
vii
LIST OF ABBREVIATIONS
C
Carbon
DBH
Diameter at Breast Height
FAO
Food and Agriculture Organization
FIO
Forest Industry Organization
GBH
Girth at Breast Height
GHGs
Green House Gases
GtC/year
Gigatonnes Carbon per year
IPCC
Intergovernmental Panel on Climate Change
tC
Ton carbon
tC/rai
Ton carbon per rai
UNFCCC
United Nations Framework Convention on Climate Change
°C
Degree Celsius
viii
PART I. INTRODUCTION
1.1. Research Rationale
Global warming due to the increased concentration of Green House Gases
(GHGs) in the earth’s atmosphere is one of the most important concerns for mankind
today (Sreejesh et al., 2013). Each of the last three decades has been successively
warmer at the Earth’s surface than any preceding decade since 1850. The period from
1983 to 2012 was likely the warmest 30-year period of the last 1400 years in the
Northern Hemisphere. The globally averaged combined land and ocean surface
temperature data show a warming of 0.85ºC [0.65ºC to 1.06ºC] over the period 1880 to
2012. The total increase between the average of the 1850 - 1900 period and the 2003 2012 period is 0.78 [0.72 to 0.85] °C (IPCC, 2014a).
The rise in the carbon dioxide level in the atmosphere is mainly caused by
anthropogenic activities. Anthropogenic greenhouse gas (GHG) emissions since the preindustrial era has driven large increases in the atmospheric concentrations of carbon
dioxide (CO₂), methane (CH₄) and nitrous oxide (N₂O) (IPCC, 2014a).
Increasing evidence of climate change impacts and their consequences in recent
years suggests the need for action. Innovative approaches to assess vulnerability and
adaptation, in the short and long-term, are also important. In 2000, Thailand emitted
GHGs equivalent to 281 million tons of CO₂. With carbon sink of 52 million tons, the
net GHG emissions reached 229 million tons of CO₂ equivalent. Comparing CO₂
equivalent by type of GHG in 2000, CO₂ constituted about 69% of the total, followed
by CH₄ at 26%, and N₂O at 5% (Office of Natural Resources and Environmental Policy
and Planning, 2010).
1
The world’s forests are prominent sites to study climate change, not only in terms
of total net carbon emissions but also in terms of global storage capacity which is
important for climatic regulations. Processes of nutrient uptake and cycling in forest
ecosystems are highly influenced by the changes in temperature or precipitation regimes
as well as by changes in the atmospheric CO₂ concentration (Terakunpisut et al., 2007).
It is estimated that the world’s forests store 283 giga-tonnes (Gt) of carbon in their
biomass alone and 638 Gt of carbon in the ecosystem as a whole. Roughly half of total
carbon is found in forest biomass and dead wood combined and half in soils and litter
combined (FAO, 2005). Forests store carbon and contain approximately 80% of the total
above-ground organic carbon and 40% of the total below-ground organic carbon
worldwide. Deforestation and forest degradation contribute 15% – 20% of global carbon
emissions, and most of this contribution comes from tropical regions. Approximately
60% of the carbon sequestered by forests is released back into the atmosphere via
deforestation (Vicharnakorn et al., 2014).
United Nations Framework Convention on Climate Change (UNFCCC) has
recognized the importance of plantation forestry as a greenhouse gas mitigation option,
as well as the need to monitor, preserve and enhance terrestrial carbon stocks (Updegraff
et al., 2004). Forest plantations have significant impact as a global carbon. Young
plantations can sequester relatively large quantities of carbon while a mature plantation
can act as a reservoir (Sreejesh et al., 2013).
Teak (Tectona grandis) tree is a fine quality timber-yielding deciduous species
particularly suitable for rapid production of large volumes of timber, poles and fuel
wood (Kaul et al., 2010). Long rotation species such as teak has a long carbon locking
period compared to short duration species and has the added advantage that most of the
2
teak wood is used indoors extending the locking period further (Sreejesh et al., 2013).
In addition, production from plantation forests may relieve pressure on timber extraction
from natural forests, and thus contribute to forest conservation (Kaul et al., 2010).
With regard to the mitigation of climate change impacts, the amount of CO₂ in
the atmosphere must be controlled by increasing the amount of CO₂ uptake by plants as
much as possible and suppress the release (emission) of CO₂ into the atmosphere as low
as possible. So, maintaining the integrity of natural forests and planting trees is very
important to reduce the amount of excess CO₂ in the air (Hairiah & Rahayu, 2007).
Hence, with a large area of teak tree plantation, Mae Ho Phra Teak Plantation not
only provides forest products, it also acts as a land carbon sink. With 3,576.68 acre or
1,447.43 hectares area, as well as the weeds, shrubs and peat within the teak plantation
area that also sequester carbon, making Mae Ho Phra Forest Teak Plantation as one of
the largest carbon sinks in Chiang Mai province. To study the total amount of carbon
sequestrated by teak trees in this area, the researcher proposed the study “Above-Ground
Biomass Estimation by Using Variant Allometric Equations on Various Age Groups of
Teak (Tectona grandis) Tree in Forest Plantation of Mae Ho Phra, Chiang Mai Province,
Thailand.”
1.2. Research Objectives
The main objective of this research is to obtain an overview of potential aboveground biomass and to determine the pattern of above-ground biomass changes in
various age group of teak trees in Mae Ho Phra Forest Plantation.
This research specifically aims:
1. To identify the physical appearances of teak trees age 7, 13 and 21 years old in
Mae Ho Phra Forest Plantation.
3
2. To compute the total amount of above-ground biomass content in teak trees.
3. To distinguish the pattern difference on the total amount of above-ground
biomass in teak trees using 3 different allometric equations.
4. To see the similarity of physical appearances and above-ground biomass of teak
trees.
1.3. Research Questions and Hypotheses
This study wants to address the following questions:
1. What are the characteristics of teak trees age 7, 13 and 21 years old in Mae Ho
Phra Forest Plantation?
2. What is the amount of above-ground biomass in 7, 13 and 21 years old of teak
trees in Mae Ho Phra Forest Plantation?
3. How much is the difference in total amount of above-ground biomass in teak
trees that grows older?
4. How much difference that occurs after computations using 3 different aboveground biomass allometric equations?
5. Which trees that has the closest and furthest similarities with each other in terms
of physical form and above-ground biomass content?
• Alternative Hypothesis:
1. The total amount of above-ground biomass in teak trees grows larger as the tree
ages.
2. There are differences on the total amount of above-ground biomass between three
different above-ground biomass allometric equations.
4
• Null Hypothesis:
1. The total amount of above-ground biomass in teak trees does not grow larger as
the tree ages.
2. There are no differences on the total amount of above-ground biomass between
three different above-ground biomass allometric equations.
1.4. Limitations
Limitation that were encountered throughout the study:
• The condition of plantation was not well-maintained. A lot of weeds and shrubs that
hampered the researcher to gather the data and made the researcher to spend a lot of
energy. In the height measurement of trees using Haga Altimeter, a clear viewing
angle is required between the researcher and the tree, but due to the abundance of
weeds and shrubs, the researcher's point of view becomes less clear. Therefore, the
data measured might not be 100% accurate.
• Limited time. The field observation was only conducted for 3 days. From May 22,
until May 24. The staff of plantation requested the researcher to work not more than
4pm, due to some dangerous factors that might occur when it gets dark, since it is a
forest plantation.
• Language Barrier. The researcher had some difficulties on communicating with the
staff of plantation since the researcher was unable to speak Thai and the staff of
plantation does not speak English.
1.5. Definitions
1.5.1. Mae Ho Phra Forest Plantation
Mae Ho Phra Forest Plantation is located in Mae Ho Phra sub-district of Mae
Tang district, Chiang Mai province, Thailand. It was established in 1971 by the Thai
5
government. With an area of 9,392.4 or 1,502.8 hectares, making it a large area of forest
plantation in the northern part of Thailand. Mae Ho Phra Forest Plantation owns 3
species of monoculture plant plantation, which is teak (Tectona grandis) with an area of
8,867.74 rai or 1,418.43 hectares, Eucalyptus (Eucalyptus globulus) with an area of
88.10 rai or 14.1 hectares and Rubber (Hevea brasiliensis) tree with an area of 436.56
rai or 69.85 hectares.
Its climate is tropical, dominated by the southwest monsoon from May to October,
which brings high rainfall and humidity to the region. Average annual rainfall ranges
from 1250 mm in the northeast to more than 4000 mm in the southern peninsula. Dry
season runs from November to April, with relatively cool temperatures until February.
March through May is dry and hot. Average annual temperature is 28.90ºC (Ongprasert,
2010).
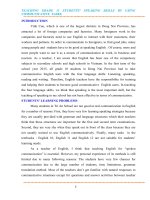
1.5.2. Haga Altimeter
Haga Altimeter or also known as Haga-meter, is a gravity-controlled pivoted
pointer with a series of scales ranging from 15, 20, 25 and 30 meters, chains (66’ L) and
a percent scale. Baseline scales are assigned by the user, and the baseline length is
selected by turning an adjustment wheel to the desired scale.
6
Figure 1. Haga Altimeter
7
PART II. LITERATURE REVIEW
2.1. Greenhouse Gases and Climate Change
Over the next decades, it is predicted that billions of people, particularly those in
developing countries, will face shortages of water and food and greater risks to health
and life as a result of climate change (UNFCCC, 2007)
World leaders gathered in Kyoto, Japan, in December 1997 to consider a world
treaty restricting emissions of ‘‘greenhouse gases’’ chiefly carbon dioxide (CO₂), that
are thought to cause ‘‘global warming’’ – severe increases in Earth’s atmospheric and
surface temperatures, with disastrous environmental consequences. CO₂ levels have
increased substantially since the Industrial Revolution and are expected to continue
doing so. It is reasonable to believe that humans have been responsible for much of this
increase. Greenhouse gases cause plant life, and the animal life that depends on the
environment, to thrive (Robinson et al., 1998).
CO₂ emissions from fossil fuel combustion and industrial processes contributed
about 78% to the total GHG emission increase between 1970 and 2010. The largest
sources of greenhouse gases were the sectors of energy production (34%, mainly CO₂
from fossil fuel combustion), and agriculture, forestry and land-use (24%, mainly CH₄
and N₂O) (IPCC, 2014b).
Levels of greenhouse gases in the atmosphere are rapidly increasing, warming
the Earth’s surface and lower atmosphere. Higher temperatures lead to climate change
that includes effects such as rising sea levels, changes in precipitation patterns that can
produce floods and droughts and the spread of vector-borne diseases such as malaria
(Pullaiah et al., 2015).
8
Actions to limit damage from climate change need to be implemented now in
order to be effective. Mitigation actions involve direct reduction of anthropogenic
emissions or enhancement of carbon sinks that are necessary for limiting long-term
climate damage also by avoiding deforestation and degradation is a priority in reducing
greenhouse gas emissions (Pullaiah et al., 2015; Tubiello, 2012). Direct options in
agriculture, forestry and other land use (AFOLU) involve reducing CO₂ emissions by
reducing deforestation, forest degradation and forest fires; and storing carbon in
terrestrial systems (for example, through afforestation) (IPCC, 2014b). Deforestation is
having a considerable impact on the ability of the terrestrial biosphere to emit or remove
carbon dioxide from the atmosphere. Scientists have also determined that tropical
deforestation releases 1.5 Gt of carbon into the atmosphere each year (Gullison et al.,
2007).
2.2. Forest as Climate Change Mitigation Option
Forest vegetation and soils constitute a major terrestrial carbon pool with the
potential to absorb and store carbon dioxide (CO₂) from the atmosphere. The CO₂ source
and sink dynamics as trees grow, die, and decay are subjected to disturbance and forest
management (Kaul et al., 2010). Forests make up around 30% of the world’s land
surface, and forest ecosystems, including their soils, store approximately 1200 giga
tonnes of carbon which is considerably more than is present in the atmosphere (around
762 GtC) (Freer-Smith et al., 2007).
Forests sequester and store more carbon than any other terrestrial ecosystem and
are an important natural ‘brake’ on climate change. When forests are cleared or
degraded, their stored carbon is released into the atmosphere as carbon dioxide (CO₂).
The largest source of greenhouse gas emissions in most tropical countries is from
9
deforestation and forest degradation (Gibbs et al., 2007). Forests covers just over 4
billion hectares of the world’s surface. According to data from the UN Food and
Agriculture Organization, deforestation was at its highest rate in the 1990s, when each
year the world lost on average 16 million hectares of forest. As forest expansion
remained stable, the global net forest loss between 2000 and 2010 was 5.2 million
hectares per year. During the next 20 – 30 years, the world could lose more than a million
species of plants and animals – primarily because of environmental changes due to
humans (Pullaiah et al., 2015).
Tropical deforestation not only reduces the capacity of this CO₂ sink, but it also
directly adds CO₂ to the atmosphere. From 2005 to 2010, tropical forest carbon stocks
decreased by approximately 0.5 GtC/year (FAO, 2010 as cited in Jantawong et al.,
2017).
The total standing above-ground biomass of woody vegetation elements is often
one of the largest carbon pools. The above-ground biomass comprises all woody stems,
branches, and leaves of living trees, creepers, climbers, and epiphytes as well as
herbaceous undergrowth. For agricultural lands, this includes crop and weed biomass.
An estimate of the vegetation biomass can provide us with information about the
nutrients and carbon stored in the vegetation as a whole, or the amount in specific
fractions such as extractable wood (Hairiah et al., 2001).
Conversely reforestation in the tropics could increase the carbon sink and remove
substantial amounts of CO₂ from the atmosphere. Realization of the significant
contribution that tropical reforestation could make towards mitigating global climate
change has led to what could be described as a global reforestation frenzy (Jantawong
et al., 2017).
10
The main mitigation options within agriculture, forestry and land use involve one
or more of three strategies: prevention of emissions to the atmosphere by conserving
existing carbon pools in soils or vegetation or by reducing emissions of methane and
nitrous oxide; sequestration - increasing the size of existing carbon pools and thereby
extracting carbon dioxide (CO₂) from the atmosphere through reforestation and
afforestation; and substitution - substituting biological products for fossil fuels or
energy-intensive products, thereby reducing CO₂ emissions. Demand-side measures
(e.g., reducing losses and wastes of food, changes in human diet, or changes in wood
consumption) may also play a role (IPCC, 2014a).
2.3. Forest Plantation as Carbon Sequestration Potential
Forests and trees are being planted for many purposes and at increasing rates, yet
they still account for a fairly small proportion of total forest area. Forest plantations – a
subset of planted forests consisting primarily of introduced species – make up an
estimated 4 percent of total forest area. Productive forest plantations, primarily
established for wood and fibre production, account for 78 percent of these, and
protective forest plantations, primarily established for conservation of soil and water,
account for 22 percent. The area of forest plantations increased by about 14 million
hectares during 2000 – 2005, or 2.8 million hectares per year, 87 percent of which are
productive forest plantations (FAO, 2005).
In 2001, FAO stated that forests in the Asia-Pacific region cover approximately
699 million hectares. Of this area, some 113.2 million hectares are forest plantations, or
16 percent of the total forest resource. The Asia-Pacific region accounts for some 61
percent of the world’s plantation forests. The majority of the global forest plantation
resource is been established in a small group of countries. Five countries from Asia rank
11
among the top ten plantation countries in the world: China (46.7 million hectares); India
(32.6 million hectares); Japan (10.7 million hectares); Indonesia (9.9 million hectares);
and Thailand (4.9 million hectares). Together, these five countries account for 55
percent of the global forest plantation resource (Enters et al., 2004).
With the advent of the Kyoto Protocol and its recognition of the use of forestry
activities and carbon sinks as acceptable tools for addressing the issue of the build-up
of atmospheric carbon, the potential role of planted forests as a vehicle for carbon
sequestration has taken on a new significance (Sedjo, 1999).
Additionally, the emergence of tradable emission permits and now tradable
carbon offsets provides a vehicle for financially capturing the benefits of carbon
emission reductions and carbon offsetting activities. In a world where carbon
sequestration has monetary value, investments in planted forests can be made with an
eye to revenues to (at least two) joint outputs: timber and the carbon sequestration
services. It should be noted that almost all of the studies thus far have focused on the
cost of carbon sequestration as a single output, rather than as a joint output with timber
(Sedjo, 1999).
2.4. Teak (Tectona grandis) Tree
Teak (Tectona grandis) is highly rated among hardwood plantations due to its
durability, mellow color, and long straight cylindrical bole. It has been a popular tree
species for timber production in commercial and private farmland and remains a
promising species for carbon sequestration in the seasonally dry tropics (Takahasi et al.,
2012). It is a valuable timber yielding species in the tropics especially India, Indonesia,
Malaysia, Myanmar, northern Thailand, and north-western Laos (Sreejesh et al., 2013).
12
According to The Forest Industry Organization (FIO) in 2010 as cited in (Ounban
et al., 2016), in Thailand, the increased demand for wood, particularly fuel wood, has
led to a rapid expansion of plantations of fast-growing species such as eucalypt and teak
and of slower growing species including more than 183,000 ha of land that has been
planted in the last decades. Teak was mostly planted in the northern part of Thailand
(94,000 ha).
The ability of teak in sequestrating carbon is determined by age class or growth
level. The content of biomass and carbon of teak plantations increase in every increased
plant age and the quality of plantation’s growing site. This is due to the increased plant
age resulting from bigger plants as well as better growing areas which provide a better
nutrient element. Information about patterns of changes in carbon storage, in particular
on teak forests is vital and urgent so that it can be used to help as a determinant of forest
management and environmental policies in order to predict and identify deposit patterns
or carbon storage and changes as early as possible, and to determine the next steps
(Chanan & Iriany, 2014). Teak plantation would represent a reasonable recommendation
for tree species when managing plantations with carbon sequestration and a high-quality
timber (Takahasi et al., 2012).
2.5. Land Carbon Stock
Knowledge that CO₂ is stored within and exchanged between the atmosphere and
vegetation and soils has led to the suggestion that soils and vegetation could be managed
to increase their uptake and storage of CO₂, and thus become ‘land carbon sinks’ (The
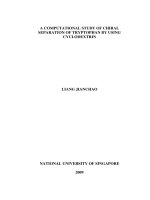
Royal Society, 2001). Of the total carbon dioxide emitted by human activity since 1750
about 44% remains in the atmosphere, 30% has been absorbed by the ocean and 26%
by land carbon sinks including trees, soils and fungi (refer to Figure 2) (Wilson, 2013).
13
Forest ecosystems are in focus as potential sinks for carbon, and carbon stocks
and dynamics of soils of the forest, hereafter termed forest soils, are differ from those
of other land uses (Callesen et al., 2015). Tropical forests are a major terrestrial sink for
atmospheric CO₂, absorbing about 18% of anthropogenic emissions (Jantawong et al.,
2017). The main carbon pools in tropical forest ecosystems are the living biomass of
trees and understory vegetation and the dead mass of litter, woody debris and soil
organic matter. The living biomass included upper part and lower part of roots, trees,
herb plants, bushes and ferns. The dead biomass comprises litter and rough timber
remains. Soil makes up mineral, organic layers and turf. The carbon stored in the
aboveground living biomass of trees is typically the largest pool and the most directly
impacted by deforestation and degradation. Thus, estimating aboveground forest
biomass carbon is the most critical step in quantifying carbon stocks and fluxes from
tropical forests (Gibbs et al., 2007; Chanan & Iriany, 2014).
The below ground biomass comprises living and dead roots, soil fauna and the
microbial community. Soil carbon, specifically in the form of soil organic matter, plays
a central role in the functioning of soils to produce a wide range of vital environmental
goods and services. Soils store carbon from the atmosphere as a way to mediate
atmospheric greenhouse gas levels (Banwart et al., 2015). In addition, aboveground
biomass is a key variable in the annual and long-term changes in the global terrestrial
carbon cycle and other earth system interactions (Terakunpisut et al., 2007).
The estimates of carbon stock are also important for scientific and management
issues such as forest productivity, nutrient cycling, and inventories of fuel wood and
pulp. It is also important in the modelling of carbon uptake and redistribution within
14
ecosystems. Thus, its dynamics must be understood if annual spatial variations are to be
related to spatial weather and climate variables (Terakunpisut et al., 2007).
Figure 2. Annual sink absorption of human carbon emissions (Gt CO₂)
Source: Burning the Carbon Sink, 2013
2.6. Carbon Cycle
Carbon (C), the fourth most abundant element in the Universe, after hydrogen
(H), helium (He), and oxygen (O), is the building block of life. On Earth, carbon cycles
through the land, ocean, atmosphere, and the Earth’s interior in a major biogeochemical
cycle (the circulation of chemical components through the biosphere from or to the
lithosphere, atmosphere, and hydrosphere) (Welch, n.d).
Atmospheric CO₂ is increasing at about half the rate of fossil fuel emissions; the
rest of the CO₂ emitted either dissolves in sea water and mixes into the deep ocean or is
taken up by terrestrial ecosystems. Uptake by terrestrial ecosystems is due to an excess
of primary production (photosynthesis) over respiration and other oxidative processes
(decomposition or combustion of organic material). Terrestrial systems are also an
anthropogenic source of CO₂ when land-use changes (particularly deforestation) lead to
15
loss of carbon from plants and soils. Nonetheless, the global balance in terrestrial
systems is currently a net uptake of CO₂ (Prentice et al., 2001).
Photosynthesis and respiration are the primary processes facilitating carbon
exchange between the land and the atmosphere. During photosynthesis, organisms
capable of carbon assimilation, mostly plants and Cyno-bacteria, absorb CO₂, and, with
participation of H₂O and solar energy, they synthesize organic compounds forming the
organisms’ biomass. Animals and microorganisms, as the successive levels of a food
chain, utilize the biomass, enabling further carbon cycling. Most of the living organisms
oxidize organic matter in order to generate energy necessary for them to function.
Besides energy, H₂O and CO₂ are the final products of the oxidation. The resulting CO₂
is most often released to the atmosphere (Kuliński & Pempkowiak, 2012). The presence
of land vegetation enhances the weathering of soil, leading to the long-term but slow
uptake of carbon dioxide from the atmosphere (Welch, n.d).
2.7. Tree Biomass Estimation Using Allometric Equation
Estimation of tree biomass is important for assessing productivity and carbon
sequestration and (Henry et al., 2010 as cited in Ounban et al., 2016), reported that
measurements to develop allometric equations could be carried out by either direct or
indirect methods. Direct methods measure the biomass by weighing trees in the field
while indirect methods involve the estimation of difficult-to-measure parameters from
easy-to-measure tree parameters.
An allometric equation is an indirect method to estimate the whole or partial
weight of the tree (stem, leaves, branches and roots), from measurable tree dimensions,
including the diameter at breast height (D) and total height (H); thus, weight can be
estimated non-destructively. Standard allometric equation which reasonably predicts the
16