Analysis of land use change and the worker’s perception towards changes from 2007 2017 a case study in nam tu liem district, hanoi, vietnam
Bạn đang xem bản rút gọn của tài liệu. Xem và tải ngay bản đầy đủ của tài liệu tại đây (2.78 MB, 100 trang )
THAI NGUYEN UNIVERSITY
UNIVERSITY OF AGRICULTURE AND FORESTRY
PAULINE VIOLANDA HOSTALERO
ANALYSIS OF LAND USE CHANGE AND THE WORKER’S
PERCEPTION TOWARDS CHANGES FROM 2007 – 2017: A CASE STUDY
IN NAM TU LIEM DISTRICT, HANOI, VIETNAM
BACHELOR THESIS
Study Mode: Full-time
Major
: Environmental Science and Management
Faculty
: Advanced Education Program Office
Batch
: 2015 - 2018
Thai Nguyen, 15/11/2018
DOCUMENTATION PAGE WITH ABSTRACT
Thai Nguyen University of Agriculture and Forestry
Degree Program
Bachelor of Environmental Science and Management
Student name:
Pauline Violanda Hostalero
Student ID:
DTN1454290085
Thesis Title:
Analysis of land use change and the worker’s perception
towards changes from 2007-2017: A case study in Nam Tu
Liem District, Hanoi, Vietnam
Supervisor:
Assoc. Prof. Nguyen Thi Ha
Signature:
Abstract: Land use change has been assessed widely using Remote Sensing (RS)
and Geographic Information System (GIS) techniques. A study about land use change
along with the self-employed workers’ perception towards land use changes were
carried out in Nam Tu Liem District, Hanoi, Vietnam. The study examined and
analyzed the land use changes occurred between 2007 and 2017. Three Landsat
images were acquired including Landsat 5 TM, Landsat 7 ETM+, and Landsat 8
OLI/TIRS for the year 2007, 2013, and 2017, respectively. The result of the study
shows that the built-up lands have increased and remained to be the dominant land
among land use types in 2017. The agriculture has been declining mainly due to
conversion into built-up land. Other land use type including water, bare land, and
vegetation have shown slight changes throughout the years. Overall changes from
2007 to 2017 shown that built-up land gained the most and agriculture lost the most
land. Moreover, the land use change study only covers the general aspects which
specific area such as residential, recreational, commercial etc. are not included. On
ii
the other hand, the perception study includes a total of 100 respondents, which are
divided into three sectors: wholesale and retail; accommodation and catering services;
and other services. Major findings indicate that about two-thirds or 69% of
respondents are aware of land use change happenings in the district. However, almost
one-third or 31% are unaware of the studied topic. There are several factors that may
affect the awareness of self-employed workers which will be cursory discussed in the
study. Furthermore, the study only focuses on the analysis of land use change and the
self-employed worker’s perception towards changes. This study in Nam Tu Liem
District is just a first step to determine and understand the major drivers and impacts
of changes in the area. A detailed land use change study and a larger population size
for perception studies are recommended in order for the government to formulate
policies to achieve sustainable development.
Keywords:
Land use change, urbanization, change detection, remote
sensing, geographic information system, awareness
Number of pages:
90
Date of Submission:
15/11/2018
iii
ACKNOWLEDGEMENT
First and foremost, I would like to express my sincere gratitude to everyone
that helped me to be where I am right now and to everyone that helped me to
accomplish this study. To my supervisor, Assoc. Prof. Nguyen Thi Ha from VNU
University of Science, Ha Noi, for the guidance, help, suggestions, and
encouragement in writing my bachelor thesis. To Mr. Nguyen Van Hieu from
Thai Nguyen University of Agriculture and Forestry, who has helped me a lot,
especially for introducing GIS to me. To Mr. Nguyen Cong Doan of UBND Nam
Tu Liem district who helped me with population data gathering despite of busy
schedule. To Ms. Hong Ha and Ms. Khanh Linh Vu for providing us the essential
documents and requirements for the internship and for helping us since the
beginning of our study in AEP.
I am grateful for the opportunity that the Advanced Education Program
(AEP) gave me, specifically an opportunity to study here in Thai Nguyen
University of Agriculture and Forestry, in Thai Nguyen City, Vietnam.
I would like to extend my deepest gratitude to my friends: Jessica,
Francina, Luis, Kristina, Enzo, Lester, AJ, Joy, and Vea. I would like to thank
them for lifting each other up, for helping me and one another in academic tasks
and even personal challenges, also for sticking with one another through ups and
downs. I would also like to thank my Vietnamese friends: Chi Kieu Anh, Chi
Minh Anh, Le Na, Chi Sam, and Chi Mai for helping me with translations and
for being such a good chi to me since the start.
iv
I will also be forever grateful to my family, for their moral support, love,
and care. And the last but not the least, to my God, who believes in me, who loves
me, and who stays by my side since day one. All praises and glory to Him!
Pauline V. Hostalero
K46 NO2
v
TABLE OF CONTENTS
LIST OF FIGURES ........................................................................................... viii
LIST OF TABLES ................................................................................................ix
LIST OF ABBREVIATIONS ............................................................................... x
PART I. INTRODUCTION .................................................................................. 1
1.1. Background of the Study ............................................................................... 1
1.2. Background of the Study Area ...................................................................... 4
1.3. Statement of the Problem .............................................................................. 6
1.4. Research Objectives ...................................................................................... 7
1.5. Research Questions ....................................................................................... 8
1.6. Research Rationale ........................................................................................ 8
1.7. Limitations ..................................................................................................... 9
1.8. Definitions and Concepts ............................................................................ 10
PART II. LITERATURE REVIEW .................................................................. 11
2.1. Land Use Change ........................................................................................ 11
2.1.1. What is Land Use Change? .................................................................. 11
2.1.2. Importance of Land Use Change .......................................................... 12
2.1.3. Land Use Change Detection using RS and GIS ................................... 13
2.2. Land Use Change Factors, Impacts, and Mitigations ................................. 14
2.2.1. Major Factors of Land Use Change...................................................... 14
2.2.2. Impacts of Land Use Change................................................................ 20
2.2.3. Mitigation for Land Use Change Impacts ............................................ 25
2.3. Related studies on Land Use Change Worldwide ...................................... 27
2.4. Related Studies on Land Use Change in Vietnam ...................................... 28
vi
2.5. The Land use and the Workers Interactions in Vietnam ............................ 30
PART III: RESEARCH OBJECT AND METHODS ..................................... 31
3.1. Research Object, Scope, and Content ......................................................... 31
3.1.1. Research Object .................................................................................... 31
3.1.2. The scope of the research ..................................................................... 31
3.1.3 The content of the research .................................................................... 31
3.2 Research Methods ........................................................................................ 32
3.2.1. Data Collection ..................................................................................... 32
3.2.2. Detection of Land Use Change ............................................................. 34
3.2.3 Surveying Worker’s Perception towards Land Use Change ................ 43
PART IV. RESULTS AND DISCUSSION ....................................................... 44
4.1. Land Use Change Detection........................................................................ 44
4.1.1. Land Use Classification ........................................................................ 44
4.1.2. Accuracy Assessment of Land Use Classification ............................... 45
4.1.3. Land Use Change Detection ................................................................. 49
4.2. Worker’s awareness towards land use change............................................ 55
PART V. CONCLUSION AND RECOMMENDATIONS ............................. 68
REFERENCES ..................................................................................................... 71
APPENDICES ...................................................................................................... 81
vii
LIST OF FIGURES
Figure 1.1 Location of the study area ...................................................................... 6
Figure 3. 1. Clipped image of the study area in 2007, 2013, and 2017 ................ 37
Figure 3. 2. Methods used for land use mapping .................................................. 42
Figure 4. 1. The land use classes’ area in hectares................................................ 45
Figure 4. 2. The land use maps of Nam Tu Liem district in 2007, 2013, and 2017
................................................................................................................................ 48
Figure 4. 3. Land use change maps of Nam Tu Liem district from different years
................................................................................................................................ 51
Figure 4. 4. The land use change map of Nam Tu Liem district from 2007 to 2017
................................................................................................................................ 52
Figure 4. 5. Gains and losses by each class between 2007 and 2013 (by hectares)
................................................................................................................................ 53
Figure 4. 6. Gains and losses by each class between 2013 and 2017 (by hectares)
................................................................................................................................ 54
Figure 4. 7. Gains and losses by each class between 2007 and 2017 (by hectares)
................................................................................................................................ 54
viii
LIST OF TABLES
Table 3. 1. Detailed description of collected satellite images .............................. 33
Table 3. 2. Landsat 5 TM bands ............................................................................ 35
Table 3. 3. Landsat 7 ETM bands.......................................................................... 35
Table 3. 4. Landsat 8 OLI/TIRS bands ................................................................. 36
Table 3. 5. Land use classes and its specification ................................................. 38
Table 3. 6. Indices and its formula ........................................................................ 39
Table 4. 1. The land use classes’ area and percentage in hectares ....................... 44
Table 4. 2. Confusion matrix for the year 2007 .................................................... 46
Table 4. 3. Confusion matrix for the year 2013 .................................................... 47
Table 4. 4. Confusion matrix for the year 2017 .................................................... 47
Table 4. 5. Land use class conversions from 2007, 2013, and 2017 .................... 50
Table 4. 6. Gains and losses by each class between 2007 and 2017 .................... 54
Table 4. 7. Frequency and percentage of respondents awareness about land use
changes in Nam Tu Liem ....................................................................................... 55
Table 4. 8. Source of awareness of the respondents towards land use change..... 56
Table 4. 9 Respondents who want land use change to continue ........................... 58
Table 4. 10. Respondents who do not want land use change to continue ............ 58
Table 4. 11. Major problems in the district due to land use change ..................... 59
Table 4. 12. Changes that the respondents would like to see in the district ......... 60
Table 4. 13. The respondent’s level of education ................................................. 61
Table 4. 14. Number of unaware and aware respondents which are residents and
migrants in Nam Tu Liem district ......................................................................... 62
Table 4. 15. Duration of the respondent’s residency ............................................ 62
ix
LIST OF ABBREVIATIONS
BSI
Bare Soil Index
CE
Commission Error
DN
Digital Number
DOS
Dark Object Subtraction
ETM+
Enhanced Thematic Mapper
GIS
Geographic Information System
HMP
Hanoi Master Plan
LUCC
Land Use/Cover Change
LULC
Land Use and Land Cover
LUC
Land Use Change
NDBI
Normalized Difference Built-Up Index
NDVI
Normalized Difference Vegetation Index
NDWI
Normalized Difference Water Index
NIR
Near Infrared
OE
Omission Error
OLI/TIRS
Operational Land Imager and Thermal Infrared Sensor
PA
Producer’s Accuracy
RS
Remote Sensing
SWIR
Shortwave Infrared
TOA
Top of Atmosphere
TM
Thematic Mapper
UA
User’s Accuracy
USGS
United States Geological Survey
x
PART I. INTRODUCTION
1.1. Background of the Study
Every country in the world is currently facing certain challenges in their
own environment, economy, and society. Land use and land cover changes are
considered the major drivers of these challenges due to urbanization. Moreover,
urbanization is a human-induced activity which has an influence on the land use
and land cover that affect different sectors. One of the drivers of urbanization is
the continuous increase of human population, particularly the urban-dwellers.
According to United Nations (2014), the global urban populations have already
exceeded the global rural populations in 2007. In 1950, it was reported that 70%
of world’s population are residing in rural areas and only 30% are residing in urban
areas. While in 2014, about 54% or half of the world’s population was reported to
be residing in urban areas and it is estimated to increase about 66% by 2050. It was
also projected that the world’s population will rise from 3.5 billion (as of 2010) to
6.3 billion by 2050 (UN, 2014). In addition, as the world’s population continue to
double and to increase, the urban scenarios such as urban growth, expansion, and
development also continue. Due to increasing population and visible urban
development which has been going on, land use change has become one of the
main concerns worldwide.
Land use and land cover change are the anthropogenic and natural changes
employed on the natural land (Meyer, 1995; Steffen et al., 2004). Moreover, there
are several studies about the land use and land cover change, as well as its
relationship from and its impacts in each sector. Some of the most well-known
1
studies related to land use change in line with increasing human population are
linked to climate change, urban heat islands (UHI), human health, pollution, and
more to mention. As mentioned in previous studies, urbanization is considered the
most significant driver of climate change (McCarthy et al., 2010) and it is an
example of human activity having influence on land use/land cover change which
worsen the enduring impacts on climate system (Jin et al., 2005). Also, a late study
in China shown that urbanization in line with an increasing urban-dwellers has
been slowly deteriorating their air quality (Xu et al., 2016). One study has also
shown that it has a massive impact on the variation of the spatiotemporal patterns
of UHIs (Zhang et al., 2013).
By such threats to and changes in earth system induced by humans along
with natural phenomena, the earth supporting systems such as environmental
resources, water sources and cycles, air quality, and other earth supporting systems
are all being affected by global changes. These changes on the earth system by
human-induced threats, in return, will have a direct and indirect consequences
towards back to the human being (Steffen et al., 2004). Furthermore, land use and
land cover change are both drivers, as well as the solution to these kinds of matter
(Turner et al., 2007). With such studies and evidences, these can straightforwardly
indicate that land use change is a big issue around the world that should not be
neglected and instead should be studied continually, be focused on and put our full
attention to.
Meanwhile, Vietnam has experienced rapid economic growth during 1980s
to 2000s which had caused uncontrolled and intensive urban expansion, especially
2
in Hanoi, the capital of Vietnam (Vuong, 2014). In 2015, Vietnam has been
reported to be rapidly urbanizing in terms of spatial and demography.
Correspondingly, urban areas in Vietnam have extended spatially at 2.8%
particularly in the western and the northern side of the existing urban area of Hanoi
(World Bank, 2015). In addition, rapid urbanization in Hanoi started after the Doi
Moi Policy or the economic reforms or renovation that was adopted in 1986 by the
CPV’s Sixth National Congress (JICA, 2007; Vuong, 2014). Since 1986 to
present-day, it is noticeable that Vietnam’s economy has progressed and has been
progressing. Moreover, within 1975 to 2015, Hanoi’s urban population has grown
from 1.4 million to 7.6 million people (GSO, 2014). In 2009, it was reported that
in the next 25 years, Vietnam’s urban-dwellers population will rise from one-third
to one-half having an average rate of 6% annually (Ministry of Construction,
2009).
Due to massive disturbance of the economic growth to the environment, the
Vietnam government officially implemented a proposed “Master plan of Hanoi
2030, Vision to 2050” in 2011 (VIAP, 2011), which goal is to transform Hanoi
into a smart city. The HMP goals include banning of Vietnam’s main
transportation, motorbikes, to combat pollution; upgrading network and railway
system; and installing several environmental monitoring stations. In order to
achieve the HMP goal, some area of Hanoi will undergo in another spatial
development which also means, the existing urban area will be expanded
(Trihamdani et al., 2017). About 28% of natural land is expected to be converted
3
into residential area to provide accommodation for a total of 9.2 million people by
the year 2030 (VIAP, 2011).
One of Hanoi’s districts, Nam Tu Liem, will be affected by the said Master
Plan, which once was one of Hanoi’s suburban areas that was announced to be an
urban area in 2013 (Hoang, 2015). By these happenings, Nam Tu Liem is expected
to be experiencing changes in land use. Furthermore, to examine if land use
changes certainly occurred in the district, land use change detection using
Geographic Information System (GIS) tool and a short land use change awareness
study were done.
1.2. Background of the Study Area
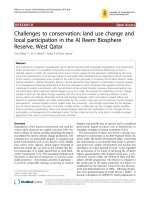
Nam Tu Liem is also called as the South Tu Liem which is located in the
west of the Hanoi central cities, its administrative boundaries are Thanh Xuan, and
Cau Giay Districts on the east, Hoai Duc District on the west, Ha Dong District on
the south, and Bac Tu Liem on the northern part (Figure 1.1). Nam Tu Liem is
established by the government in 2013 under the Resolution No. 132/NQ-CP
which states the adjustment of Tu Liem district into two new separate urban
districts: Nam Tu Liem District, and Bac Tu Liem District (Nhan Dan, 2013).
Tu Liem District was a rural area and it was then divided into two urban
districts. Tu Liem district covers a 7,562 hectares land with a population of
approximately 553,000. Bac Tu Liem, which is also called as the North Tu Liem
has an area of 4,335 hectares a with a population of nearly 320,000. The district
contains of 13 wards, including Thuong Cat, Lien Mac, Thuy Phuong, Minh Khai,
4
Tay Tuu, Dong Ngac, Duc Thang, Xuan Dinh, Xuan Tao, Co Nhue 1, Co Nhue 2,
Phuc Dien, and Phu Dien. On the other hand, Nam Tu Liem, which is also called
the South Tu Liem, has an area of approximately 3,200 hectares and has a
population of approximately 233,000 (HSO, 2017). The district comprises of ten
wards, including Trung Van, Dai Mo, Tay Mo, Me Tri, Phu Do, My Dinh 1, My
Dinh 2, Cau Dien, Phuong Canh, and Xuan Phuong (Nhan Dan, 2013). In this
study, Nam Tu Liem district will be the main study area, including the 10 wards
and local self-employed workers of the district.
In Ho Chi Minh, which is the economic center of Vietnam, has experienced
rapid development spatially (Kontgis et al., 2014), and Hanoi, likewise is also now
engaged with further spatial developments. Meanwhile, in accordance with the
Hanoi Master Plan to 2030 and Vision to 2050, Nam Tu Liem could be one of the
central cities in Hanoi. In previous years, a detailed construction planning of area
in Nam Tu Liem was announced in the public by The Hanoi Department of
Planning and Architecture. A total of 318,711 sq. m (31.87 ha) space for trees,
lake, public facilities, residential properties, and a commercial area was planned in
the area of Me Tri Ward. On the other hand, a total of 69,170 sq. m (6.92 ha) was
provided for the development of low-rise residential housing and garden houses.
Lastly, an approximately 19, 900 sq. m (1.99 ha) will be covered by the
development of commercial areas, which includes shopping malls, office, and
service spaces. These plans are expected to contribute for the Hanoi Master Plan
2030 and Vision to 2050 (Hoang, 2015).
5
Hanoi
Boundary
of
Vietnam
0
20
40
80 Km
Study Area:
Nam Tu Liem District
0
1.75
3.5
7 Km
0
200
400
800 Km
Figure 1.1 Location of the study area
1.3. Statement of the Problem
Hanoi will continue to develop in the next years and is expected to become
a smart city with accordance of Hanoi Master Plan 2030 and Vision to 2050. With
such spatial developments and plans in line with increasing population and urbandwellers, it is evident that land use changes have already occurred and will
continue to arise in Nam Tu Liem District. These changes in land use will bring
6
both positive and negative impacts to the economy, environment, and society of
Hanoi. According to Japan International Cooperation Agency or JICA (2007), this
intense urbanization is currently putting weight on the environment and society’s
health and lifestyle, knowing that the environment is degrading continually with
recurring environmental problems such as pollutions.
At the present time, people that are living in urban areas noticeably have
advantages that are not experienced by almost the people residing in rural area.
Besides, chances of employment and opportunities for business are frequently
bigger in urban than rural areas and this is one of the major reasons why people
move to and stay in the cities (Leon, 2008). Furthermore, workers and the society
are a significant part of the whole progression of the world, which is one of the
reasons why land use and land cover changes happen, in order to do good for the
standard of living of people, as well for the country’s economy. However, it
sometimes takes a negative effect in some environmental factors which affect other
sectors such as humans’ health, biodiversity, environment etc.
1.4. Research Objectives
The aims of the research are to focus on analyzing land use changes
detection in Nam Tu Liem District and have a short knowledge on workers,
particularly the self-employed workers’ awareness towards land use change within
the district. In order to achieve this aim, following objectives will be addressed.
1. To assess and analyze how the land use changes in Nam Tu Liem District
within 2007-2017
7
2. To know the extent of local worker’s awareness regarding land use changes
3. To form a vision of what the individual wants their community to become
in the succeeding years
4. To find solutions and mitigations for the occurring issues brought by land
use change
1.5. Research Questions
1. How does the land use of Nam Tu Liem District change overtime?
2. How does the land use in Nam Tu Liem change during 2007-2013, 20132017, and 2007-2017?
3. How aware the individual workers are towards land use change?
4. What are the feasible solutions or effective ways to minimize undesirable
consequences of land use change?
1.6. Research Rationale
The study provides information about land use change and the awareness
of self-employed workers in Nam Tu Liem District. This study is significant as it
could provide additional information for the future studies and observation in the
district. Also, the study could contribute to the socio-economic and environmental
impact assessments of the administrative projects in the succeeding years.
Moreover, this study could give a huge support for the implementation of policies
and strategies for the land use planning not only in Nam Tu Liem District, but also
for other areas of Hanoi and provinces of Vietnam.
8
1.7. Limitations
Some limitations were faced in this study as follow: i) The study only
focuses on the land use change in general and excludes the study about specific
area types such as residential, commercial, industrial, reservoir, etc. ii) Satellite
images used in the study are not acquired in the same date due to cloud cover
presence. iii) The only Landsat data that has gap filling applied on is the Landsat
7 ETM+ which could affect the image classification for the year 2013. iv) In
collection of land use change perception, language is the major barrier since not
all Vietnamese people know how to communicate with English. Also, some
articles and books are all in Vietnamese language which makes research a bit
challenging. v) Time will also be a barrier; therefore, a quota sampling method is
used in the study about awareness. vi) Quota sampling is a biased sampling. Thus,
many important information could be missed, as the main focus of the study is only
from the selected traits from the limited population. vii) A strategic analysis was
done in the study. It includes only the univariate and bivariate analysis, in which
does not include analysis of the relationship between variables, but only the major
purpose is to describe, to summarize, and to find patterns of the data. viii) The
result of this study will not generalize the perception of the whole population of
self-employed workers and individuals of Nam Tu Liem District.
9
1.8. Definitions and Concepts
Geographic Information System: a technology that is capable of storing, analyzing,
organizing, and managing data such as satellite or geographic data which
are then visualized into maps or 3D scenes.
Land Cover: the bio-physical or natural earth surface structures of the land such as
forests, water, vegetation, etc.
Land Use: the management of the natural and built-up lands which are used by
humans for agriculture, residential, recreational, government purposes,
and other economic activities.
Land Use Change: the conversion and modification of land surface regarding how
it is being used between different years.
Landsat: a satellite that is operated by the United States government organizations.
These satellites capture, gather, and transmit data about the earth’s
topography or certain phenomena which are used for constructing images
or maps. There are eight (8) satellites, and two (2) of those are still active
which are the Landsat 7 ETM+ and Landsat 8 OLI/TIRS.
Remote Sensing: the process of monitoring, investigating, and collecting data of
the earth’s physical traits or phenomenon by the use of satellite.
Self-employed workers: individuals who work for oneself and make a living from
it, which is also called a freelancer or a business owner.
Urbanization: refers to the continuous growth and development of an area which
is induced by and a result of population shift, specifically from rural to
urban.
10
PART II. LITERATURE REVIEW
2.1. Land Use Change
2.1.1. What is Land Use Change?
Land use and land cover changes are the extensive and rapid processes
which are primarily induced by and a product of natural and socio-economic
factors (Rawat & Kumar, 2015). These changes in land use and land cover could
consecutively affect the surroundings (Turner & Ruscher, 2004) and people
(Steffen et al., 2004; Turner et al., 2007). Moreover, land use and land cover are
two related but different terms in Remote Sensing (RS) which are interchangeably
used in various studies (Horning, 2004). Land cover refers to the bio-physical
features of the earth’s surface, specifically the classification of vegetation, water,
soil, and other land structures such as settlements. Whereas, land use refers to the
human ways of how the land is being used (FAO, 2000; Horning, 2004; Rawat &
Kumar, 2015). Additionally, Meyer (1995) described land cover as the natural
earth surface types, and land use as human-induced changes on and conversion of
the natural land surface.
Land use and land cover affect each other in a way around. Land use
distresses land cover, whereas land cover change may also affect the land use
(Riebsame et al., 1994). Land cover changes that are induced by changes of land
use may result negative impacts as it affects the surroundings, climate, and
biosphere through converged biogeochemical processes, as well as the
biodiversity, water quality, and land in general. Nevertheless, these changes in land
cover through land use do not certainly just result to land degradation, as human11
induced land use change is also considered as an improvement and enhancement
to the land which brings positive influences (Riebsame et al., 1994; Meyer, 1995).
2.1.2. Importance of Land Use Change
In order for each and every nation and businesses to make choices and
decisions, it is a requirement to have an essential knowledge about certain aspects
such as land use change (Anderson et al., 1976). Land use change is a significant
indicator to distinguish the human-environment relationships (Li et al., 2017). At
the present, it is such a big challenge for every country to uphold and improve the
economy and to conserve the environment and its resources at the same time
(Manandhar et al., 2009). Moreover, as Manandhar et al. (2009) stated,
understanding land use change is significant, especially for environmental
monitoring. Thus, the nearly irretrievable ecosystem and surroundings will be
avoided preferably. Such challenges are the whys and wherefores understanding
land use change and its impacts on urban environment (Li et al., 2017), also on the
local, regional, and global scales (Manandhar et al., 2009) is indeed significant. In
addition, Aspinall and Hill (2008) have mentioned how effective and helpful land
use change to natural resource management, particularly if reports are done over
time. He mentioned that timely land change report is a key to address the main
sustainability issues effectively.
Aspinall and Hill (2008) specified the different extent of reporting land use
changes: areal change, transformation, dynamics, and prediction. The areal change
basically means the loss and gain of a target land over time. On the other hand,
12
transformation is the pattern of conversion of one land to another. Moreover,
dynamics is the ratio of the transformations and its trends. Lastly, the prediction
which uses models to present change in land use and patterns in the future. Also,
to address main land use change drivers, and to implement effective land use
planning in the future.
Land use and land cover change information and prediction are significant
for the collection, preparation, and implementation of land use systems in order to
provide and meet the basic society needs for living and welfare. Correspondingly,
it is significant for understanding the influence of past and current policies, as well
as the existing drivers of land use change that might contribute in the future
researches (Rawat & Kumar, 2015; Tran, H. et al., 2015).
2.1.3. Land Use Change Detection using RS and GIS
Change detection is the procedure of detecting land and phenomenon
modification by using remote sensing data and by applying RS techniques and
methods (Anderson et al., 1976). Moreover, according to Anderson et al. (1976),
several studies and projects have already proven how effective RS and remote
sensor data bases are for studying change detection, particularly in land use and
land cover change mapping even in larger extent. Furthermore, by its real time data
acquisition, synoptic view, and repetitive reports, it could support the monitoring
of urbanization and other change detection studies (Belal & Moghanm, 2011;
Kontgis et al., 2014).
13
During 1940s, using aerial photographs in 1930s and 1940s, a land use map
for the entire United States was produced by Francis J. Marschner. He mapped
land use from aerial photographs mosaics and compiled it (Anderson et al., 1976).
In 1970s, more RS data, satellite data, and applications for the data were introduced
(Kontgis et al., 2014). Moreover, at the present day, with methods used in RS and
GIS, land use/cover changes (LUCC) mapping can be done at lower cost, lesser
time, and with greater accuracy (Kachhwala, 1985).
2.2. Land Use Change Factors, Impacts, and Mitigations
2.2.1. Major Factors of Land Use Change
According to Partoyo and Shrestha (2017), the land use change is
influenced by a combination of several factors which is comprised of biophysical,
social, economic, demographical, technological, and institutional factors. Several
factors will be tackled in the following sections.
a) Biophysical factors
The land use can be driven by biophysical factors but do not necessarily
driven by it directly. These biophysical factors can only drive changes in the land
cover which then affect the allocation of land use (Partoyo & Shrestha, 2017).
Moreover, there are several biophysical factors such as soil type, topography,
climate, and water quality and availability. The land use can be driven by soil type
and topography depending where the certain land and soil is suitable, whether if it
is for horticulture, pastoral, farming, agriculture, structures such as residential
constructions etc. Land use can also be driven by climate, water availability and
14
water quality which are mainly a factor for agriculture land use, as growing crops
and irrigation are involved. However, certain soil types which has a low potential
and some locations which are not suitable to be used for a certain land use type
necessitate additional inputs such as land preparation, fertilizer etc. for that land to
be used and suitable (Journeaux et al., 2017; Verburg et al., 2004). In addition,
some cases of changes in patterns of land use involves the irreparable lands such
as desertified land and forest land which are difficult to retrieve. Choices made for
these kinds of cases are sometimes conversion of such land into structures for it to
be beneficial (Verburg et al., 2004).
Moreover, Journeaux et al. (2017) stated phenomenon such as climate
change to be a future driver of land use change. However, Zondag and Borsboom
(2009) and Rutledge et al. (2011) stated that climate change would not necessarily
affect the land use directly; thus, it affects the biophysical factors which has an
influence towards the land use changes. The authors stated an example regarding
how the climate change affects the hydrological cycle, which changes the patterns
and distribution of water resources, as well as the water availability, infrastructure,
and planning. Moreover, they specified how climate change affects the mineral
production which could also have an impact on the agricultural production through
changes in nutrient cycling. In addition, the effects of climate change on
agricultural production varies through changes on temperatures, carbon dioxide
concentrations, periods of rainfall and drought, and natural events. The authors
determined that due to such events, it could have a negative effect on productivity
of farms which can lead to land use alteration and land abandonment.
15