Hiệu quả sử dụng gạo lật nảy mầm hỗ trợ kiểm soát các yếu tố thành phần hội chứng chuyển hóa trên bệnh nhân đái tháo đường typ 2 ngoại trú tt tiếng anh
Bạn đang xem bản rút gọn của tài liệu. Xem và tải ngay bản đầy đủ của tài liệu tại đây (311.77 KB, 23 trang )
INTRODUCTION
Metabolic syndrome refers to a group of disorders related to the process of metabolizing
substances including lipid metabolism disorder, abdominal fat, high blood pressure and blood glucose
(blood sugar) disorder. In patients with diabetes, blood glucose levels tend to be not properly
regulated; this would allow long-term carbohydrate disorders to result in lipid metabolism disorders,
high blood pressure, body fat accumulation and finally, metabolic syndrome. The appearance of
metabolic syndrome among type 2 diabetes patients worsens the severity of the disease and further
causes dangerous complications, especially to blood vessels and nerves.
In Vietnam, white rice the chief source of energy in people’s meals. Carbohydrate (a part of
Carbohydrate) constitutes quite a large percentage of the total energy (70%) in the meals. However,
after rice grain is milled, it loses 85% of its fat content, 15% of its protein content, 75% of its
phosphorus content, 90% of its calcium content, 75% of its vitamin Bs, iron, magnesium and
especially the fiber content that exist chiefly in its bran and germ layers. Germinated Brown Rice
(GBR) is made from rice grain that has only the husk milled away, thus keeping the bran and germ
layers intact. After removing the husk, the rice is then soaked in warm water until the sprouts grow
slightly. Subsequently, the rice is dried. The germination process of brown rice increases the amount
of biological chemicals located in rice bran that could help control blood glucose and blood lipid
levels.
In order to collect more scientific data on the current state of & risk factors contributing to the
prevalence of metabolic syndrome among type 2 diabetes, along with the effects of using Germinated
Brown Rice (GBR) in helping control the components of metabolic syndrome, we have conducted the
research with the two following objectives:
1. Determine the current state of & risk factors contributing to the prevalence of metabolic
syndrome among type 2 diabetes outpatients at Vu Thu General Hospital, Thai Binh Province were
facing in 2016.
2. Evaluate the effects of Germinated Brown Rice (GBR) in helping control the components
of metabolic syndrome among type 2 diabetic outpatients that have metabolic syndrome.
New contributions of the research
This research has provided additional important scientific data on the current state of & risk
factors contributing to the prevalence of metabolic syndrome among type 2 diabetes patients. This is
the first time ever the data on the current situation of metabolic syndrome along with its associated
risk factors in type 2 diabetes patients are publicized and, domestically, at the present, there are only
very few studies on these problems.
GBR - Germinated Brown Rice is the result of a scientific application in which husked brown
rice is germinated, thus increasing the amount of beneficial nutrients that could help control the
components of metabolic syndrome in type 2 diabetes patients located in its bran and germ layers.
This is the product that can completely replace white rice in daily consumption.
Structure of the thesis
The thesis consists of 134 pages, 36 tables, 10 pictures and 135 references including
documents from foreign sources. The introduction is 03 pages, overview 32 pages, subjects and
methods of research 21 pages, research results 31 pages, discussion 44 pages, conclusion 02 pages
and recommendation 01 page.
Chapter 1: OVERVIEW OF THE THESIS
1.1. Diagnostic criteria for metabolic syndrome
At the present, there are many criteria used to diagnose metabolic syndrome. Depending on the
opinion on pathogenesis and prevention mechanism, each organization provides different diagnostic
criteria. Firstly, the experts of WHO, based on Reaven’s concept, produced a new definition on
metabolic syndrome with specific diagnostic criteria. Afterwards, European Group for the Research of
Insulin Resistance (EGIR), National Cholesterol Education Program - Adult Treatment Panel-III
(NCEP-ATPIII) provided a definition for metabolic syndrome in 2001 and updated it in 2005,
International Diabetes Federation (IDF) also produced a definition for themselves. These sets of
criteria all agree that the main components of metabolic syndrome are glucose malabsorption, obesity,
high blood pressure and lipid metabolism disorders; however, each criteria set is different from the
other regarding the dominant risk factors and the threshold used to determine the components. The
criteria of WHO and EGIR both state that glucose malabsorption and insulin resistance as the major
risk factors. Conversely, the criteria set of NCEP does not include insulin resistance as a component in
their diagnosis.
In 2009, the common criteria formed from the criteria sets of all the aforementioned
organizations for diagnosing metabolic syndrome contained 03 among 05 components above
including: wider waist circumference, high triglycerides, low HDL-C, high blood pressure and high
blood glucose. Abdominal fat was not an essential criterion in diagnosing metabolic syndrome but it
was one among the five main criteria and was effective in initial screening.
1.2. The current state of metabolic syndrome among type 2 diabetes patients
Overall, the studies on metabolic syndrome among type 2 diabetes patients all over the World
and Vietnam are still quite limited and they all show that the prevalence of metabolic syndrome in
type 2 diabetes patients is high.
The research of S. H. Song shows that the prevalence of metabolic syndrome in type 2 diabetes
patients undergoing treatment at the hospital at the time, for both male and female, measured
according to the IDF criteria, was 91.7% and 94.8%, and according to the criteria of NCEP-ATPIII
was 87.6 and 94.2%, respectively. A research in Pakistan in 2012 shows that the prevalence of
metabolic syndrome in type 2 diabetes patients according to WHO criteria was 81.4%.
The research conducted by Le Thanh Duc at Vinh Long General Hospital illustrates that the
prevalence of metabolic syndrome in accordance with IDF criteria was 59%. Another research
conducted at Ho Chi Minh city in 2004 states that the prevalence of metabolic syndrome according to
NCEP-ATPIII’s criteria was 77.6%, according to NCEP-ATPIII’s criteria for Asian people was 86.0%,
according to WHO 1999’s criteria was 91.4% and according to WHO 1999’s criteria for Asian people
was 92.4%.
1.3. The risk factors contributing to the prevalence of metabolic syndrome
Physical activities: Physical activities are a very important factor in the process of energy
expenditure; physical activities enable the body to balance between then energy intake and the energy
consumed. On the other hand, physical activities also promote for beneficial energy conversion in the
body, thus reducing fat, promoting insulin sensitivity and reducing blood insulin.
Sex: Many researches have shown that the prevalence of metabolic syndrome among female
type 2 diabetes patients is higher than that of the male counterpart. This may be because it is more
likely for women to have abdominal fat and female hormones increase the likelihood of having the
components of metabolic syndrome.
Smoking and drinking: Many studies have shown that smoking and drinking alcohol or beer
could lead to high blood pressure, wider waist circumference and high triglycerides, as well as low
HDL-C and lowered insulin sensitivity or insulin resistance.
Frequency of consumption of a few types of food: Diet is one of the essential factors that
directly affects obesity, diabetes and metabolic syndrome. A surplus supply of energy from meals that
contain a large quantity of fat, sugar, of unreasonable portions, an imbalance between nutrients such
as lipid, carbohydrate, protein, amino acids… shall result in carbohydrate and lipid disorder.
1.4. The nutrition content in Germinated Brown Rice (GBR)
GBR is produced by soaking husked brown rice in water and let germinate. The germination
process would soften the rice when cooked as well as render it tastier than husked brown rice; in
addition, this also enriches the amount of active substances found in husked brown rice such as
Gamma-aminobutyric acid, acylated steryl glucosides, inositol hexaphosphate, ferulic acid, inositol, γoryzanol, tocopherols, tocotrienols, vitamins and minerals.
- The effects of GBR on controlling post-meal blood glucose and blood insulin levels in
healthy people were measured under two diets, one had the ratio of white rice/GBR being 2/1 and the
other 1/2; the blood sugar levels after 120 mins of the GBR-heavy diet was 54.4±5.1, statistically
lower than that of the white rice-heavy diet, which was 74.6±6.2 mg/dl, the blood sugar levels is in
reverse proportion with the ration of GBR/white rice.
- The effects of GBR on controlling blood glucose and blood lipid levels for people with blood
sugar disorder when hungry or with diabetes: According to a research on subjects with blood sugar
disorder when hungry or diagnosed with diabetes, after 6 weeks of intervention, the group that ate
GBR had blood sugar levels lowered compared to before eating GBR (135±7mg/dl and 153±9mg/dl,
respectively). The amount of total cholesterol and triglycerides of GBR eating subjects both
experienced statistically significant reduction.
- The effects of GBR on controlling blood glucose levels and weight for pre-diabetes women:
Bui Thi Nhung carried out a research on pre-diabetes women aged 45-65 using GBR as the
replacement for white rice continuously for 04 months. The results show that the post-intervention
blood glucose levels, HbA1c, triglycerides, HDL-C, LDL-C all experienced statistically significant
changes compared to pre-intervention. The figures related to biometry such as weight, BMI, body fat,
waist size, hip size, waist/hip ratio all underwent statistically significant changes as well.
- Tran Ngoc Minh conducted a research on the effects of GBR on controlling post-meal blood
glucose levels in type 2 diabetes patients. The intervention research results also illustrate that, after 16
weeks, GBR reduced blood glucose levels and helped regulate blood lipid levels compared to preintervention.
- Effects of GBR on patients with metabolic syndrome. A research in which GBR was used as
the intervention on metabolic syndrome patients aged 55-70 years old for 03 months continuously
shows that the blood glucose levels, insulin, HbA1c, cholesterol, triglycerides, LDL-C all went
through statistically significant reduction compared to pre-intervention. The prevalence of metabolic
syndrome was lowered from 100% down to 70% post-intervention.
Chapter 2: SUBJECTS AND METHODS OF RESEARCH
2.1. Subjects of the research
Pre-intervention phase: Outpatients diagnosed with type 2 diabetes being treated at Vu Thu
General Hospital at the time.
Intervention phase: Pre-intervention patients with metabolic syndrome, aged 45-65 years old at
the research location.
2.2. Research design
Cross-sectional study on the current state of & risk factors contributing to the prevalence of
metabolic syndrome among type 2 diabetes patients and a number of related factors.
Intervention study with a comparison group, compare and assess the before and after
intervention results
2.3. Research location: Vu Thu District, Thai Binh Province
2.4. Research time: Over 02 years, from 2016 to 2017.
2.5. Sample size and method of selecting sample
Sample size:
Sample size before intervention: All type 2 diabetes outpatients undergoing treatment at Vu
Thu General Hospital, Thai Binh province in 2016. As the result, the research group managed to select
846 subjects after screening all other unqualified patients.
Intervention subject size:
(σ12+σ22/κ) (Z1-α/2 +Z1-β)2
N1 = −−−−−−−−−−−−−−−
(μ1- μ2)2
The sample size was n = 43. The research group estimated that 15% of the subjects would quit
so the sample size needed to be 50 intervention subjects and 100 comparison subjects. In reality, the
research group managed to acquire 54 intervention subjects and 108 comparison subjects. However,
during the intervention process there were 02 subjects of the intervention group and 04 subjects of the
comparison group moved to another Province, therefore the data of 52 intervention subjects and 104
comparison subjects was ultimately assessed.
Subject selection for intervention phase:
- Step 1: Make a list of type 2 diabetes patients with metabolic syndrome
- Step 2: Select 54 patients, aged 45-65 that do not have any diabetes complication yet, and do
not have their treatment plan changed 06 months prior to the time of intervention. Remove patients
with acute disease, that are using insulin drugs and supplements that help control blood lipid disorders
and blood glucose disorders and are using husked brown rice/germinated brown rice at the time.
Select subjects for the comparison group: In order to ensure the similarity of the comparison
group, for each intervention subject, choose 02 comparison subjects based on criteria: same sex (both
are male or female), age gap does not exceed 05 years, HbA1c difference does not exceed 01%. Sex,
age, HbA1c are the most objective components that are not affected by other unwanted elements
during the intervention process.
2.6. Contents of the research
- Objective no. 01
To gather data on the current state of metabolic syndrome prevalence among type 2 diabetes
patients: Take biometric measurements, blood pressure, waist measurement, perform blood test to
determine whether a subject has metabolic syndrome.
To determine a number of related social elements: Interview the subjects on their economic
and social background, their own characteristics, characteristics of their lifestyle and diets to
determine the connections to metabolic syndrome prevalence among type 2 diabetes patients.
- Objective no. 02
Intervene by having the selected subjects eating GBR instead of white rice completely and
continuously for 16 weeks in a row. Monitor their meals, perform tests and analyze their 24-hour diets
for 03 days in a row and compare the results of pre and post intervention.
2.7. Techniques used in the research
Interview to gather information of the subjects such as age, sex, education, occupation,
lifestyle, physical activities, frequency of consuming certain types of food, take their biometric
measurements, waist measurement, perform blood test to gather data on glucose, triglycerides, HDLC, total cholesterol, LDL-C, HbA1c and interview them on their 24-hour diets.
Using Germinated Brown Rice (GBR): GBR used in the test was produced at Viet Nam
Biomedical Technology Joint Stock Company at no. 117 Thai Binh street, Nam Dinh city, Nam Dinh
province using Japanese technology. Rice grain was husked and still had its bran and germ layer
intact. Then the husked rice was soaked in warm water until sprouts grew. Subsequently, the rice was
dried and bagged. Each bag contained 01 kg of rice and was tightly sealed. The rice was tested for its
nutrition values, heavy metal content and underwent microbiological test at National Institute of
Nutrition.
The subjects were supplied with GBR each week and use it in every meal. In the process of
cooking the rice was not washed to avoid losing nutrients. The rice was cooked in a normal electric
cooker, the water content put in depended on the preference of each subject (whether that person
preferred eating drier or wet rice). It was required that each subject must eat GBR for the two main
meals of the day continuously for the duration of 16 weeks.
2.8. Methods of managing, processing and analyzing data
The data was entered into EpiData 3.1 software and was analyze on SPSS 16.0 software. The
statistic tests were used as single variable, multivariate logistic regression; Chi-squared test was used
to compare and establish the differences between the groups; independent t test and paired t test were
used to compare and establish the differences regarding the average values between the groups. The
differences were accepted when p<0.05. ARR (absolute risk reduction) and NNT (number needed to
treat - the number of patients we need to treat to prevent one additional bad outcome) were used to
assess the effectiveness of the intervention.
Chapter 3: RESEARCH RESULTS
3.1. The current state of, and a number of risk factors contributing to the prevalence of
metabolic syndrome among type 2 diabetes patients
Table 3.1. Common characteristics of the test subjects
Characteristics
Age group
< 45
45- 54
55-64
65-74
≥ 75
Occupation
Farmer
Retail. Homemaking
Officials, employees
Retired
Combined
Male
Number (%)
Female
Number
(%)
Combined
Number
(%)
16 (3.7)
79 (18.4)
155 (36.0)
131 (30.5)
49 (11.4)
17 (4.1)
66 (15.9)
156 (37.5)
138 (33.2)
39 (9.4)
33 (3.9)
145 (17.1)
311 (36.8)
269 (31.8)
88 (10.4)
196 (45.6)
21 (4.9)
19 (4.4)
194 (45.1)
430 (50.8)
231 (55.5)
49 (11.8)
10 (2.4)
126 (30.3)
416 (49.2)
427 (50.5)
70 (8.3)
29 (3.4)
320 (37.8)
846 (100)
p
0.683
0.001
The number of male and female subjects participating in the test were almost the same (ratio
50.8/49.2%). The largest age group was 55-64 (36.8%). Their current occupation was farming
(50.5%) and retirement (37.8%).
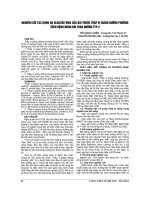
Figure 3.1. Prevalence of metabolic syndrome and its components
According to the chart, the prevalence of metabolic syndrome is 67.6%. High triglycerides is
the component that the subjects are most likely to have (62.3%), while wider waist circumference is
the least likely (36.3%).
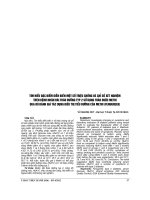
Figure 3.2. Prevalence of metabolic syndrome based on age group
We could see that the prevalence of metabolic syndrome has the tendency to increase with age.
It is at its lowest in under 45 years old group (30.3%) and at its highest in 65-74 years old group
(72.5%).
Table 3.2. Prevalence of metabolic syndrome and its components according to sex
Variables
Male
Number (%)
Female
Number (%)
Combined
Number (%)
p
243 (56.5)
329 (79.1)
572(67.6)
≤0.001
Wider waist
circumference
83 (19.3)
224 (53.8)
307(36.3)
High blood pressure
248 (57.7)
237 (57.0)
485(57.3)
0.836
High triglycerides
252 (58.6)
275 (66.1)
527(62.3)
0.024
Low HDL-C
147 (34.2)
182 (43.8)
329(38.9)
0.004
Have metabolic
syndrome
≤0.001
The prevalence of metabolic syndrome among female subjects was 79.1%, higher than among
the male counterpart (56.5%, p<0.001). The rate of having the components of metabolic syndrome
among female subjects was all higher than among the male subjects, with the differences being
statistically significant except for high blood pressure, in which case male subjects had the condition
than female subjects (57.7% compared to 57.3%), however the difference here was not statistically
significant.
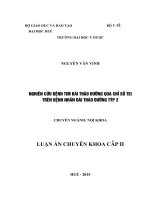
Figure 3.3. Rate of having metabolic syndrome’s components
The number of subjects that have 03 components is the highest (38.7%), while the number of
subjects that possess all 05 components is the lowest (5.7%).
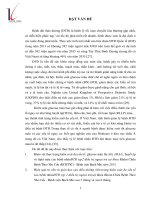
Figure 3.4. Percentage of combinations of the components among the subjects
(HA = High blood pressure, TG = High triglycerides, VE = Wider waist circumference,
HDL = Low HDL-C, Glu = High blood glucose)
As can be seen from the chart, the most common combination is high blood glucose – high
blood pressure – high triglycerides (17.8%). The least common combination is high blood glucose –
wider waist circumference – low HDL-C and high blood glucose – wider waist circumference – low
HDL-C – high triglycerides (both at 4.4%). The combination of all 05 components: high blood
glucose – high blood pressure – high triglycerides – wider waist circumference – low HDL-C
constitute 8.4%.
Table 3.3. Multivariate chart regarding the risk factors contributing to the prevalence of
metabolic syndrome
Individual risk factors
Male
Sex
Female
Age (years)
BMI
Normal
Overweight –
obese
Heavy
Work
Medium
intensity
Low
No
Smoking
Is smoking
Quit
Alcohol drinking
No
frequency
Yes
(>2 times/week)
Beer drinking
No
frequency
Yes
(>2 times/week)
Sugary food eating
No
frequency
Yes
(>2 times/week)
Animal organ eating No
frequency
Yes
(>2 times/week)
Fatty-meat eating
No
frequency
Yes
(>2 times/week)
Egg eating frequency
(0-3 meals per week)
Yes
Additional meal(s)
No
β
OR
1
20.1
1.04
1
95%CI
p
11.7 - 35.1
1.02 - 1.06
<0.001
<0.001
2.92
1.95 - 4.37
<0.001
1.22 - 4.23
1.66 - 5.47
0.009
<0.001
5.91 - 19.5
2.64 - 9.42
<0.001
<0.001
1.28 - 3.51
0.003
1.28 - 11.7
0.017
1.47 - 7.28
0.004
2.09 - 8.25
<0.001
1.71
1.18 - 2.48
0.004
-0.218 0.81
0.69 - 0.94
0.005
1
1.44
0.97 - 2.13
0.097
3.010
0.035
1.072
0.821
1.102
2.374
1.607
0.751
1
2.27
3.01
1
10.7
4.99
1
2.12
1
1.356
3.88
1
1.184
3.27
1
1.424
4.15
1
0.539
0.362
The risk factors of having metabolic syndrome consisted of old age, female sex,
overweightness – obesity, lifestyle (beer & alcohol drinking, smoking, low intensity work), the
consumption of sugary food, animal organs, fatty meat; meanwhile, eating egg (from 01-03
meals/week) could reduce the chance of having metabolic syndrome.
3.2.2. Effects of intervention in helping control the components of metabolic syndrome
Table 3.4. Comparison between the rate of reduction in the prevalence of metabolic
syndrome and its components in both groups post-intervention
Categories
Metabolic
syndrome
Triglycerides
Yes
no
High
Intervention group
Comparison group
Number
Ratio %
Number
Ratio %
43
9
33
82.7
17.3
80.5
92
12
74
88.5
11.5
96.1
p*
0.320
HDL-C
Blood pressure
Waist
circumference
Normal
8
19.5
3
3.9
Low
Normal
Increased
Normal
High
Normal
18
13
23
6
23
4
58.1
41.9
79.3
20.7
85.2
14.8
50
12
59
2
55
3
80.6
19.4
96.7
3.3
94.8
5.2
0.015
0.021
0.012
0.201
Intervention reduced the rate of having metabolic syndrome, high triglycerides, low HDL-C,
high blood pressure and wider waist circumference by 17.3; 19.5; 41.9; 20.7 and 14.8%, respectively.
The difference between pre and post intervention was statistically significant for triglycerides, HDL-C
and blood pressure.
Table 3.5. Comparison between the rates of metabolic syndrome’s component prevalence
reduction in both groups, post-intervention
Categories
Intervention group
Comparison group
Number
Ratio %
Number
Ratio %
Total
number
of
components
of
metabolic syndrome
161
89.4
354
97.8
Number of components
reduced
19
p
<0.001
ARR% (95%CI)
NTT
10.6
8
2,2
8.35 (3.61%. 13.08)
12.0
The results show that, post-intervention, intervention group managed to reduce 19 components
(10.6%), more than comparison group (8 components). The difference here was statistically
significant.
Table 3.6. Effects of the intervention on metabolic syndrome’s component prevalence
reduction
Categories
Average number of metabolic
syndrome’s components the
subjects were afflicted with
(Week0)
Average number of metabolic
syndrome’s components the
subjects were afflicted with
(Week16)
Average number of metabolic
syndrome’s components the
subjects were afflicted with
p2
Intervention group
X ± SD
Comparison group
X ± SD
p1
3.46 ± 0.61
3.48 ± 0.70
0.868
3.10 ± 0.72
3.40 ± 0.84
0.026
0.37 ±0.60
0.08±0.53
0.030
<0.001
0.052
The intervention decreased the average number of metabolic syndrome’s components the
subjects were afflicted with among the intervention group by 0.37 ±0.60, the decrease was higher than
that of the comparison group (p<0.05).
Table 3.7. Effects of the intervention on glucose and HbA1c reduction
Categories
Glucose
( X ± SD)
HbA1c
( X ± SD)
T0
T16
p2
T0
T16
p2
Intervention group
(n = 52)
Comparison group
(n = 104)
9.65±2.66
8.06±2.58
<0.001
7.59±1.47
7.04±1.25
<0.001
9.52±2.08
9.23±1.63
0.062
7.56±1.14
7.52±1.06
0.356
p1
0.734
0.001
0.897
0.013
Both blood glucose levels and HbA1c experienced statistically significant reduction.
Figure 3.5. Blood glucose and HbA1c reduction
The intervention lowers the blood glucose levels and the percentage of HbA1c among
intervention group by 1.59 mmol/L and 0.55%, respectively. Meanwhile, the intervention group has
their blood glucose levels and HbA1c lowered by 1.29 mmol/L and 0.51% (p<0.001), more than those
of comparison group.
Table 3.8. Effects of the intervention on the average values of triglycerides, HDL-C, waist
circumference and blood pressure
Categories
Triglycerides
( X ± SD)
HDL-C
( X ± SD)
Waist
T0
T16
p2
T0
T16
p2
T0
Intervention group
(n = 52)
3.01±1.61
2.21±0.78
0.001
1.18 ± 0.28
1.41 ± 0.34
<0.001
82.3 ± 9.0
Comparison group
(n = 104)
2.96±1.93
2.86±1.71
0.309
1.14 ± 0.29
1.17 ± 0.25
0.211
82.4 ± 7.3
p1
0.857
0.010
0.360
<0.001
0.973
circumference
( X ± SD)
Highest blood
pressure level
( X ± SD)
Lowest blood
pressure level
( X ± SD)
T16
p2
80.3 ± 8.3
<0.001
82.1 ± 7.3
0.085
0.167
T0
T16
p2
128.6 ± 18.0
123.5 ± 16.0
0.031
128.1 ± 19.5
127.9 ± 16.5
0.787
0.889
0.120
T0
T16
p2
76.7 ± 9.6
74.2 ± 9.2
0.117
76.5 ± 11.5
75.8 ± 10.1
0.277
0.897
0.359
The intervention lowered triglyceride levels, increased HDL-C level, decreased the average
waist circumference and the average highest blood pressure level and the lowest blood pressure level
post-intervention compared to pre-intervention. We could see from the table that the differences were
statistically significant for triglycerides, HDL-C, waist circumference and highest blood pressure
level.
Chapter 4: DISCUSSION
4.1. The current state of & risk factors contributing to the prevalence of metabolic
syndrome among type 2 diabetes patients
4.1.1. The current state of & risk factors contributing to the prevalence of metabolic
syndrome among type 2 diabetes patients
The prevalence of metabolic syndrome among type 2 diabetes patients has been dissimilar
between researches implemented in different regions of the World; and it also depends on which
metabolic syndrome diagnostic criteria was being used at the time of conducting each research.
However, there is one common point being that the likelihood of having metabolic syndrome among
type 2 diabetes patients is very high. The research results show that the rate of having metabolic
syndrome was 67.6%. S.H. Song’s research in 2008 illustrated that, according to IDF criteria, the rate
of having metabolic syndrome was 93.1%, and according to NCEP-ATPIII criteria, was 90.5%. In the
research carried out at Pakistan in 2012, the prevalence of metabolic syndrome among type 2 diabetes
patients, was 81.4% based on WHO criteria, 86.7% according to IDF criteria, and 91.9% according to
NCEP-ATPIII. Le Thanh Duc’s research on 362 type 2 diabetes patients undergoing treatment at Vinh
Long General Hospital in 2008-2009 share similar subject characteristics with our research, such as
the average number of years having the condition being 5.4±4.54, the most dominant age group being
60 (57.9±11). The results stated that, the rate of having metabolic syndrome according to IDF criteria
was 59%, according to NCEP-ATPIII was 88.4%.
In our research, besides high blood glucose (blood sugar) levels, high triglycerides was the
most common metabolic syndrome’s component (62.3%) that the subjects had, followed by high
blood pressure (57.3%), then low HDL-C (38.9%) and finally wider waist circumference (36.3%).
According to Le Thanh Duc’s research, in addition to high blood glucose, the most prevalent
metabolic syndrome’s component among the test subjects was high triglycerides (87.1%), after that
was high blood pressure (67.8%), wider waist circumference (65%) and low HDL-C (64.7%). Nguyen
Thanh Cong’s research in 2003-2004 also showed that the prevalence of metabolic syndrome in type 2
diabetes patients was very high, being 86.0% based on NCEP-ATPIII criteria for Asian people, higher
in female than male, with the age group of 70-79 being the most dominant, and the most common
disorders were obesity and high blood pressure, the higher the BMI, the higher the possibility of
having metabolic syndrome.
Most of the results, from both foreign and domestic sources have shown us that the rate of
having metabolic syndrome in type 2 diabetes patients was higher among females and increased along
with age. Our research shows that the rate of having metabolic syndrome among female patients was
79.1%, higher than that of their male counterpart (56.5%, p<0.001). The rate of having metabolic
syndrome in type 2 diabetes patients that we measured increased with age; it was lowest at under 45
years old group with 30.3%; for the 45-54 age group, the rate was 56.6%; for 55-64 age group the rate
was 72.3%; the highest rate was seen in 65-74 group at 72.5%; and lastly, the above 75 age group had
the rate of 68.2%. Moreover, at each age group, female subjects had higher chance of having the
syndrome than male subjects. The researches of S. H. Song and C.A. Hardisty also show that,
according to IDF criteria, the percentage of having metabolic syndrome of type 2 diabetes female
patients was higher than that of the male patients (94.8% compared to 91.7%, respectively), and
according to NCEP-ATPIII criteria, the figures were 94.2% and 87.6%, respectively. Also, the
likelihood of having metabolic syndrome also increased with age; it was lowest at the under 40 years
old age group (71.4%) and highest at 60-70 years old age group (95%). In our research, among the
components of diagnostic criteria for metabolic syndrome in type 2 diabetes patients, we notice that
the majority of the tested patients had a combination of 03 components (38.7%), followed by 02
components (24.9%), and 04 components (23.3%), the groups of patients with 01 and 05 components
of metabolic syndrome constituted a small minority with 7.4% and 5.7%, respectively. Therefore,
without any measure to properly manage and treat their condition, the 24.9% of type 2 diabetes
patients with 02 components of metabolic syndrome could acquire at least 01 more in near future and
thus increases the chance of getting metabolic syndrome.
Among the subjects with metabolic syndrome, the combinations of components of metabolic
syndrome had different degree of prevalence. The most common combination was high blood glucose
– high blood pressure – high triglycerides (17.8%), followed by high blood glucose – wider waist
circumference – high blood pressure – high triglycerides (13.6%), the least common combination was
high blood glucose – wider waist circumference – low HDL-C – high triglycerides and high blood
glucose – wider waist circumference – low HDL-C with 4.4% each. In addition, the research results of
Le Thanh Duc show us that the combination of high blood glucose – wider waist circumference –
high triglycerides – high blood pressure was also the second most common (21.0%). Therefore, it can
be seen that among type 2 diabetes patients with metabolic syndrome, high blood pressure and high
triglycerides were the most prevalent components. As the result, during the process of monitoring and
treating patients, the clinical doctors must pay attention to these two measurements in type 2 diabetes
patients in order to be able to devise a proper intervention method in a timely manner. The common
combinations that contain high blood pressure and high triglycerides among type 2 diabetes patients
with metabolic syndrome could add to the proofs that explain the increasing risk of heart disease due
to metabolic syndrome in said patients.
4.1.2. Risk factors contributing to having metabolic syndrome in type 2 diabetes patients
In this research, the research group commenced one-variable analysis between risk factors
contributing to having metabolic syndrome and certain socio-economic elements, characteristics of
patients, characteristics of their lifestyle, diet… Then, from there, the research group used statistic
algorithms to determine the risk factors, the level of the risk factors via multivariate logistic
regression model.
The variables in the one-variable analysis were entered into multivariate logistic regression
analysis using Backward Elimination (Conditional), in which the irrelevant variables with statistical
significance p = 0.10 were removed. In the multivariate analysis model, the research group found that
the factors that raised the chance of having metabolic syndrome consisted of female sex, increasing
age, overweightness and obesity, the low intensity of their works, smoking; in addition, drinking beer
and alcohol, eating sugary food, frequency of eating animal organs, fatty meat over 02 times per week
also increased said chance. Not eating additional meal has the tendency to increase, while eating eggs
from 01 to 03 times per week could lower the likelihood of having metabolic syndrome.
Regarding sex, most of domestic and foreign researches show that females have higher chance
of having metabolic syndrome than males. A possible explanation for this difference is that the female
hormones increases the subcutaneous fat, especially the abdominal subcutaneous fat, thus increases
the waist circumference; moreover, the diagnostic value (cross section) of waist circumference, HDLC of females are wider. Regarding waist circumference, it is ≥ 80 cm for females whereas it is ≥ 90
cm for males to be regarded as “wider waist circumference”. Regarding HDL-C, it must be <1.3
mmol/L in females whereas it must be < 1.0 mmol/L in males to be diagnosed as “low HDL-C”.
Therefore, it is easier for females to satisfy the waist and HDL-C criteria than males. And as a result,
within the same population, the rate of having metabolic syndrome of females is higher than males.
For the age risk factor, as the age of the patient increases, so does the risk of having metabolic
syndrome. According to research results, each year increased the likelihood of having metabolic
syndrome by 1.04 times (95%CI: 1.02-1.06). The higher the age, the longer the amount of time a
patient has diabetes becomes, the metabolism disorders as a result tends to be worse. Moreover, the
older the patient, the higher the likelihood that said patient has combined diseases; also, the
appearance of free radicals furthers the aging process, coupled with lipid & carbohydrate metabolism
disorders would also increase the chance of having metabolic syndrome as well.
In assessment on the probability of having metabolic syndrome in type 2 diabetes patients with
the nutrition condition based on BMI, the result shows that overweightness and obesity increased the
odds of having metabolic syndrome by up to 2.92 times (95%CI: 1.95-4.37) compared to the normal
group (p<0.001).
In a quieter work environment where there are few physical activities, which means there is
less energy consumed, then the likeness of having metabolic syndrome increases. According to the
results of this research, with medium intensity works, the risk of metabolic syndrome was increased
by 2.27 times (95%CI: 1.22-4.23) and with low intensity works, the risk of metabolic syndrome was
increased by 3.01 times (95%CI: 1.66-5.47) compared to the group with high intensity works.
Regarding the relation between smoking, beer & alcohol intake, the research results show that
the subjects currently were smoking was 1.83 times more likely to have metabolic syndrome (95%CI:
1.26-2.68), while the subjects who quit smoking was 1.21 times more likely to have metabolic
syndrome (95%CI: 0.79-1.84). Drinking alcohol more than 02 times/week raised the chance of having
metabolic syndrome by 2.12 times among the subjects compared to the subjects that didn’t drink; this
result was similar in drinking beer, with the rate of having metabolic syndrome being 3.88 times
higher than that of those who didn’t drink.
In our research, we focused on a few types of food readily available in the region to examine
the frequency of consumption in relation to the likelihood of having metabolic syndrome. Through the
multivariate analysis model, we can see that eating sugary food, animal organs, fatty meat more than
02 times per week all increased the likelihood of having metabolic syndrome by 3.27, 4.15, 1.71
times, respectively, and that the differences were statistically significant. Eating egg from 01 to 03
meals per week was the only element that reduced the probability of having metabolic syndrome with
OR = 0.81, 95%CI: 0.69-0.94 (p=0.004). We still couldn’t tell how and if eating ≥ 4 meals of eggs per
week could affect the chance of having metabolic syndrome in type 2 diabetes patients. We need more
cohort studies to evaluate the effects of eggs on the likelihood of having metabolic syndrome in
Vietnamese people.
4.2. Effects of using germinated brown rice (GBR) as intervention
4.2.1. Effects of the intervention in helping control the components of metabolic syndrome
The intervention decreased the prevalence of metabolic syndrome among intervention group
by 17.3%, higher than the comparison group (11.5%). However, the effectiveness and contribution of
the intervention to absolute risk reduction was not statistically significant. It could be because the
duration of the intervention using GBR was still short (16 weeks), and the fact that the intervention
was carried out on patients with long-term lipid and carbohydrate metabolism disorders could also
have affected the results. Therefore, we need to have a longer-term research as well as tighter research
design in order to be able to produce convincing evidence on the effects of GBR in lowering the
chance of having metabolic syndrome in type 2 diabetes patients. In addition, the intervention also
lowered the total number of metabolic syndrome’s components by 10.6% and decreased its average
number by 0.37 ±0.60, the difference here was statistically significant (p<0.05). Plus, the research
results of Nguyen Thi Cham show that after 03 months of intervention using GBR, the rate of having
metabolic syndrome decreased from 100% to 70%.
4.2.2. Effects of the intervention in helping control the blood glucose and HbA1c
After 16 weeks of continuously consuming GBR, there was a clear reduction in blood sugar:
Among the intervention group, the average value of blood glucose decreased from 9.65±2.66 mmol/L
pre-intervention to 8.06±2.58 mmol/L post-intervention and HbA1c decreased from 7.59±1.53
mmol/L pre-intervention to 7.04±1.25 mmol/L post-intervention. The differences here were
statistically significant with p<0.001. Meanwhile, in the comparison group, there was no difference
regarding blood glucose pre and post intervention. The blood glucose reduction of the intervention
group was 1.59 mmol/L, higher than that of comparison group (0.30 mmol/L), the difference here was
statistically significant with p<0.001.
HbA1c is the measurement that states the average amount of blood glucose accumulated in 812 weeks and it is rarely affected by the amount of carbohydrate in the food portion of the meals at the
time of test. Therefore, HbA1c is the most objective way to assess how effective the intervention was
in reducing blood glucose. As a result, this research was designed to last 16 weeks (longer than
HbA1c’s cycle which is 8 – 12 weeks) to ensure that HbA1c measurement acquired reflected the
effects of the intervention. Our research results show that the average percentage of HbA1c in
intervention group decreased from 7.59±1.53 down to 7.04±1.25, absolutely decreased the rate of
failing to meet the goal of controlling HbA1c by 17.8% and there was one in every 06 patients that
could control his/her HbA1c. The difference between the two groups was statistically significant with
p<0.001.
The researches on the effects of GBR as when used as the intervention on type 2 diabetes
patients, type 2 diabetes patients with metabolic syndrome, on pre-diabetes group, on people with
metabolic syndrome all produce the results in which blood glucose levels and HbA1c were lower
post-intervention in a statistically significant manner. Meanwhile, there was no change in terms of
blood glucose levels and HbA1c among comparison group.
4.2.3. Effects of the intervention in helping control the blood lipid levels
Using GBR as the intervention bettered blood lipid disorders. Among the intervention group,
the average levels of triglycerides decreased from 3.01±1.61 mmol/L down to 2.21±0.78 mmol/L;
LDL-C levels decreased from 3.21 ± 0.75 mmol/L down to 2.93 ± 0.55 mmol/L; cholesterol levels
were lowered from 5.68±1.10 mmol/L down to 5.24±0.89 mmol/L; HDL-C levels increased from .18
± 0.26 mmol/L to 1.47 ± 0.32 mmol/L. Effects of the intervention on ARR% for triglycerides, LDL-C,
cholesterol and HDL-C levels were 15.6; 9.3; 18.9 and 22.6 %, respectively. To specify, the
differences between post-intervention and pre-intervention were statistically significant for
triglycerides, cholesterol and HDL-C levels. Furthermore, the intervention also managed to provide
statistically significant reductions to triglycerides, cholesterol and LDL-C levels (0.81; 0.28; 0.43
mmol/L) and statistically significant increase to HDL-C levels (0.28 mmol/L) post-intervention.
These four measurements of the post-intervention group were all higher than those of the comparison
group, which were 0.09; 0.07; 0.10 and 0.03 mmol/L; the differences were all statistically significant.
The research results provided by Bui Thi Nhung on pre-diabetes subjects also shows that using
GBR as intervention also decreased blood lipid disorders, lowered triglyceride levels, LDL-C,
cholesterol and increased HDL-C post-intervention compared to pre-intervention. The differences
were statistically significant, except for cholesterol. In Nguyen Thi Cham’s research on GBR as the
intervention for metabolic syndrome patients, the intervention also lowered triglyceride, LDL-C,
cholesterol levels while boosting HDL-C. Another research of Shanshan Geng on using GBR as the
intervention on people aged 40-70 with blood lipid disorder also reveals that, after 12 weeks, the
measurements of total cholesterol, triglycerides and LDL-C were all lowered while HDL-C was
raised, the differences were statistically significant.
4.2.4. Effect of the intervention in helping control the wider waist circumference and blood
pressure
As can be seen from the results, GBR decreased the average waist circumference of
intervention subjects from 82.3 ± 9.0 cm down to 80.3 ± 8.3 cm; the difference was statistically
significant with p<0.001. Our result is similar to Bui Thi Nhung’s research on pre-diabetes subjects,
and it shows that the average waist circumference post-intervention was 78.5±7.6 cm, lower
compared to pre-intervention (85.1±7.4 cm p<0.001). In addition, our result is also similar to Tran
Ngoc Minh’s research on type 2 diabetes patients, in which the waist circumference of postintervention subjects also decreased (p<0.05).
The intervention lowered the average value of highest blood pressure levels from 128.6± 18.0
down to 123.5± 16.0 mmHg (p<0.05), lowered the average value of lowest blood pressure levels from
76.7±9.6 down to 74.2 ± 9.2 mmHg (p>0.05). The results of our research are similar to the results of
Tran Ngoc Minh’s research on type 2 diabetes patients, in which the highest blood pressure level
experienced a statistically significant reduction while the lowest blood pressure level did not
experience a statistically significant reduction. In Bui Thi Nhung’s research on pre-diabetes subjects,
using GBR as the intervention lowered the average values of both highest & lowest blood pressure
levels in a statistically significant manner. The difference here could come from the fact that the
subjects that Bui Thi Nhung studied had just been afflicted with diabetes recently, therefore their
carbohydrate metabolism disorders and lipid metabolism disorders were not severe, thus enabling
them to respond well to the intervention.
4.3. The advantages and the novelty of this research
This research has provided important additional scientific data on the current state of the
prevalence of metabolic syndrome among type 2 diabetes patients and has presented the risk factors
contributing to having metabolic syndrome in type 2 diabetes patients such as lifestyle, frequency of
exercise, nutrition… This is the first time that the data on the state of the prevalence of metabolic
syndrome and its components in type 2 diabetes patients is published in Thai Binh province. And,
domestically, there are still only very few researches on this subject.
Germinated brown rice (GBR) still retains its bran and germ layers, while the germination
process enhances the beneficial nutrients in rice sprouts and softens the rice itself, making it easier to
eat. The intervention research results show us the positive effects that GBR has on managing the
metabolic syndrome’s components among type 2 diabetes patients with metabolic syndrome.
Furthermore, this is a product that can completely replace white rice.
CONCLUSION
1. The current state of & risk factors contributing to the prevalence of metabolic
syndrome among type 2 diabetes outpatients at Vu Thu General Hospital
The rate of having metabolic syndrome of type 2 diabetes patients was high (67.6%) and the
higher the age, the higher the rate (p<0.01).
Females had higher chance of having metabolic syndrome (79.1%) than males (56.5%),
p<0.001. Among the components of metabolic syndrome, the most common component found among
the patients was high triglycerides (62.3%), followed by high blood pressure (57.3%); the third most
common component was low HDL-C (38.9%), and wider waist circumference was the least common
of all (36.3%).
The likelihood of having metabolic syndrome depends on factors such as old age, female sex,
overweightness-obesity, lifestyle (alcohol & beer intake, low intensity work), especially the factors
related to eating and drinking such as eating sugary food, animal organs, fatty meat. The research
initially shows that eating eggs (from 01-03 meals per week) could lower the chance of having
metabolic syndrome.
2. Effects of using GBR on helping control metabolic syndrome in type 2 diabetes patients
- Using GBR as replacement for white rice continuously for 16 weeks could help control the
components of metabolic syndrome. We see a higher reduction of 5.8% on the rate of metabolic
syndrome in intervention group compared to comparison group (17.3% and 11.5% respectively). The
intervention resulted in decreases in high triglycerides, low HDL-C, wider waist circumference, high
blood pressure of 19.5; 41.9; 20.7 and 14.8%, respectively; to specify, these decreases were
statistically higher than those of comparison group (p<0.05).
- Assessing the effectiveness of the intervention via NNT (number needed to treat - number of
patients you need to treat to prevent one additional bad outcome): with metabolic syndrome, NNT ≈
12; with high triglycerides, NNT ≈ 06; with low HDL-C, NNT ≈ 04; with wider waist circumference,
NNT ≈ 10 and with high blood pressure, NNT ≈ 06; the differences were statistically significant in
the cases of triglycerides, HDL-C and high blood pressure.
- Using GBR for 16 weeks reduced the average number of metabolic syndrome’s components
the subjects were afflicted with: The average decrease of intervention group was 0.37 ±0.60, more
than that of comparison group (0.08±0.53). The difference here was statistically significant (p<0.05).
RECOMMENDATIONS
1. Germinated brown rice could help control blood glucose levels and the components of
metabolic syndrome among type 2 diabetes patients. Therefore, we need to have multimedia means to
inform type 2 diabetes patients on using germinated brown rice as the replacement for white rice in
order to prevent and control the components of metabolic syndrome and the complications of
diabetes.
2. The research results have opened up a research direction on the nutritional values of
germinated grains as well as products manufactured from germinated brown rice in order to diversify
the foods that help control blood glucose and metabolic syndrome’s components among patients with
carbohydrate and lipid metabolism disorders.