Summary Doctoral thesis: Diversifying investment portfolios on Vietnam''s stock market
Bạn đang xem bản rút gọn của tài liệu. Xem và tải ngay bản đầy đủ của tài liệu tại đây (794.41 KB, 21 trang )
the process of selecting and implementing diversification methods is
INTRODUCTION
imminent. On the other hand, through screening and checking market
1. The urge of dissertation topic
activities regarding the diversification of investment portfolios, pointing out
After more than 15 years of evolving and developing, the Vietnam
all the pros and cons, challenges and opportunities which affect diversification
stock market has marked significant changes in market size and sophistication
activities in Vietnam stock market in both direct and indirect manners is
as one of the fastest growing markets amongst the frontier markets and
highly necessary; that will contribute much to the efficient use of capital
emerging markets. The strong, solid growth in the size of Vietnam stock
resource, help lessen the risks associated with investment activity and promote
market has played the key factor in the sustainability of the capital market, as
higher level of efficiency for both investors and the whole market, thus lead to
a channel for mid- and long-term investments
sustainable economic growth. Being able to systemize from the summaries of
all research work done in financial management, capital resource allocation,
During the 2000-2005 period, Vietnam stock market capitalization
and investment diversification play the key role in developing and perfecting
only accounts for approximately one percent of the nation’s GDP. This
further studies in this expertise in Vietnam.
measure, however, soared to account for 22,7% of GDP in 2006 and again to
43% of GDP in 2007. Total stock market capitalization reached 1,64 trillion
2. Overview of Foreign Studies
VND ($72 bondion) in year 2016, an increase of 345.000 bondion VND
2.1. Foreign Studies
(26,6%) or $15 bondion compared to the end of 2015. Despite the overall
Portfolio diversification theory has been the subject of theoretical and
incredible steps forward of the market, several problems remains with market
empirical studies all around the world in many variations; the results,
volatility and limited liquidity, especially during correction or recession
however, vary depending on the nation and time period in which the study is
periods. Moreover, products listed on the stock market are limited in
conducted. For example, Lee, Fah and Chong (2016) used CAPM model as
variations and of low quality, therefore incapable of meeting the desire of
well as the Markowitz’s Modern Portfolio Theory to examine the level of
investors to diversify their investment portfolios and to hedge for any
efficiency of portfolio diversification in Malaysia; Verchenko (2000) applied
investment risks (due to lack of derivative products). Other market add-on
simple correlation and co-integration analyses to measure the correlation of
services are also limited (such as lack of short-selling orders, margin
stocks in 10 European emerging markets: Ukraine, Lithuania, Estonia, Latvia,
borrowing, forward sales…); the level of market transparency has not met
Poland, Hungary, Slovenia, Russia and Czech Republic; Zaimovic, Berio và
public investors’ requirements.
Mustafic (2017) applied Markowitz’s Modern Portfolio Theory and PCA
In a fast growing yet highly volatile market, the need for a systemic
technique to examine the interest and level of efficiency of portfolio
market rationale for market management (securities companies, funds
diversification in emerging markets of South East Europe; Zhou (2010)
management companies, mutual funds…), along with experiences gained in
examined the level of portfolio diversification from the perspectives of the
1
Chinese investors; Hallinan (2011) applied Markowitz’s Portfolio Selection
Kim Lanh (2011) applied Markowitz’s theory to calculate overall expected
(1952) and the summary of the Modern Portfolio Theory in order to construct
returns and investment risk on the Vietnam stock market, thus weighed the
six different portfolios (containing stocks of emerging markets); Porwal
appropriate capital resource contribution for the investment portfolio. Ngo
(2014) applied Markowitz’s Portfolio Theory (1952) to study the
Dang Hoang (2013) applied the Modern Portfolio Theory to construct an
characteristics of the frontier markets in comparison to emerging markets to
efficient investment portfolio on the Vietnam stock market. Le Quy (2013)
maximize outcome of investors’ portfolio diversification; Randolph (2011)
combined Markowitz’s theory and top-down stock analysis method to
applied Markowitz’s Modern Portfolio Theory (1952) to examine the portfolio
construct an efficient investment portfolio for personal investors. Hoang
diversification of Africa’s frontier stock markets; Hearn and Piesse (2008)
Thanh Duong (2005) applied Markowitz’s Modern Portfolio Theory to test for
applied three different models, such as non-normal distribution model,
the efficient frontier, optimal investment portfolio, and the market curve from
GARCH model, and CAPM model to analyze the possibility of maximal
04/20/2004 – 02/23/2005. Vo Thai Phong (2011) applied Markowitz’s
portfolio diversification by combining South Africa’s stock market (the
Modern Portfolio Theory to construct an efficient investment portfolio with
strongest nation in the SADC community) and such in Swaziland, Namibia
listed stocks on HOSE using data observations from 2004 to 2011. Tran Van
and Mozambique (smaller nations in the SADC community) in the period of
Tri (2015) applied th CAPM model and Markowitz’s Modern Portfolio
1992-2007; Gupta, Jithendranathan and Sukumaran (2005) applied the
Theory to test for the construction and management of the investment
GARCH model to construct an optimal diversified investment portfolio for
portfolio using data from HOSE and HNX from 2008-2013. Truong Dong
Australian investors to examine the benefits of investing in African frontier
Loc and Tran Thi Hanh Phuc (2012) examined the interest-risk relationship of
market; diversification when an investor from an ASEAN country only
the listed stocks on HOSE based on CAPM model using HOSE index data
invested in a country’s index fund or isolated stocks; Baig, Bilal and Asiam
and prices of 80 listed stocks from 01/02/207 to 12/31/2009…
(2016) examined the correlation among different stocks in such emerging
2.3. The Gaps in Research Topic
markets as India (SENSEX) and those in such frontier markets as Pakistan
Domestic researchers have based their work of investment
(KSE100) and Sri Lanka (CSE) in order to explore possible efficient
diversification on the Modern Portfolio Theory. However, empirical research
investment portfolios.
on the Vietnam stock market has been limited, with small scope of
2.2. Domestic Studies of the Topic
investigation on isolated groups of stocks. No research has covered all actual
Theoretical and empirical researches regarding the portfolio
applications of investment diversification on the Vietnam stock market..
diversification theory in Vietnam are limited. Specifically, Vo Thi Thuy Anh
One of the few research works on portfolio diversification on
(2012) applied Markowitz’s Modern Portfolio Theory to determine the
Vietnam stock market conducted recently is “Conducting and Managing stock
outperforming stocks. The author used actual database during 2009-2011
portfolio in Vietnam” by Tran Van Tri (2015). However, this research work
period for listed stocks on HOSE and HNX before December 31, 2008. Trieu
does not cover all theories on investment portfolio diversification, pros and
2
cons of each theory, and applications of those theories on stock portfolio in
Vietnam stock market. With the derived result of the test, the author attempts
other countries with market functions similar to that in Vietnam. This research
to conclude the benefits of applying the portfolio theories in constructing and
also does not mention the investment portfolio diversification in Vietnam in
managing the diversified investment portfolio in Vietnam.
full scale, including market and legal matters. Tran Van Tri’s research (2015)
4. Subject and Scope of Research
only reaches out to explore the technical aspect of conducting and managing
stock portfolio. Besides, Tran Van Tri’s research (2015) only examines the
4.1. Subject of Research
CAPM model on investment opportunity set and does not summarize any
The dissertation focuses mainly on summarizing theoretical models
take-away lessons on constructing and managing diversified investment
and empirical evidences on investment diversification collected from
portfolio in emerging and frontier markets that are similar to Vietnam; risk-
emerging and frontier markets to apply accordingly to the situation of
free assets and strings of research topic are not covered in the work as well.
Vietnam stock market and suggest appropriate investment strategies for
This is the vital gap in which this research will continue to explore to
professional investors. Upon the theoretical foundations and empirical
fit in with the Vietnam market.
research previously done, the dissertation suggests possible market situations
3. Purpose of the Research
and legal matters to help professional investors adequately allocate their
Given the academic work and empirical evidences of the Vietnam
capital assets and diversify their investment portfolios in Vietnam market
stock market mentioned above, this dissertation focuses on systemizing all
during 2007-2017 period.
theories on investment diversification, as well as summarizing empirical
Moreover, the dissertation compares the outcomes of theoretical-
research and concluding the investment diversification in such similar markets
based investment diversification in several markets in order to conclude a
as Vietnam (emerging and frontier countries). Besides, this dissertation
common pattern as well as typical characteristics of each of the markets
attempts to clarify actual investment diversification in financial organizations
(including those in emerging and frontier markets). Therefore, the dissertation
and investors, thus points out the results as well as the drawbacks and their
concludes a common pattern in investment diversification, pros and cons of
causes. On the basis of checking and summarizing all theories of investment
the application of principles of investment diversification in emerging and
diversification that are suitable for Vietnam stock market, two major theories
frontier markets.
used to construct and implement an investment portfolio in Vietnam are the
4.2. Scope of Research
CAPM model and Markowitz’s Modern Portfolio Theory.
With the objective of optimizing the allocation of assets to construct a
The dissertation focuses on investment diversification in Vietnam
diversified investment portfolio in Vietnam stock market during 2007-2017
stock market by describing, comparing, and analyzing investment strategies
period, this dissertation attempts to verify the result of the constructed
used by active local and foreign investment funds/investment management
diversified investment portfolio and compare it to the overall performance of
companies. However, due to limited data sources, the dissertation emphasizes
3
specifically on investment strategies used by investment funds during 2007,
that of the market. Therefore, the method should point out actual empirical
2008, 2016, and the first half of 2017.
evidence for each unique investment situation.
Based on the scope of research, the author researches, constructs, and
6. Composition of Research: The dissertation consists of three
reallocate financial resource in order to diversify investment portfolio based
chapters in which the research results are presented and recapped
on various penetration methods and recommendations suitable for stock
CHAPTER 1: REASONING FOUNDATION OF PORTFOLIO
market in Vietnam.
DIVERSIFICATION ON STOCK MARKET
5. Research Methods
1.1. Overview of the Portfolio Diversification
The dissertation applies two different research methods to analyze the
The author summarizes the definitions and forms of the stock
objectives of the research, which are:
portfolio diversification such as types and subtypes of assets, aspects of an
5.1. Non-parametric Method: Non-parametric method does not
economy, among different funds, different economies, different currencies,
require that the population being analyzed meet certain assumptions, or
durations of investments, quality of investment assets and financial tools.
parameters, combining with other mathematical model and the matrix
1.2. Basics of the Portfolio Diversification
programming, to solve for the proportions of each of the stocks in the
investment portfolio using Solver function in Excel. This method solves for
According to Ongkrutaraksa’s summary (1996), Modern portfolio
such objectives of the research as: (i) risk-free yield and (ii) short selling
theory involves the allocation of capital assets (both underlying assets and
strategy. On that basis, the research calculates levels of efficiency and risk
their derivatives) in diversifying an original investment portfolio. From 1950
associated with the diversified investment portfolio. Discounted cash flow
to 1970, the theory of portfolio diversification and the single factor model,
method is also applied in the research by using “Bootstrapping” technique to
based on the multivariate effect (MVE), have been the key factors in
convert data to risk-free in alignment with stock data.
allocating and diversifying assets in a portfolio. This theory was originated by
Markowitz (1952, 1959) and developed further by Sharpe (1963). Other
5.2. Parametric Method: Parametric method, run by Eviews 8, is
theories related to this work, such as the CAPM model developed by Sharpe
used to parameterize the population of stocks returns and to test for the
(1964) and Lintner (1965) and the arbitrage pricing theory (APT) – the
randomness of the market and the normal distribution of data set of stocks
foundation for the multiple factors model developed by Ross (1976), were
returns. The use of this method also allows the author to run a regression
derived from MVE. The three theoretical models are closely related to one
model to test the correlation between the efficiency of the portfolio and that of
another in diversifying investment portfolio.
the market. On that basis, the author applies the CAPM model to test whether
the return rate of a non-parametrical diversified portfolio is proportional with
4
In chapter 1, the author describes the following variations of portfolio
The MVE model has three main drawbacks: (1) the portfolio
diversification: (i) modern portfolio theory; (ii) Tobin’s and Sharpe’s portfolio
optimization process may lead to a portfolio being excessively concentrated;
theory; (iii) factor model; (iv) CAPM model; (v) arbitrage model; and (vi) the
(2) the model may not sufficiently explain and account for market shocks; (3)
Black-Litterman
the corner solution, a major drawback of a model when applied in actual
model.
The
performance
measures
of
portfolio
diversification are summarized as follow:
cases, happens when investors accept the short selling position of some of the
assets in an investment portfolio, which lead to variables of those assets take
(i) For non-validation portfolios: the calculation is the return gain
value zero or negative (Black & Litterman, 1992). In reality, short selling is
divided by the standard deviation of return. Popular indices include the Sharpe
legally restricted in many countries.
ratio, information ratio (IR), Modigliani and Modigliani ratio (M&M), Sortino
ratio (SR), Treyno ratio (TR), value at risk ratio (VaR), Jensen’s Alpha ratio,
The CAPM model: Elbannan (2015) insisted that the CAPM model
Treynor & Mazuy ratio (T&M), and Henriksson & Merton ratio (H&M).
was criticized in many forms of research because it accounts for risk-free rate
without limits. When constructing a diversified portfolio in a specific time
(ii) For validation portfolios: the CAPM model, with the addition of
period, investors will only pay attention to the risk-return trade off of that
new risk factors from the multiple factors model, is used to measure portfolio
period; meanwhile, the beta of CAPM model explains all risk assets by
diversification efficiency. In fact, many researchers agree that the sole CAPM
accounting for expected rate of return and all market variables.
model (risk-free rate) is insufficient in measuring the level of efficiency of a
diversified portfolio. As a result, macroeconomic, business fields, and
The APT model: the APT is incapable of accounting for the risk
business unique factors are factored in the multiple factors model to derived a
factors that affect rate of return of assets in a diversified portfolio.
more confident estimation of the portfolio diversification theory. Fama and
The Tobin’s Q model: the drawback of the the q coefficient is that if
French (1992) added business size variable and the book-to-market ratio to the
the market does not adequately value the companies in one period, then
theory. Carhart (1970) suggested the use of momentum effect. Other
revaluation is required in the next period; that means the μ in Tobin’s Q
macroeconomic variables such as interest and inflation, investors’ behaviors
model is rather large.
and methods of allocating assets and diversifying investment portfolio
The Black-Litterman model: legal risk increases due to lack of
(depending on the size of market capitalization and market growth rate) are
also factored into other diversification theories. Those variables are mainly
coordination
accounted for and factored into the Fama-French model, Carhart model,
company/industry analysis.
Jensen’s Alpha model, and GARCH model.
among
guests’
situations,
market
expectation
and
The author concludes that each model has its own drawbacks.
Therefore, the modern portfolio theory with all of its components and
1.3. Drawbacks of the Portfolio Diversification
experimental results in certain situations are somewhat overstated. But
5
without the theoretical foundations to assess, researchers will be unable to
Secondly, the business management cultures vary in different markets
explain the logics behind asset pricing methodology and rates of return of the
with different forms of custom and law. For example, some markets allow for
main financial assets in a diversified investment portfolio.
short selling of stocks and some do not (e.g. China). Grasping the market
uniqueness will help to make appropriate decisions;
1.4. Research Application on Portfolio Diversification in the
Thirdly, the effect of globalization and free trade agreements can
World
influence investors’ decision. If investors can exploit from a less integrated
The author states empirical evidences conducted when applying
country with weaker correlation, they can benefit from more investment
portfolio diversification models to actual case studies in the emerging and
opportunities. For example, the emerging and frontier markets are less
frontier markets. The effect of investment portfolio diversification in such
integrated compared to those in developed countries. However, barriers to
countries is much greater than that in developed countries due to low
market and high transaction fees are the limits of frontier markets;
correlation. However, in order to optimize the effect of portfolio
Fourthly, the crisis spread may affect multiple markets. Therefore,
diversification, besides the application of theoretical models, investors need to
more reliable analyses and forecasts are needed to lessen the risks for
look into all of the unique characteristics, opportunities and drawbacks of
investors;
each market to exploit any possible investment chances. Researchers have
Fifthly, identifying the source of model factors that influence the
come to an agreement that frontier market has low level of integration;
stocks’ rate of return (e.g. factors are nation- or industry-ralated) will help
therefore, investors can benefit from investment portfolio diversification. Yet
investors choose the appropriate stocks for their portfolio;
high transaction fees and barriers to the market may concern investors when
Finally, potentials of currency crisis may happen in a highly
making decisions in diversifying their portfolio in such market. From
competitive world, when many economies use exchange rate mechanism to
empirical evidences and actual research results, the author has taken away
help boost exports and economic growth. That may eventually lead to
some lessons for Vietnam stock market.
currency war “phenomenon” (devaluing currencies to boost exports), which
1.4.1. From Vietnamese Investors’ Perspectives
negatively affect stock markets. Being able to forecast economic trends will
The Vietnamese investors may apply the theories of investment
help investors minimize risks when constructing their diversified investment
portfolio.
portfolio diversification to explore the optimal investment portfolios based on
types of industries and nations. Nonetheless, when researching investment
1.4.2. From Foreign Investors’ Perspectives
portfolio diversification, investors should take the following limits and
Firstly, Vietnam stock market is classified as a frontier market, which
means low level of integration; therefore, investors should expect many
validations into account:
Firstly, the randomness of rates of return because many emerging
opportunities for investment portfolio diversification. Similar to other frontier
markets do not have sufficient data to construct a normal distribution analysis;
markets, limits for entry exist such as barriers to market, high transaction fees,
6
limited holdings of foreign investors, low currency convertibility, and
rate; (v) stock borrowing and lending system (SBL) only allow depository
prohibition of short selling… These limits lessen the benefits investors could
members at VSD to borrow securities in case of after trading-hour correction
achieve from investing into Vietnam, thus may lead to losing opportunities of
orders to meet the liquidity requirement; therefore, the benefits of arbitrage
capital inflows into the country;
trading for domestic ETFs are cleared out; (vi) investors find that spending a
Secondly, despite the action from the Vietnamese government to
large amount of capital on the ETF certificate while having interest only in
gradually clear out the above limits, compared to other emerging and frontier
some stocks that reach the room limit is not an optimal investment option;
markets, consideration for more open regulations to foreign investors is vital
(vii) margining is not allowed in the trading of ETF certificates; (viii)
in attracting capital inflows into Vietnam.
regulations and mechanisms for the publication of information of ETFs are
CHAPTER 2: PORTFOLIO DIVERSIFICATION ON
unique with complicated procedures.
VIETNAM STOCK MARKET
Secondly, open-end funds have gradually replaced closed funds and
2.1. Legislative Framework on Portfolio Diversification
have dominated in Vietnam stock market due to the fact that the repurchase of
Legislative framework on the portfolio diversification activities,
fund certificates is not mandatory for ETFs and that the duration of fund
which applies to financial and economic organizations and personal investors,
certificates is long. These limits leave the investors with the need of capital no
is relatively limited. Current legal documents tend to stimulate the
choice but sell their fund certificates on the secondary market; that is the main
diversification of investment portfolios in an indirect way, mostly to control
cause for the shift of capital from closed funds to open-end.
risk and capital adequacy and to serve the macroeconomic policies.
Thirdly, although smaller in the number of funds on Vietnam stock
2.2. Current Case of Portfolio Diversification on Vietnam Stock
market, closed funds have the advantages in the size of funds and better
Market
profitability measure sue to larger sources of capital and more efficient
The author of this dissertation focuses on analyzing the current case
management.
of portfolio diversification activities conducted mostly by financial funds: (i)
2.3. Analysis on Portfolio Diversification on Vietnam Stock
index funds, (ii) closed funds, and (iii) industries-based open-end funds.
Market
Conclusions derived from the research include:
By examining the statistics on risks, return and other performance
Firstly, the Exchange Traded Funds (ETFs) have high level of
measures of the portfolio diversification activities on Vietnam stock market in
diversification in terms of the number of stock codes; however, the
the last five years, the author has concluded the following: the level of
profitability measures are rather low due to: (i) ETFs base their investment
profitability (excluding (low) management costs of ETFs) from portfolio
activities on certain indices; (ii) ETFs have to abide by various regulations
diversification is relatively low compared to the high level of risks; the level
upon their operations; (iii) the prohibition of short selling in Vietnam; (iv)
of profitability (excluding (high) management costs of closed/open-end fund)
high level of volatility in macroeconomic environment, specially the exchange
from portfolio diversification of closed/open-end funds is higher than that of
7
ETFs, and some funds perform better than the market with lower level of
Vietnam market with unique characteristics of a frontier market, limits on
risks; the level of portfolio diversification among all investment funds,
objectiveness and asymmetric information, weak management, and the lack of
including closed/open-end funds and ETFs are high; therefore, the levels of
legislative framework; (ii) limits of each of the models that make the use of
profitability and risks are well improved.
one single model infeasible in reality; and (iii) the results of research works
The presence of the limits is mainly due to market problems such as
done in other emerging and frontier markets with similar conditions to the
stocks with low quality, low market liquidity, limited market products and
case of Vietnam. In fact, other researchers have applied multiple models to
services, small market size, lack of investor base in the repo market, lack of
examine the efficiency level of portfolio diversification on the basis of the
credit rating agencies, and the underperformance of stock exchanges and
Markowitz’s Modern Portfolio Theory.
securities depository. These limits explain the immaturity of the market and
In chapter 2, the author applies the Markowitz’s Modern Portfolio
affect the performance of the funds either directly or indirectly. The problems
Theory as well as Tobin and Sharpe’s theory and parametric model to
concerned with legislative framework also have an impact on the performance
examine the possibility of portfolio diversification application and its level of
of funds, such as the prohibition on the short selling of stocks, while failing to
profitability on Vietnam stock market, thus seeks the answers for research
promote investors’ incentive to make long-term investments and lacking
questions in this dissertation.
sanctioning mechanisms on market violations.
2.4.1.2. The Application of Modern Portfolio Theory (MPT) on
2.4. Constructing and Examining the Theory of Portfolio
Vietnam Stock Market
Diversification on Vietnam Stock Market
Maximization: Max Z E(RZ)+ rf*z0 with the condition Z’*C*Z = c,
2.4.1. Recommended Theories of Portfolio Diversification
Z’*1N =1, or
2.4.1.1. Justification for Choosing the Theories in the Case of
Minimization: Min Z Z’*C*Z with the constraint E(RZ)+ rf*z0 = c,
Vietnam Market
Z’*1N =1 and zi>= 0 (i=0,N).
On the basis of portfolio diversification theories stated in Chapter 1,
the author chooses the Markowitz’s Modern Portfolio Theory to examine the
Where:
possibility of portfolio diversification application and its level of profitability
E(RZ): expected return of the stock portfolio
on Vietnam stock market, with additional examination on such two added
N: number of stocks in the portfolio
binding scenarios as: portfolio with risk-free securities (treasury bonds) and
portfolio with short selling option. This research approach combines the
rf:: risk-free rate
Markowitz’s Modern Portfolio Theory and the Tobin and Sharpe’s theory on
z0: weight of risk-free securities in portfolio
risk-free assets. The author bases his approach on (i) the immaturity of
8
Z and Z’ are transpose matrices, representing the weights stocks and
(9) are unique characteristics of Vietnam stock market and will be tested
risk-free securities in the portfolio
during the examination of the MPT.
C: covariance matrix of returns among stocks
2.4.2. Phases of Research
1N: unit of matrices (N*1)
Based on the Vietnam macroeconomic state and the stock market
during 2007-2017, the author selected data in years 2007, 2008, 2016, and the
There are two special constraints: (1) prohibition of short selling: zi>=
first half of 2017 to conduct the research on and examine portfolio
0 for all i; (2) the absence of risk-free securities: z0 = 0
diversification on Vietnam stock market. The data selection ensures the
2.4.1.3. Conditions on the Examination of Portfolio Diversification
representation of different phases of the market (market boom in 2007,
in Vietnam
recession in 2008, and recovery and stable growth during 2016-2017). On the
Despite the salient advantages and the ease of usage and application,
other hand, this selection covers main phases of the history of Vietnam stock
the MPT still depends on some assumptions that require investors’ attention
market, including the history (years 2007 and 2008) and current market
(Reto, 2003), for example: (1) investors intent to maximize their profits and
situation (years 2016 and 2017) to forecast the future. Therefore, the data
minimize the risks; (2) investors only look at the expected return and risks
selection allows for the close grasp of market states to derive the most
measured by the standard deviation when making decision; (3) all investors
appropriate answers to the objective questions of the dissertation
have the same risk and return expectations; (4) all investment decisions are
2.4.3. Constructing a Diversified Portfolio by using non-
made in the same period of time; (5) all investors have the same access to
parametric Method
information (no market flaws from asymmetric information); (6) transaction
2.4.3.1 Data Description and Analysis Method
fees and price gap are negligible; (7) returns of all assets are normally
distributed; (8) no restrictions on market actions and asset positioning; (9) no
a. Stock Data Description: on January 1st, 2007 (the beginning
barriers to lending or borrowing of risk-free assets.
period of the research) there were 108 listed stocks on the HOSE. Therefore,
the author takes into account all of the stocks to run a standard deviation
No theoretical models meet all nine assumptions above in actual
analysis on return of each of the stocks. 24 stocks that meet the stochastic
market condition. However, the purpose of the research is to determine
condition and the standard analysis will be chosen for the research model.
whether the assumptions are feasible in actual case studies. In case of
Vietnam, the author assumes: assumptions (1) to (6) are met; the stocks that
Stock prices are factored in to the model to eliminate any common
meet assumption (7) will be chosen to construct a portfolio (meaning returns
impacts that may distort the return rate such as dividends of stocks or stock
on those stocks meet the standard deviation requirement); assumptions (8) and
splits. Sources of data include Reuters and Bloomberg databases; whereas
Reuters edits the data, so the daily return rate of each stock is precise. There
9
are total 865 observations for each stock in 2007, 2008, 2016, and the first
decides the trading prices. Therefore, all of the 24 stocks can be factored in to
half of year 2017.
the portfolio diversification model.
b. Data on risk-free securities: data on risk-free securities included
The bases for choosing stocks are: (1) the optimal number of stocks
solely Treasury bond with one year to maturity: Because the yield on 1-year
required in constructing a diversified portfolio lies between 10 to 30;
bond is calculated on a yearly basis, the author coverts back to daily basis by
therefore, 24 stocks is a sufficient number; (2) these stocks meet the standard
dividing yearly yield by the number of actual trading days of year. For
deviation condition as mentioned; (3) low level of correlation among these
example, on January 1st, 2008, yield of 1-year Vietnam Treasury bond is
stocks means the trading prices of stocks are highly random; and (4) these
7.85% p.a. (source: Bloomberg) with no trade history in year 2007. The
stocks are highly liquid throughout the research period.
number of actual trading days in 2007 is 248 days. The daily-based yield is
2.4.3.3
calculated as: 7.85%/248 days = 0.032%/day.
Constructing
a
typical
Diversified
Portfolio
and
Examining the Performance compared to the Market
For years 2008, 2016 and the first half of year 2016, the same
A typical investor using the MPT pays special attention to the risks
calculation method is applied. In year 2008, there is a trade history of 1-year
and return of the portfolio. That shows in the average return rate and standard
Treasury bond, so the average yield on bond in 2008 is discounted by using
deviation of return. All calculations in the dissertation are based on daily data
Bootstrapping technique to be equal 12.67% p.a.; the number of actual trading
and done with the use of Solver in Microsoft Excel.
days is 245 days; daily yield of Treasury bond is 12.67%/245 days =
In 2007, although market return was not the highest rate, the market
0.052%/day. Daily yield on bond in 2016 is 4.34%/251 days = 0.017%/day
risks were the lowest (standard deviation of the VNI index) compared to other
and in the first half of year 2017 is 3.92%/250 days = 0.016%/day.
stocks. Hence, the author points out that in order to achieve low risks,
2.4.3.2 Analysis on the Standard Deviation of Expected Return
investors should diversify their investment portfolios, rather than investing in
and the Stock Picking for Diversified Portfolio
single stock. By applying portfolio diversification theory, the author can
With Eview 8 software, the author analyzes the Jarque-Bera (JB) test
establish the efficient frontier when only stocks or both stocks and risk-free
on standard deviation with 95% confidence interval, taking into account 24
assets appear in the model.
stocks that meet the stochastic condition throughout the whole research period
The minimum variance portfolio (L1) was suggested in 2007 by
(2007-2017) to construct a diversified portfolio. The author also examines the
diversifying the investment portfolio with portfolio risk at the lowest level of
correlation among the chosen stocks and concludes that due to low level of
1.394%. The L1 portfolio also brings in higher return relative to the VNI
correlation, the trading prices of stocks are highly random, and the market
market performance (return rate: 0.151% > 0.099% and risk: 1.394% <
10
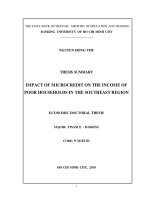
Source: author’s calculation
1.716%). An efficient portfolio combines the L1 and the multiplication of a
risk coefficient with L2 (totaled to 0).
* In case of short seling:
The capital market line is the line that connects the return on Treasury
- If the portfolio only contains stocks, and the risk coefficient allowed
bond (Rf) and the linear portfolio. According to the CAPM and Markowitz’s
is similar to that of the VNI market index, then the solution of the equation is::
theories, the capital market line is the efficient frontier in the case of free
L1’*C*L1 + ∂ 2*L2’*C*L2 + 2*∂*L1’*C*L2 = (1,716%)2
trading of risk-free securities and no prohibition of short selling. The graph
shows the VNI index point lies below the capital market line and the efficient
And coefficient vector is L1 + ∂* L2. The result shows portfolio (E1)
frontier when the portfolio only contains stocks. That means the
with only stock has similar market risk to the case of short selling, and return
diversification of investment portfolio plays the key factor in helping
on the diversified portfolio is 0.546%, much higher than market return – VNI
investors win the market. in the case of Vietnam stocks market, however,
(0.099%). The reason is by short selling devaluing stocks such as FPT, AGF,
short selling is prohibited, so the author examines the efficient portfolio with
TYA, THD, and so on, investors can improve the level of investment
either compatible risks or similar market returns factored in as in cases of
efficiency, as well as holding stocks that are gaining in value with low risk
short selling and risk-free securities (Rf).
such as DHG, VNM, ITA, and BCC.
- If the portfolio only contains stocks, the allowed risk coefficient (∂)
Graph 2.1: Efficient frontier and capital market line in 2007
in efficient portfolio with similar return to that of the market is the solution of
Return
3.50%
the following equation:
E(rL1 ) + ∂ *E(rL2 ) = 0,099%
3.00%
Capital market line
However, return on portfolio with minimum variance L1 (0.151%) is
2.50%
still higher than return of the VNI (0.099%). Therefore, the L1 portfolio is still
2.00%
chosen as an efficient portfolio (E2) with closest return to the VNI.
1.50%
* In case of prohibition of short selling:
1.00%
Efficient frontier with
only stocks
The efficient portfolio with the same risk as the VNI is the solution of
the optimization equation Max
0.50%
0.00%
0.00%
1.00%
2.00%
3.00%
Z’*1N =1 and zi>= 0 (i=1,N).
Risk
VNI
4.00%
5.00%
6.00%
7.00%
8.00%
11
Z
E(RZ) with contraint Z’*C*Z = (1.716%)2,
The efficient portfolio with the same return as the VNI is the solution
If Treasury bond (Rf) is added to the portfolio, the coefficient that
of the optimization equation: Min Z Z’*C*Z with constraint E(RZ) = 0.099%,
defines w0 of Rf in efficient portfolio with similar reurn to that of the market
Z’*1N =1 and zi>= 0 (i=1,N).
(VNI) is the solution of the following equation: (1-w0) * E(rT) = 0,099%. W0
is the coefficient of Rf and (1- w0) * T is the coefficient of stocks. Calculation
In case of prohibition of short selling, the coefficients of all stock in
result from E6 portfolio shows that, in case investors are allowed to join the
portfolio are greater than 0. Investors tend to maximize profit of the portfolio
bond market and to short sell, they lean towards minimizing risk but keeping a
on the condition that risk of the portfolio be similar to that of the market, and
certain level of portfolio return similar to that of the market, meaning they
in the absence of short selling (E3 portfolio), investors will lean towards
will hold more of Treasury bond (significant Rf of 97.46%) in order to keep
holding of stocks that are gaining value such as DHG, HAP, ITA, BCC,
risk at the lowest level (risk of holding Treasury bond is zero); besides,
NAV…
investors will hold more of high return and low risk stocks such as REE,
If investors look forward to minimizing risk of their portfolio, on the
DHG, VNM, HAP, ITA, BCC, NAV and short sell devaluing stocks such as
condition that return of the portfolio be similar to that of the market, and in
FPT, AGF, TYA, THD…
the absence of short selling (E4 portfolio), investors’ behavior will lean
In case of the prohibition of short selling: efficient portfolio with
towards holding of stocks that are gaining value and have low risk such as
similar risk to the VNI is the solution of the optimization equation: Max
DHG, ITA, PPC, RAL and so on, or holding of low risk stocks with slight
Z
(E(RZ) + rf*z0) with constraint Z’*C*Z = (1,716%) , Z’*1N =1 and zi>= 0
2
devaluation such as AGF, THD…
(i=0,N).
* Diversified portfolio in case of adding Treasury bond:
Efficient portfolio with similar return to the VNI is the solution of the
If Treasury bond (Rf) is added to the portfolio, the coefficient that
optimization equation: Min Z Z’*C*Z with constraint E(RZ)+ rf*z0 = 0.099%,
defines w0 of Rf in efficient portfolio with similar risk to that of the market
(VNI) is the solution of the following equation: (1- w0)
2
Z’*1N =1 and zi>= 0 (i=0,N).
* Var(rT) =
Calculation results, including both stocks and Treasury bond (E7)
(1,716%)2. W0 is the coefficient of Rf and (1- w0) * T is the coefficient of
with similar risk to the market in case of no short selling, shows that investors
stocks. Calculation result from E5 portfolio shows that investors lean towards
can only hold high return and low risk stocks such as DHG, HAP, ITA, BCC,
holding of high return stocks as well as adding low risk securities such as
NAV, SMC in order to maximize return, as well as holding a small portion
Treasury bond (zero risk), DHG, VNM, HAP, ITA and so on, on the other
(1.50%) of Treasury bond to hedge for risk, keeping the level of risk of
hand, investors will short sell devaluing stocks such as FPT, AGF, TYA,
portfolio similar to that of the market.
THD…
12
Calculation result on the portfolio containing both stocks and bond
1.491%; portfolios containing both stocks and bond at the same return rate as
(E8), with similar return to that of the market and in the case of prohibition of
the VNI and allowed for short selling (E6): 0.167%; and portfolios containing
short selling, shows that investors tend to hold Treasury bond (significant Rf
both stocks and bond and not allowed for short selling (E8): 0.317%. On the
of 81.77%) to ensure low level of risk. Besides, investors also hold more of
other hand, the more restraints on the market, the more risks investors have to
high return stocks and consider those with low risk such as DHG, HAP, ITA,
bear in diversifying their portfolios.
BCC, NAV, and so on, to ensure the return on their portfolio is similar of that
2.4.3.4. Examining the Repetition and Fluctuations of Diversified
of the market.
Portfolio during 2007-2017
* Examining the profitability of the diversified portfolio compared to
The author analyzes thoroughly the results of eight diversified
VN Index:
a) Same risk level as the VNI: The result shows that all of the
portfolios from E1 to E8 compared to the VNI (conducted in 2007) in the next
efficient portfolios with the same risk level as the VNI (1.716%) have higher
years: 2008, 2016, and the first half of 2017 by applying the above calculation
methods. Results are followed:
return than the VNI (0.099%): portfolios containing only stock and allowed
for short selling (E1): 0.546%; portfolios containing both stocks and bonds
(i) Diversified portfolio has similar risk level to that of the VNI:
and allowed for short selling (E5): 0.724%; portfolios containing only stocks
- Portfolio (E1) containing only stocks with similar risk level to that
and not allowed for short selling: 0.397%; and portfolios containing both
of the VNI and allowed for short selling: at similar risk level to the VNI
stocks and bond and not allowed for short selling (E7): 0.397%. this suggests
(notice the risk level of each of the stocks is higher than that of the market),
investors may earn a higher return than that of the VNI at the same risk level
return on portfolio is higher than that of the VNI, meaning investors can beat
the market through diversifying their portfolios.
by diversifying their investment portfolios. The result also points out that the
- Portfolio (E3) containing only stocks with similar risk level to that
more disadvantages and drawbacks in the market, the less the return earned by
of the VNI and not allowed for short selling: investors in this case can only
diversifying portfolio.
hold growing stocks such as: DHG, HAP, ITA, BCC in 2007; PVD, DHG,
b) Same return as the VNI (0.099%): the result shows that the risk
VNM, SAV in 2008; REE, SAM, VNM, RAL in 2016; and FPT, DHG, PPC,
of all portfolios is lower than that of the VNI (1.716%): portfolios containing
VNM in the first half of 2017. At the similar risk lvel to the market, return on
only stocks at the same return rate as the VNI and allowed for short selling
E3 portfolio is higher than that of the VNI, meaning despite the prohibition of
(E2): 1.394% (higher return at 0.151%); portfolios containing only stocks at
short selling, investors can still beat the market by flexibly adjust the
the same return rate as the VNI and not allowed for short selling (E4):
coefficient of stocks in the portfolio; however, return on E3 being lower than
13
that on E1 means the prohibition of short selling negatively affect the
totally choose to hold 100% of Treasury bond (which earns a return of
performance of the portfolio.
0.052% and zero risk but fails to meet the “don’ put all eggs in the same
basket” criterion).
- Portfolio (E5) containing both stocks and bond with similar risk
level to that of the VNI and allowed for short selling: investors’ reaction is the
- Portfolio containing both stocks and bond (E7) with similar risk
same as with E1; they can improve the performance of the portfolio by short
level to the market and not allowed for short selling: the behavior of investors
selling devaluing stocks such as: FPT, AGF, TYA, THD in 2007; GMD,
is similar to that on the E3, but the coefficients of stocks are different due to
PVD, STB, HAP in 2016; or PVD, BMP, GIL in the first half of 2017.
the holding of Treasury bond. At the similar risk level to the VNI, returns on
Alternatively, investors hold greater proportion of stocks that gain value with
E7 in all periods of coefficient adjustments are higher than those of the VNI.
less fluctuation such as DHG, VNM, ITA, BCC in 2007; or REE, SAM,
Return on E7 is also higher than that on E3 but lower than that on E5.
KDC, VNM in 2016; or FPT, DHG, PPC, VNM in the first half of 2017.
Specifically, the comparison of returns on E7 and on E1 does not result in a
clear outcome, although the performance of E1 seems to exceed E7 due to
The difference among E5 and E1 and E3 is that in 2008, investors
higher return on E1 than on E7 in years 2007, 2008, and 2016 and only lower
only held Treasury bond and a single stock PVD. This is easily explained as
in the first half of 2017.
the stock market in 2008 suffered a recession, and all stocks in portfolio
realized tremendous losses. Amongst those, however, PVD realized the
(ii) Diversified portfolio has similar return to that of the VNI:
smallest loss in return. In order to ensure the targeted risk rate, the holding of
- Portfolio E2 containing only stock with similar return to that of the
PVD and Treasury bond was predictable. Nevertheless, this is not the most
market and allowed for short selling: at a similar return rate (even when
suitable method of managing investment portfolios in terms of diversification.
return on E2 is higher) to that of the market, the risk level of E2 is lower than
At the similar risk level to the VNI (notice the risk level of each of the
that of the VNI over all periods of calculations and coefficient adjustments.
stocks is higher than that of the market), return on E5 is higher than that of the
That shows investors can beat the market through portfolio diversification.
VNI in all periods, suggesting investors can beat the market through portfolio
- Portfolio E4 containing only stocks with similar return to that of the
diversification. Furthermore, return on E5 is also higher than that on E1 and
market and not allowed for short selling: E4 has similar return levels to those
E3 due to the holding of Treasury bond (E1 and E3 portfolios do not contain
of the market; risk level of E4 is lower that that of the market after
Treasury bond) and short selling option (E3 is not allowed for short selling);
calculations and coefficient adjustments. That shows investors can beat the
the only exception was in the year 2008 where return on E5 was higher than
market through portfolio diversification. However, the risk level of E4 is
that on E3 but lower than that on E1 due to the reason mentioned above
higher than that of E2 (even when return on E2 is higher than that on E4),
(recession on stock market in 2008 and the keeping of targeted risk level). In
meaning the short selling of stocks can be treated as a hedging tool.
case the market encounters another recession similar to 2008, investors can
14
- Portfolio E6 containing both stocks and Treasury bond with similar
of the diversified portfolio; and (iii) the short selling factor has unclear
return to that of the market and allowed for short selling: E6 has similar
influence in the model.
return to that of the market, while the risk level of E6 is significantly lower
(b) Diversified portfolio has similar return to that of the VNI: (i)
than that of the market after calculations and coefficient adjustments. The risk
risk levels of all diversified portfolios are lower than that of the VNI in all
level of E6 is also lower than that of E2 and E4, meaning the holding of
periods; (ii) risk level of E6 is the lowest, followed by E2; risk level of E4 is
Treasury bond is a very effective hedging tool; investors can beat the market
the highest.
through portfolio diversification.
That shows: (i) investors can definitely beat the market in terms of
- Portfolio E8 containing both stocks and Treasury bond with similar
risk level by managing a diversified portfolio that meets standard deviation
return to that of the market and not allowed for short selling: result shows
condition, has low correlations among all stocks in the portfolio, and flexibly
that E8 has similar return to that of the market, while portfolio’s risk level is
change the coefficient of each stock in different periods; (ii) the more limits
significantly lower than that of the market after calculations and coefficient
and constraints, the lower the performance (return) of the diversified portfolio;
adjustments. The risk level of E8 is also lower than that of E2 and E4 but
and (iii) the holding of Treasury bond is a more effective hedging tool than
higher than E6, meaning that the short selling of stocks and the holding of
short selling.
Treasury bond are effective hedging tools and that investors can beat the
In general, the analysis results in the dissertation are relatively diverse
market through portfolio diversification.
from research results derived from other emerging markets that are
2.4.3.5. Conclusion and Judgment from Calculation Results
summarized in Chapter 1, including Lee, Fah and Chong (2016)’s case on
(a) Diversified portfolio has similar risk level to that of the VNI:
Malysia; Zaimovic, Berio and Mustafic (2017) on the SEE zone… However,
(i) returns on all diversified portfolios are higher than that of the market in all
the summary result in the dissertation is overall similar to that of Hallinan’s
periods; (ii) return on E5 is the highest, followed by that on E1 and on E7;
research on emerging markets, Zhou’s research (2010) on China, as well as
return on E3 is the lowest.
most of the research work conducted on frontier markets such as Randolph’s
(2011) and Mills’ (2015) papers on African countries.
The result shows: (i) investors can definitely beat the market in terms
of rate of return by constructing and managing a diversified stock portfolio
2.4.4. Examining Portfolio Diversification through Parametric
that meets standard deviation condition, has low correlations among all stocks
Method
in the portfolio, and flexibly change the coefficient of each stock in different
The author applies the parametric method in constructing and
period; (ii) the more limits and constraints, the lower the performance (return)
estimating his regression models. Based on the constructed diversified
portfolios and examinations in part 2.1 above, the author continues to
15
distribute the “coefficient” for each of the stocks in the portfolio in each
decreases) by less than 1%. In other words, profitability rates of all portfolios
calculation period; hence, he calculates return on the whole diversified
are smaller than that of the market in all calculating periods.
portfolio on a daily basis to create a daily time series data. Next, the author
- The estimated coefficient β of portfolio E3 always carries a positive
applies the CAPM model to estimate his regression as follow:
(
and the highest value in all calculating periods, suggesting that return on E3
)
fluctuates more than returns on all other portfolios and is in a direct proportion
with return of the VNI. On the other hand, coefficient R2 of portfolio E3 is
where:
always the highest value in all calculating periods, proving that the
E(y): average return of portfolio: E(y)=∑_(j=1)^t▒w_j *y_j
performance of E3 depends much on the fluctuations of the VNI. The reason
is because investors lack the tools necessary for hedging, diversifying and
(E(y) is the daily average return of the portfolio, y_j is the return of
improving the performance of their portfolios (investors encounter the most
each stock; và w_j is the coefficient of each stock in the portfolio
constraints in portfolio E3).
VNI: daily return of the VNI
- In contrast with E3, coefficient β of portfolio E5 always carries the
From there, the author estimates and examines the coefficient β. Pair
lowest value in all calculating periods, meaning the performance of portfolio
of assumptions used in examination includes:
E5 is least influenced by the fluctuations of the VNI. The reason is that with
H0: β = 1;
E5, investors have the most freedom from any constraints and limits as well as
H1: β < 1
the tools necessary to diversify, to hedge, and to improve the performance of
If Tqs < –
their portfolios.
– k) : reject H0, accept H1.
- The estimation result of coefficient β does not have a clear meaning
If β = 1, then return on the portfolio fluctuates proportionally with
in terms of statistics when compared between E1 (containing only stocks and
return on the VNI; if β < 1, then return on the portfolio fluctuates less than
allowed for short selling) and E7 (containing both stocks and Treasury bond
return on the VNI; if β > 1, then return on the portfolio fluctuates more than
and not allowed for short selling).
return on the VNI. The author also examines other statistical errors of the
- The estimation result of coefficient α is always of positive in all
model (ε_ti). Results are followed:
portfolios, showing that in case the diversified portfolio has similar risk level
(i) Diversified portfolio has similar risk level to that of the VNI:
to that of the VNI, given return of the market equals 0%, and ceteris paribus,
- Coefficient β < 1 is for all portfolios in all calculating periods of the
then return on the portfolio is still greater than 0%. However, the estimation
dissertation, meaning that given all other factors are unchanged, when return
of the market increases (or decreases) by 1%, return on portfolio increases (or
16
- The estimated result of coefficient α does not have a clear meaning
result does not have a clear meaning in terms of statistics when comparing all
portfolios.
in terms of statistics, because the portfolios are calculated so that the risk level
is the lowest yet returns on all portfolios are still similar to that of the market.
(ii) Diversified portfolio has similar return to that of the VNI:
2.4.5. Conclusion on the examination result
- Coefficient β < 1 is for all portfolios in all calculating periods,
meaning given all other factors unchanged, when return of the market
With all empirical analysis results, the quantification in the
increases (or decreases) by 1%, then return on the portfolio will increase (or
dissertation has contributed to the confirmation of the conclusions (research
decrease) by less than 1%. In other words, the performance of portfolios
theses) derived from this research field not only in Vietnam but also in the
fluctuates less than that of the market in all calculating periods.
world. The main conclusions derived from empirical analysis in the
dissertation are followed:
- The estimated coefficient β of portfolio E4 always carries a positive
and the highest value in all calculating periods, showing that return on E4
(1) With calculation and examination results on standard deviation
fluctuates more than those of all other portfolios and is in a direct proportion
and coefficients of actual data on Vietnam stock market, investors can
with the VNI. On the other hand, coefficient R2 of E4 is always the highest
definitely select and construct a diversified portfolio (with 24 stocks) that
value in all calculating periods, proving that the performance of E4 depends
meets such theoretical conditions: capable of standard deviation analysis, low
much on the fluctuations of the VNI.
coefficients, and high liquidity.
- In contrast with E4, the estimated coefficient β of E6 carries the
(2) Based on the database of selected stock list, data on Treasury bond
lowest value in all calculating periods, showing that the performance of E6 is
with one year to maturity as a risk-free security, and theoretical models, with
least influenced by the fluctuations of the VNI. The reason is that with E6,
the application of Bootstrapping method, mathematical and optimization
investors have the most freedom from any constraints and limits, as well as all
models, the matrix programming, and the use of Solver in Microsoft Excel,
tools to diversify, to hedge, and to improve the performance of their
the results show:
portfolios.
(i) In 2007, the VNI is displayed as a point below the efficient frontier
- The estimated result of coefficient β of portfolio E2 (containing only
and capital market line, meaning by constructing and diversifying the
stocks and allowed for short selling) is greater that of portfolio E8 (containing
investment portfolio with 24 different stocks and Treasury bond, investors can
both stocks and Treasury bond and not allowed for short selling); on the other
definitely beat the VNI – the representative of the market containing all listed
hand, coefficient R2 of E2 is also greater than that of E8, showing that return
stocks. Therefore, the application of portfolio diversification theory leads to
on E2 fluctuates more than E8, and the performance of E2 depends more on
better performance on Vietnam stock market.
the fluctuations of the VNI than that of E8.
17
(ii) The author also researches and calculates the fluctuations of the
(3) The author applies econometric model to examine the correlation
diversified portfolio on a timeline basis and proves that investors can
between return of the portfolio and that of the market. That is, in order to
definitely beat the market (in terms of high return and low risk) and are able to
carry out the examination, the author applies the CAPM model to estimate and
repeat the outstanding investment result by selecting, constructing, and
examine the fluctuations of return rate of the diversified portfolio constructed
managing a stock portfolio that meets the standard deviation condition and the
based on non-parametric model. Results are followed:
flexible changes in coefficient of each stock by applying portfolio
(i) Coefficient β < 1 is for all of the portfolios in all calculating
diversification theory in the case of Vietnam stock market.
periods, meaning that ceteris paribus, when return of the market increases (or
The conclusions above are the significant statistical evidences, which
decreases) by 1%, then return on portfolio increases (or decreases) by less
allow for the answer of research questions 1 and 2 in the dissertation.
than 1%. In other words, return rates of all portfolios fluctuates less than that
of the market in all calculating periods.
(iii) The author also examines the diversified portfolios with either
similar risk level or similar return to that of the VNI but different constraints
This is meaningful statistical evidence and the foundation for
such as: portfolio containing only stocks and not allowed for short selling;
answering research question 5 at the beginning of the dissertation.
portfolio containing both stocks and Treasury bond and not allowed for short
(ii) The estimated coefficient β of E3 and E4 (of which investors
selling; portfolio containing only stocks and allowed for short selling; and
encounters the most constraints) always carries a positive and the highest
portfolio free of constraints. The result shows that the more constraints and
value in all calculating periods, showing that returns on E3 and E4 fluctuates
limits, the less the performance of diversified portfolios. This insists that
more than those on all other portfolios and are in direct proportion with that of
constraints and limitation to the entrance to Treasury bond market and the
the VNI. On the other hand, coefficients R2 of E3 and E4 fluctuate always
short selling option will diminish the effect of portfolio diversification.
carry the highest value in all calculating periods, suggesting that the
(iv) The effect of short selling condition compared to the entrance of
performance of E3 and E4 depends much on the fluctuations of the VNI. The
Treasury bond market is unclear.
reason is investors lack sufficient tools to hedge for risks, to diversify, and to
improve investment performance.
(v) The entrance to Treasury bond market is a better hedging tool that
(iii) In contrast with E3 and E4, the estimated coefficient β of E5 and
the allowance for short selling.
E6 (which allow investors to hold both stocks and Treasury bond and to short
Conclusions derived in points (iii), (iv), and (v) above are the
sell, where E5 has similar risk level, and E6 has similar return to the market)
foundation for the research answers to questions 3 and 4 at the beginning of
always carries the lowest value in all calculating periods, showing that returns
the dissertation.
on E5 and E6 depend the least on the fluctuations of the market. The reason is
18
that with portfolios E5 and E6, investors encounter the least constraints, thus
diversification, thus helps investor improve the performance of their
have all necessary tools to diversify their portfolios and to hedge for risks.
investment portfolios.
(iv) The estimated result of coefficient β is unclear when comparing
CHAPTER 3: POLICY IMPLICATIONS OF PORTFOLIO
between portfolio E1 (containing only stocks and allowed for short selling)
DIVERSIFICATION ON VIETNAM STOCK MARKET.
and E7 (containing both stocks and Treasury bond but not allowed for short
3.1. Direction for Portfolio Diversification on Vietnam Stock
selling).
Market
(v) The estimated result of coefficient β of portfolio E2 (containing
The Government Report No 88/TTr-BTC dated June 30th, 2017 by
only stocks and allowed for short selling) is greater than that of E8 (containing
Ministry of Finance setting out solutions for restructuring of the stock market
both stocks and Treasury bond but not allowed for short selling); on the other
and insurance for the period 2017 - 2020 and Decision No 1191/QD-TTg
hand, coefficient R2 of E2 is also greater than that of E8, meaning that return
dated August 14th 2017 on Treasury bond market development roadmap for
on E2 fluctuates more than that of E8 when the market fluctuates and that
the period 2017 – 2020 and vision until 2030 prove that the Government
return on E2 depends more on the fluctuations of the market (VNI) than that
continues to support portfolio diversification activities
of E8.
3.2. Promoting Convenience and Removing Constraints in
(4) The results above have high level of application in the fund
Portfolio Diversification Activities
management industry and the trading of securities in Vietnam. High-level
The Dissertation proposes the following solutions to promote
managers can refer to the models in this dissertation when managing and
convenience and remove constraint in portfolio diversification activities:
diversifying their investment portfolios.
(5) From the results above, the author provides a number of
Firstly, it is necessary to identify factors favorable to portfolio
recommendations on the creation of efficient business environment and on the
diversification activities in order to promote the advantages while removing
management of funds and securities in Vietnam, for example: (i) the
constraints.
prohibition of short selling should be lifted and the legislators should
macroeconomic environment, political and regulatory framework. It is also
construct a specific mechanism on the short selling of securities; (ii) market
important to promote market factors to support supply such as developing
makers and policy makers should allow for a clearer and more open market
diversification policies and market expansion, and to support demand such as
penetration in order to help investors diversify their investment portfolios; and
attracting idle funds to invest in the stock market;
(iii) a freer stock market will allow for more opportunities of portfolio
These
advantages
include
sustainable
growth,
stable
Secondly, constraints on portfolio diversification activities, such as
legal and operational guidelines need to be removed. For market participants
19
like portfolio swap funds, open-end and closed funds, the constraints are
points in order to utilize opportunities to outperform the market and transfer
mainly on portfolio weight age limit and allowed types of investment assets.
portfolio risk to the market at an appropriate time.
Even though each fund sets its own terms and limits on allowed types of
CONCLUSION
investment assets, the main and most obvious constraint is that the funds are
not allowed to short sell in Vietnam market. At the same time, removing
The success of investment management companies and securities
constraints imposed on domestic and foreign investors in stock and Treasury
companies depends on the ability to allocate, manage assets and diversify
bond market and rules imposed on market participants is necessary.
investments. Due to the important role and diversity of the market reflected in
portfolio diversification, different schools of evaluation and analysis in
3.3. Proposed Policies to Promote Portfolio Diversification
finance theory have built different measurement portfolio comparison
The proposed policies to promote portfolio diversification activities
methods. However, there have been few practical application researches in
are improving the regulatory and market management framework, introducing
Vietnam stock market and no research has thoroughly systemized the Modern
supporting policies to improve demand, attracting professional investors,
Portfolio Theory in Vietnam stock market.
improving market grading, building credit rating regulations, setting up credit
With the scientific and practical foundation in Vietnam stock market,
rating agencies in Vietnam, introducing supply side policies such as
the author focuses on systemizing different schools of theories in portfolio
facilitating privatization of government companies and developing derivative
diversification of investors, summarizes empirical researches, draws lessons
products, developing collateral and short selling business, improving
learned on portfolio diversification in markets similar to Vietnam (emerging
monetary and fiscal policies and enhancing communication among
markets and frontier markets). On the other hand, the author also examines the
companies, organizations and the authority.
current portfolio diversification of organizations and investors in the market in
3.4. Suggestions for professional investors
order to point out the achieved results, existing problems, reasons for limits,
thus offering solutions to improve investment efficiency through portfolio
In order to take an active part in portfolio diversification to
diversification on Vietnam stock market from 2007 to 2017.
outperform the market, depending on the investment strategy, risk appetite of
each investment fund, professional investment managers in Vietnam stock
Main achievements of the dissertation include:
market ought to consider the appropriate diversification strategies. However,
Firstly, the author systemizes and clarifies the portfolio diversification
the conclusions drawn from this dissertation are important empirical
theory, theories and models relating to portfolio selection and portfolio
evidences for investors to evaluate their investment and risk management
diversification in emerging and frontier markets and the lessons for Vietnam;
strategy. In addition, analysis on coefficient beta from the CAPM model also
Secondly, holding 24 stocks and Treasury bond can outperform the
provides insights into market participation methods as well as entry and exit
VNI, which represents the market. Therefore, it can be concluded that
20
application of portfolio diversification theory does bring good results in
Despite considerable efforts, there are certain limits in the dissertation
Vietnam stock market;
due to time limit and research method. However, this is a foundation for
future empirical researches in portfolio diversification in Vietnam.
Thirdly, the main conclusions from empirical researches are: (i)
Investors can outperform the market by flexibly changing weight age of each
stock through each stage; (ii) more constraints and limits in portfolio
REFERENCES
management decrease the efficiency of portfolio diversification; (iii) the effect
1. Luu Tuan Linh, “Poftfolio diversification on stock market – From
of short selling compared to entering the treasury bond market is not clear if
the aim of investors is to outperform the market in profits. However, if
theory to practice in Vietnam”, Banking Science and Training
investors aim to outperform the market in terms of risk, entering the Treasury
Review, Vol 147, Aug 2014.
2. Luu Tuan Linh, “Some solutions to improve Treasury bond market”,
bond market is a better risk hedging tool compared to short selling;
Financial Market Journal, Vol 16(409), Aug 2014.
Fourthly, results of empirical researches in CAPM model show that:
(i) coefficient β < 1 for all categories in all stages of estimation, which means
profitability of all categories fluctuates more slowly than profitability of the
market in all phases; (ii) coefficient β fluctuates widely in different scenarios
where different levels of constraints and limits are applied to the portfolio
(with or without treasury bond, short selling allowed or not allowed);
Based on the analysis, evaluation and summarization, the author has
proposed policies for portfolio diversification on Vietnam stock market.
Especially, he focuses on directions to develop portfolio diversification on
Vietnam stock market, facilitating and removing constraints in portfolio
diversification, proposed policies to promote portfolio diversification such as
improving the regulatory framework, enhancing management and supervising
capabilities and demand side policies, attracting professional investors,
improving supply side policies and coordinating monetary, fiscal and other
macro policies.
21