Factors influencing employee commitment through the mediator job satisfaction - a study of office staffs in Ho Chi Minh City
Bạn đang xem bản rút gọn của tài liệu. Xem và tải ngay bản đầy đủ của tài liệu tại đây (592.05 KB, 17 trang )
112 Bui N. B. Khue & Ho N. Quang. Journal of Science Ho Chi Minh City Open University, 7(4), 112-128
FACTORS INFLUENCING EMPLOYEE COMMITMENT
THROUGH THE MEDIATOR JOB SATISFACTION - A STUDY
OF OFFICE STAFFS IN HO CHI MINH CITY
BUI NGUYEN BAO KHUE
International University - Vietnam National University HCMC -
HO NHUT QUANG
International University - Vietnam National University HCMC -
(Received: September 25, 2017; Revised: November 23, 2017; Accepted: November 29, 2017)
ABSTRACT
This paper examines the relationship between employee-related factors and employee commitment through the
mediator job satisfaction of office employees in Ho Chi Minh City. The conceptual model is adapted from previous
research and Herzberg’s two-factor theory. The theory emphasized the certain elements belonging to two categories
intrinsic and extrinsic value that lead to people’s satisfaction. Four factors include Training, Pay, Working
Environment, and Leadership. The data is collected through questionnaires from 422 office staffs in Ho Chi Minh;
then only 395 qualified responses are analyzed. SPSS and AMOS tools are used to analyze the data through
Reliability test, Model fit test, SEM method. The final result reveals that all factors are significantly related to Job
Satisfaction meaning these variables also have indirect positive relationship with Employee Commitment through
the mediator. This research is useful for organizations which aim to build the commitment strategy for keeping best
talents in the company.
Keywords: Commitment; Herzberg’s two-factor theory; Office staff; Satisfaction.
1. Introduction
According to Salary Report 2016 of three
credible recruitment consultancies in Vietnam
- Robert Walters, Adecco and Job Street,
Vietnam is one of the countries that has the
lowest salary rate in Asia region, the class of
workers with 1- 3 years’ experience whose
salary is 5-6 times lower than Singapore or 23 times lower than Malaysia. Particularly,
office staffs usually deal with the same kind
of job for a long time and they need to
accomplish their tasks as known as their
responsibilities in rush to keep pace with the
deadline. Moreover, most office employees
have to work intensely in the closed space that
causes some health problems and stress.
Nowadays, the development of advanced
technology helps people access a lot of
information sources than ever. People easily
search the work vacancies on the Internet,
which means employees can find new jobs
anytime and anywhere if they are no longer
interested in their current firms. Many
business owners worry about “switching job”
phenomenon so they try to find the ways that
motivate good employees who have long-term
commitment with their firms. Anis et al.
(2011) confirmed the bad effects caused by
employee turnover; organizations need to
maintain
their
current
employee’s
commitment. However, the staff members
have to satisfy their needs and requirements
before they commit to the firm so the
management team should pay attention to
employee
satisfaction
together
with
commitment strategy. Grobler (2005)
mentioned that employees need to satisfy their
self-fulfillment, so they have the tendency to
look for new jobs which are more challenging
and creative. Hence the more incentive on
Bui N. B. Khue & Ho N. Quang. Journal of Science Ho Chi Minh City Open University, 7(4), 112-128 113
factors related to employee satisfaction at
work, the more company can reduce the
turnover rate and retain employee. The main
purpose of this study is to examine the
relationship between the selected factors:
Training, Pay, Working Environment,
Leadership and office employee Commitment
through the mediator Satisfaction and find out
which
factors
affecting
Employee
Commitment. This study could be helpful for
companies which are still concerned with the
strategy to keep talented employees, giving
them a view on the real scenario and the
awareness of other problems that may occur
in
the
company’s
human
resource
management. With the research findings,
companies can know which factors play
important roles in successful employee
commitment strategy
2. Literature review
2.1. Job Satisfaction and Commitment
Hoppock (1935) defined job satisfaction
as any combination of psychological,
physiological
and
environmental
circumstances that make people honestly feel
satisfied with their job. Locke (1976) also
defined “job satisfaction is a pleasurable or
positive emotional state resulting from the
appraisal of one’s job or job experience”.
Organizational commitment is defined as “the
relative strength of an individual’s
identification with and involvement in a
particular
organization
and
can
be
characterized by a strong belief in and
acceptance of the organization’s goals and
values, willingness to exert considerable effort
on behalf of the organization and a strong
desire to maintain membership of the
organization” (Mowday, Porter, & Steer,
1982). After that in 1991, Meyer and Allen
developed their Three Component Model of
Commitment stating that organizational
commitment mainly includes the following
components:
affective
commitment,
continuance commitment and normative
commitment. These three components have an
impact on the feelings of employees regarding
to the organization that they work for. When
the employees are satisfied with their job, it
also affects the level of employee
commitment. Feinstein & Vondrasek (2001)
did the research in the tourism field and found
that the level of job commitment depended on
job satisfaction. It was also confirmed by Lam
et al (2003); the result showed the strong
impact of job satisfaction on organizational
commitment. Gaertner (1999) proved that
there exists the positive correlation between
employee satisfaction and commitment. In
other words, when employee has worked in
the organization for many years and they
become bored with their job, their attitudes
are more negative than before (Lee, 2013).
Similarly, Bateman and Strasser (1984)
posited that there was a positive relationship
between organizational commitment and job
satisfaction. This result is also supported by
Jermier & Berkes (1979); they discovered that
employees who were always satisfied with
their jobs would have a higher level of
commitment.
Employees
who
were
committed to their organization in the tourism
sector were willing to reach the goal and
target of the company. When they completed
the goal; it called “achievement”. In 1959,
Herzberg researched the factors affecting
people attitude at work. He classified the
essential factors into two dimensions Hygiene
and Motivation. Herzberg said that the
absence of Hygiene factors could lead to the
job dissatisfaction and the presence of
Motivation factors would increase the job
satisfaction. Based on Herzberg’s Two Factor
Theory, achievement is one of the factor that
causes the satisfaction, so the satisfaction now
is treated as the outcome of commitment, not
an antecedent (Lam, Pine, and Baum, 2003).
Therefore, this study hypothesizes the positive
relationship between Job Satisfaction and
Employee Commitment.
114 Bui N. B. Khue & Ho N. Quang. Journal of Science Ho Chi Minh City Open University, 7(4), 112-128
Table 1
Job Satisfaction Factors (Herzberg, 1976)
Factors Leading to Dissatisfaction (Hygiene)
Factors Leading to Satisfaction
( Motivation)
Company Policy
Achievement
Supervision
Recognition
Relationship with Boss
Work Itself
Work Conditions
Responsibility
Salary
Advancement
Relationship with Peers
Growth
2.2. Training
Mincer (1962) simply explained training
is an investment in procurement skills to
improve employee’s productivity. According
to the Edwin (1987), “Training is the act of
increasing knowledge and skills of an
employee for doing a particular job.” The
paper of Turkyilmaz et al. (2011) revealed
that training and personal development
significantly affect employee satisfaction of
220 employees in Istanbul Branch of Social
Security Department. Linking it to this
business human resource context, when firms
invest in their human resources in the form of
training, employees are pleased to receive the
knowledge and more willing to commit to the
firms. There are various types of training such
as on-the-job training, vocational training,
general and specific training, depending on
each context, HRM decides an appropriate
type for employees (Hassan, 2013).
According to Kulkarn (2013), the essential
object of training is to provide the availability
of skilled and well-trained employees who are
ready to contribute to the organizations. A
successful training session requires many
steps of preparation and evaluation due to its
effect on organization’s operation and budget.
Hence, this research proposes the positive
impact between Training and Employee Job
Satisfaction.
2.3. Working Environment
Kohun
(1992)
defined
Working
environment is the set of forces, actions and
other influential factors impacting on the
employee’s activities and performance.
Opperman (2002), Yusuf & Metiboba (2012)
defined working environment which consists
of three components technical environment,
the human environment and the organizational
environment in which technical Environment
is infrastructure and physical, technical factor
at the workplace. Human environment is the
interrelationship among people, leadership
and management and it can affect worker’s
morale (Clement, 2000; Stanley, 2003).
Organization environment is mediated task,
national environment (inputs) and process into
final products or service (output) (Akintayo,
2012). Yusuf & Metiboba (2012) also claimed
that employee behavior such as absenteeism,
low commitment, and apathy are related to
working environment. Brill, Weidemann,
Olsen, Keable & Bosti (2001) revealed that
the design of workspace has a huge effect on
employee commitment and satisfaction. Wells
& Thellen (2002) and Croasmun (2004)
suggested the working environment which has
enough privacy, quietude and suitable facility
for old employees inspires people with
motivation
and
satisfaction
whereby
contributes to employee commitment. As a
Bui N. B. Khue & Ho N. Quang. Journal of Science Ho Chi Minh City Open University, 7(4), 112-128 115
result, the next hypothesis is working
environment positively affects Employee Job
Satisfaction.
2.4. Leadership
There are many definitions of leadership;
however, in general, there is no unified
consensus and this is just the influence of one
person which leads to the actions or attitude of
other (Wakabi, 2013). According to Okumbe
(1998), leadership is the process encouraging
people to do something by their willingness,
not because they are afraid of suffering the
consequences or discipline. Mat (2008)
confirmed that people follow leader’s acts and
behaviors to achieve organization’s goals.
Dawley, Andrews, and Bucklew (2010)
studied
the
influence
of
perceived
organizational support, supervisor support and
job fit on employees’ turnover intention of 3
organizations. The paper showed that the
perceived organizational support, supervisor
support and job fit significantly impact
employee satisfaction and that resulted in the
high commitment. The recommended
hypothesis is the positive effect of Leadership
and Employee Job Satisfaction.
2.5. Pay
Obviously, people are looking for jobs
because of not only their passion but also
money. The most important reason for
working is that people need money to pay
everything for their lives and support their
families. In addition, it is one of reward tools
to help employees feel more positive at work
because employees perceive their efforts to be
recognized worthily (Silbert, 2005). Likewise,
Gardner et al., (2004) mentioned pay as a
motivator and technique of employee
commitment, Milkovich and Newman (2004)
expressed that among many types of rewards,
monetary pay is one of the most important
factors affecting satisfaction. Base pay and
contingent pay are two main elements of pay
whereas base pay is accounted for the largest
part of total reward package for most
employees (Green, 2010). There are many
different results conducted by earlier
researchers about the relationship between
pay and job satisfaction, some studies found
the positive correlation (Beutell & WittigBerman, 1999; Sanchez & Brock, 1996),
weak relationship (Dunham & Hawk, 1977
and Adams & Beehr, 1998). Judge (2010) did
a meta-analysis of the literature between pay
and job satisfaction. In general, pay level is
only marginally related to satisfaction. The
reason that leads to the different results may
come from people’s psychologies and
characteristics, for instance, Malka and
Chatman (2003) suggested that people with
more extrinsic value orientations tightly link
the level of satisfaction to the level of income.
A lot of researchers found the positive
relationship between pay and job satisfaction
because pay is seen as the critical reason that
causes overall satisfaction (Smith, Kendall, &
Hulin, 1969; Hulin, 1991; Heneman & Judge,
2000). Thus, Pay has the positive relationship
with Employee Job Satisfaction.
Based on the literature review of much
empirical research, the model contains
popular variables that frequently appear in
previous studies. The conceptual model is
adapted from Herzberg two-factor theory. Job
satisfaction will enhance if the employees can
access
to
nice
workplace
training,
environment, leadership styles and reward
(Chen, 2006; Payne, 2005; Mohammad &
Hossein, 2006).
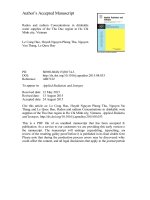
The hypotheses for this research are
summarized as following:
H1: Training positively affects Employee
Job Satisfaction.
H2: Working Environment positively
affects Employee Job Satisfaction
H3: Leadership positively affects
Employee Job Satisfaction
H4: Pay positively affects Employee Job
Satisfaction
H5: There is a positive relationship
between Job Satisfaction and Employee
Commitment
116 Bui N. B. Khue & Ho N. Quang. Journal of Science Ho Chi Minh City Open University, 7(4), 112-128
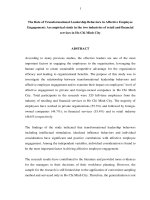
Independent Variables
Training
H1
Dependent Variable
Mediating Variable
Working
Environment
Leadership
H2
H3
Job
Satisfaction
H5
Employee
Commitment
H4
Pay
Figure 1. Proposed Conceptual Framework
Source: Alshanbri et al. (2015) and Herzberg (1976)
3. Research methodology
This research uses the quantitative
approach to obtain the purpose of the study.
The quantitative research tries to gather data
by objective methods and provides
information about relations, comparisons, and
predictions and removes the investigator from
the investigation (Smith, 1983). In this case,
the AMOS technique is mainly run to analyze
the data, information that got from survey
with initial support from SPSS so that the
study has the most accurate result. The survey
is continually chosen as the main method with
questionnaire tool to collect primary data. The
questionnaires were directly sent to 422
people who are classified as the office
workers in Ho Chi Minh City, spreading from
under 20 to over 46 years old.
The questionnaire is synthesized based on
the previous study such as Koikai (2014),
Msengeti (2015) and Achieng’Nyaura (2016),
so that the measurement scale presents a high
reliability. The questionnaire is divided into
two sections: Demographic details and
Perceived Relationship among the factors.
Each factor includes five measurement
statements using Likert scale which spreading
from Strongly Disagree to Strongly Agree.
4. Results and discussion
4.1. Sample Demographics
The data collected by online and offline
surveys to achieve 422 responses from the
office staffs in Ho Chi Minh City in 2017.
However, after eliminating the unqualified
responses, 395 qualified questionnaires are
used to analyze the data result. The number of
Female respondents is 68.61% which is
double the number of Male and the dominant
range is from 20-30 years old (69.62%)
4.2. The Cronbach’s Alpha Reliability Test
This research uses the Cronbach's Alpha
reliability test before analyzing the EFA to
exclude inappropriate variables because they
can produce dummy factors. Acceptable
values of alpha have a range from 0.70 to 0.95
(Nunnally, 1994; Bland, 1997; DeVellis,
2013). If the value is less than 0.6, the number
of item in the questionnaire is low or the
measurement questions are not inter-related to
each other. Moreover, it is impossible to get
the value greater than 0.9. This value indicates
that the items are redundant and duplicate; the
survey consists of many same questions but
different.
Bui N. B. Khue & Ho N. Quang. Journal of Science Ho Chi Minh City Open University, 7(4), 112-128 117
Table 2
Cronbach’s Alpha Results ways of expressing (McClelland, 1980).
Number or Items
Cronbach's Alpha
Training
5
.898
Pay
5
.788
Working Environment
5
.829
Leadership
5
.855
Job Satisfaction
5
.769
Employee Commitment
5
.858
The Cronbach’s Alpha for all variables
range from .769 to .898 depicts the moderate
consistency among internal items. Especially
Training has Cronbach’s Alpha value.898
illustrates that all items measuring training are
reliable and consistent. Because the results
satisfy the requirements for Reliability test
thus there is no variable to be eliminated and
the measurement scales are appropriate for
EFA analysis.
4.3. Exploratory Factor Analysis (EFA)
After running Cronbach’s Alpha test, the
second assessment to test the validity of all
variables is EFA. This method evaluates two
important values of the scale: Converging
Table 3
Factor Analysis – Independent variables
1
Train4
.871
Train3
.862
rain2
.846
Train5
.811
Train1
.612
2
Env2
.794
Env5
.754
Env1
.719
Env4
.661
3
4
value and distinctive value. EFA helps to
rearrange the scale into multiple sets. The
variables belonging to the same set
will measure the same concept. It is based on
the
correlation
between
variables
(interrelationships). Promax rotation and
Principal axis factoring are chosen to run EFA
test for independent variables and Principal
Component is applied for mediator and
dependent variables. As the adjusted outcome
of EFA and Reliability test, there are 18 items
belonging to 4 groups of components. The
final EFA result is reached at the third time
after deleting unqualified measurement scales
PAY4, PAY5.
118 Bui N. B. Khue & Ho N. Quang. Journal of Science Ho Chi Minh City Open University, 7(4), 112-128
1
2
Env3
3
4
.589
Lead4
.798
Lead5
.751
Lead3
.720
Lead1
.650
Lead2
.517
Pay3
.912
Pay1
.569
Pay2
.488
This is the final EFA result for 4
independent variables; all component variables
are regrouped into the same set of measurement.
Both mediating and dependent variables are also
grouped perfectly in EFA test. In the meantime,
KMO and Barlett’s Test is conducted in table 3
in order to present the appropriateness of factor
analysis with actual data.
Table 4
KMO and Barlett’s Test
Independent Variables
Mediating Variable
Dependent Variable
KMO index
.889
.753
.833
Sig.
.000
.000
.000
Cumulative %
55.622
52.964
64.660
KMO value of independent variables is
.889, Bartlett's Test of Sphericity is significant
with p-value .000 (<.05). Moreover,
Cumulative% is 55.622% meaning 4 factors
can explain for 55.622% of data variation and
observed items are correlated with each
factor. Hence EFA model is appropriate.
Similarly, The KMO value of Mediating and
Dependent Variables are .753 and .833
respectively depict good values so this
measurement shows the compatible with
actual data and good correlation among
observed variables. Cumulative % value of
Job Satisfaction and Employee Commitment
are 52.964 and 64.660% in turns proving that
the result is explained to 52.964% by Job
Satisfaction and 64.660% by Employee
Commitment in this research.
4.4. Confirmatory Factor Analysis (CFA)
CFA is a methodology determining the
relevance of research data to theoretical
models. In other words, it is used to test the
model fit. The CFA test includes
Unidimensionality which measures the
suitability of the model compared to research
data. The result of this research model is
compared with the cut off value of model-fit
measurement indices (Tucker & Lewis, 1973;
Bentler, 1990; Browne, 1993; Hair, 1992 and
Abedi, 2015).
Bui N. B. Khue & Ho N. Quang. Journal of Science Ho Chi Minh City Open University, 7(4), 112-128 119
Table 5
Unidimensionality result (CFA)
Fit Indices
Level of acceptance
Test result
Chi-Square (CMIN)
≠ 0 and p-value ≤ 0.05
916.137
p-value=.000
Statistical significance
Chisq/df (CMIN/DF)
≤ 3.0
2.735
Statistical significance
CFI
≥ 0.8
.897
Acceptable
TLI
≥ 0.8
.884
Acceptable
GFI
≥ 0.8
.850
Acceptable
RMSEA
< 0.08
.066
Acceptable
The result is satisfied with the standard
indices and it is statistically significant, so the
theoretical model of the topic is consistent
with the data collected in the market
Moreover, observed variables have
Comment
estimates of standardized regression weights
(Table 6) greater than 0.5 at the significant
level (P-value = 0.001) (Anderson & Gerbing,
1988), the CFA model obtains Convergent
validity.
Table 6
Standardized Regression Weights (CFA)
Train3
<---
Train
Estimate
.861
Train2
<---
Train
.829
Train4
<---
Train
.862
Env3
<---
Env
.682
Env2
<---
Env
.834
Env4
<---
Env
.623
Lead3
<---
Lead
.709
Lead2
<---
Lead
.805
Lead1
<---
Lead
.825
Lead4
<---
Lead
.671
Lead5
<---
Lead
.656
Com3
<---
Com
.841
Com2
<---
Com
.802
Com1
<---
Com
.685
Com4
<---
Com
.760
Com5
<---
Com
.648
120 Bui N. B. Khue & Ho N. Quang. Journal of Science Ho Chi Minh City Open University, 7(4), 112-128
Satis3
<---
Satis
Estimate
.582
Satis2
<---
Satis
.732
Satis1
<---
Satis
.761
Satis4
<---
Satis
.714
Satis5
<---
Satis
.418
Train1
<---
Train
.638
Train5
<---
Train
.818
Env1
<---
Env
.731
Env5
<---
Env
.640
Pay3
<---
Pay
.792
Pay2
<---
Pay
.606
Pay1
<---
Pay
.565
In the CFA, the discriminant value
indicates that this structure is really different
from other structures. If p-value ≤ 0.05, CFA
model obtains statistical significance. The
table below shows the significant p-value ≤
0.05 of all loading variables. Therefore, the
concepts in the model achieve discriminant
values.
Table 7
Regression Weights (CFA)
Estimate
S.E.
C.R.
P
Train3
<---
Train
1.311
.094
13.963
***
Train2
<---
Train
1.218
.090
13.598
***
Train4
<---
Train
1.257
.090
13.968
***
Env3
<---
Env
.912
.072
12.670
***
Env2
<---
Env
1.092
.072
15.240
***
Env4
<---
Env
.742
.064
11.583
***
Lead3
<---
Lead
.904
.060
15.042
***
ead2
<---
Lead
1.030
.058
17.663
***
Lead4
<---
Lead
.832
.059
14.020
***
Lead5
<---
Lead
.842
.062
13.651
***
Com3
<---
Com
1.341
.092
14.643
***
Com2
<---
Com
1.344
.095
14.106
***
Com4
<---
Com
1.385
.103
13.469
***
Label
Bui N. B. Khue & Ho N. Quang. Journal of Science Ho Chi Minh City Open University, 7(4), 112-128 121
Estimate
S.E.
C.R.
P
Com5
<---
Com
1.294
.111
11.678
***
Satis3
<---
Satis
.663
.060
11.054
***
Satis2
<---
Satis
.937
.067
14.092
***
Satis4
<---
Satis
1.012
.074
13.731
***
Satis5
<---
Satis
.569
.073
7.843
***
Train5
<---
Train
1.247
.093
13.466
***
Env5
<---
Env
.728
.061
11.888
***
Pay3
<---
Pay
1.547
.169
9.162
***
Pay2
<---
Pay
1.331
.157
8.463
***
Besides Cronbach’s Alpha test, AMOS has
another assessment to confirm the reliability of
scale that is the concept of Composite
Reliability and Variance Extracted. The
equations calculate Composite Reliability (CR)
and Average Variance Extracted (AVE)
developed by Hair et al. (1998) are used to
calculate. When CR and AVE of each potential
Label
factor variable shave value ≥ 0.5, CFA model
obtains synthesis reliability. (Hair et al., 1998).
The result shows the good value of each factor’s
CR (>0.5), so does the AVE excepting the AVE
value of Satisfaction and Pay which are less
than 0.5. However, they are still acceptable
because the large value of CR then model
obtains synthesis reliability.
Table 8
Composite Reliability (CR) and Average Variance Extracted (AVE)
Variables
CR value AVE value
Train
0.90
0.65
Environment
0.83
0.50
Leadership
0.85
0.54
Pay
0.70
0.44
Employee Job Satisfaction 0.78
0.43
0.86
0.63
Employee Commitment
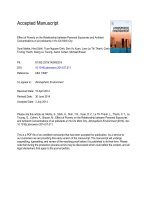
4.5. Structural Equation Modeling (SEM)
SEM is one of the most complex and
flexible techniques. SEM model combines all
the techniques such as multivariate regression,
factor analysis, and mutual relationship
analysis (among elements in a network
diagram) to allow us to examine the complex
relationship. Because the complication of
SEM model, many researchers visualized it by
path diagram to represent the clear
interrelationship among factors (Hair et al.,
2006)
122 Bui N. B. Khue & Ho N. Quang. Journal of Science Ho Chi Minh City Open University, 7(4), 112-128
Table 9
Standardized Regression Weights (SEM)
Estimate
Satis
<-- Train .099
Satis
<-- Env
.328
Satis
<-- Lead
.358
Satis
<-- Pay
.280
Commit <-- Satis
.749
The table shows the Estimate value in
Standardized Regression Weights are all
positive number at significant level p-value
0.05. Leadership has highest estimate value,
accounting for 35.8% the variance of Job
Satisfaction whereas the mediator Satisfaction
interprets up to 74.9% the variance of
Employee Commitment. The outcome shows
the relationships between independent
variables Training, Working Environment,
Leadership and Pay to mediator Satisfaction
which are significant with p-value < 0.05. And
the effect of Satisfaction on dependent variable
Commitment is supported by significant pvalue; thus none of these variables are removed
from the conceptual model.
Table 10
Summary of Hypotheses Testing
Standardized
P-value (level of
Conclusion
Regression Weight significance 0.05)
No
Hypothesis
1
H1: Training positively affects
Employee Job Satisfaction
.099
.032
Supported
2
H2:
Working
Environment
positively affects Employee Job
Satisfaction
.328
.000
Supported
3
H3: Leadership positively affects
Employee Job Satisfaction
.358
.000
Supported
4
H4: Pay positively affects
Employee Job Satisfaction
.280
.000
Supported
5
H5:There
is
a
positive
relationship
between
Job
Satisfaction
and
Employee
Commitment
.749
.000
Supported
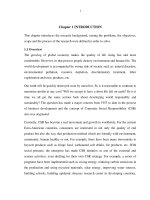
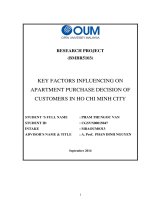
Bui N. B. Khue & Ho N. Quang. Journal of Science Ho Chi Minh City Open University, 7(4), 112-128 123
Training
.099*
Working
Environment
.328**
Job
Satisfaction
.358**
Employee
.749**
Commitment
Leadership
.280**
*
Pay
Figure 2. Testing Results of Structural Model by Using SEM-AMOS
Note: * p<0.05, ** p<0.01
The CFA model is analyzed again to test
the model fit. Overall, it still achieved the
good result after the model had an adjustment.
Hence the theoretical adjusted model of the
topic is consistent with the data collected in
the market according to SEM result.
Table 11
Final model fit result (SEM)
Fit Indices
Level of acceptance
Test result
Comment
Chi-Square (CMIN)
≠ 0 and p-value ≤ 0.05
933.015
p-value=.000
Statistical significance
Chisq/df (CMIN/DF)
≤ 3.0
2.752
Statistical significance
CFI
≥ 0.8
.895
Acceptable
TLI
≥ 0.8
.883
Acceptable
GFI
≥ 0.8
.849
Acceptable
RMSEA
< 0.08
.067
Acceptable
4.6. Bootstrap Test
The Bootstrap method introduced by
Efron (1979) which performed the sample
repeated N times. Estimated results from N
samples are averaged and this value tends to
close to the overall estimate. The smaller the
difference between the Bootstrap estimated
mean values and initial sample, the more
reliable the estimated model is. The bootstrap
test is applied in adjusted SEM model to
check the data of adjusted SEM being stable
and representative of the population.
According to Shrout (2002), Bootstrap’s
indicators include Critical Ratio and p-value.
After examining, the CR value is above 1.96
and all items have p-value > 0.05. Therefore,
the bias of this research is equal 0 at 95%
confident interval which means there is no
bias in the sample data and it can represent the
population (Hu, 2010). Therefore, the data of
124 Bui N. B. Khue & Ho N. Quang. Journal of Science Ho Chi Minh City Open University, 7(4), 112-128
this research is stable and representative.
4.7. Result Discussion
Overall, the results show the positive
relationship between the four factors Training,
Working Environment, Leadership and Pay
with mediator Job Satisfaction. Moreover, the
mediator Satisfaction explains approximately
75% of the dependent variable Commitment,
hence it leads to the positive impact of four
independent variables on job commitment.
All the hypotheses are accepted at the
significant level and they are in accordance
with the literature review such as Siebern
(2005) who conducted a study in 13 countries
from 1994 to 2001 and found that job
satisfaction will enhance if employees access
to workplace training. Wells & Thellen (2002
suggested the working environment inspires
people with motivation and satisfaction.
Payne (2005) revealed job satisfaction can be
consolidated by leaders who understand
clearly the organizations’ needs and spread
the enthusiasm to subordinates. Moyes and
Redd (2008) examined the job-related factors
affecting job satisfaction of accounting
professional and compensation has a positive
significant relationship to Job Satisfaction.
Referring to the result, Leadership has the
tightest relationship with Satisfaction (35.8%)
and Commitment, the leadership style has a
profound influence on employee’s attitude
and the management team should pay more
attention to this factor if they want to
consolidate the labor force.
5. Conclusion and recommendation
5.1. Conclusion
The main objective of this study is to find
the relationship between selected factors:
Training, Pay, Working Environment, and
Leadership and Office employee commitment
through the mediator Job Satisfaction. After
modification, the completed survey was
distributed to the office staff in Ho Chi Minh
City by online forms and papers. The result is
the same as previous research according to
literature review. The hypotheses are accepted
and the research have achieved the initial
objectives. There exist significant positive
relationships between four independent
variables:
Recognition,
Working
Environment,
Leadership,
Career
Development and mediator Job Satisfaction in
which Leadership takes the highest
percentages 35.8% in explaining Job
Satisfaction variable. Moreover, it can be
concluded that these four variables have
indirect positive relationship with Employee
Commitment through the mediating variable
Job Satisfaction.
5.2. The limitation of the study
Firstly, this study just collected 395
samples of office staffs in Ho Chi Minh. It
cannot cover all the Vietnamese companies.
Secondly, because of the time limitation, data
is collected by the open-ended questionnaire
and the statements already listed for people to
answer based on Likert Scale. The
participants cannot provide their own opinions
and evaluations. Finally, there are also many
factors that affect the performance but not
included in this study such as Job-itself, worklife balance etc. derived from Herzberg's
theory.
5.3. Recommendation
Leadership explains 35.8% to a variance
of Job satisfaction. The organizations are not
going to be successful if there is no
contribution from each employee. Hence,. the
management team should consult employees
when making decisions that are relevant to
their interests so that employees notice their
necessary role within the company, and their
dedication is valuable. Each leader continues
learning, cultivating his or her leadership
skills, timely modifies policies that cause
employee dissatisfaction, designs feedback
boxes that help employees freely contribute
their ideas to leaders, thereby helping each
other to increase work efficiency. Good
worker does not always become a wise leader
Bui N. B. Khue & Ho N. Quang. Journal of Science Ho Chi Minh City Open University, 7(4), 112-128 125
(Syptak, 1999). The supervisors have to
cultivate leadership skills, treat people fairly
and limit the negative comments.
Working Environment has a positive
relationship to Job satisfaction and increases
commitment so the companies should
facilitate for employees to work in a new
environment if possible. For example, one or
two days a week, they can sit next to their
favorite colleagues or work outside the office.
Company shall remodel the workspace to
promote cooperation and creativity but still
keep enough private space for each employee.
It cannot be denied that salary and
compensation are the most concern when
entering the new company. Management team
should always review the reward strategy in
association with other factors that influence
Job satisfaction such as companies’
recognition of employee’s good performance
by giving monetary reward or HR
departments’ regular review of base pay rate
and flexible contingent pay. Key Performance
Indicator is used not simply giving workers
benefit but also promoting people in their
career path which is an essential concern by
employees.
Furthermore, the improvement of the
training program is also the method to retain
key office employees. The training program
ought to be designed as short, concise and
with helpful content to reduce lassitude of
employees. Moreover, Cross-Training should
be applied since it decreases training cost for
organization and increases the working
process and peer relationship, Cross-Training
is when organization create an opportunity for
employees to enhance the proficiency levels
beyond their ordinary responsibility and
capture the workflow of other positions
(Vasanthi, 2017). As long as the members of
the group can understand other’s job, they are
more willing to support when someone needs,
thereby each worker can realize their latent
strength
References
Abedi, G., Rostami, F., & Nadi, A. (2015). Analyzing the Dimensions of the Quality of Life in Hepatitis B Patients
using Confirmatory Factor Analysis. Global journal of health science, 7(7), 22.
Achieng’Nyaura, L., & Omwenga, D. J. (2016). Factors Affecting Employee Retention in the Hotel Industry in
Mombasa County. Imperial Journal of Interdisciplinary Research, 2(12).
Adams, G. A., & Beehr, T. A. (1998). Turnover and retirement: A comparison of their similarities and differences.
Personnel Psychology, 51, 643−665.
Akintayo, D. (2012). Working environment, workers ‘morale and perceived productivity in industrial organizations
in Nigeria. Education Research Journal, 2(3), 87-93.
Alshanbri, N., Khalfan, M., Noor, M. A., Dutta, D., Zhang, K., & Maqsood, T. (2015). Employees’ turnover,
knowledge management and human recourse management: a case of Nitaqat program. International journal of
social science and humanity, 5(8), 701.
Anderson, J., Gerbing, W. (1988). Structural equation modeling in practice: A review and recommended two stage
approach. Psychological Bulletin, 27(1), 5-24.
Anis, A., Nasir, A., & Safwan, N. (2011). Employee retention relationship to training and development: A
compensation perspective. African journal of business management, 5(7), 26-79.
Bateman, T. S., & Strasser, S. (1984). A longitudinal analysis of the antecedents of organizational commitment.
Academy of management journal, 27(1), 95-112.
Bentler, P. M. (1990). Comparative Fit Indexes in Structural Models. Psychological Bulletin, 107, 238-246.
126 Bui N. B. Khue & Ho N. Quang. Journal of Science Ho Chi Minh City Open University, 7(4), 112-128
Beutell, N. J., & Wittig-Berman, U. (1999). Predictors of work–family conflict and satisfaction with family, job,
career, and life. Psychological Reports, 85(3, Pt 1), 893−903.
Bland J, Altman D. (1997). Statistics
10.1136/bmj.314.7080.572>.
notes:
Cronbach's
alpha.
Retrieved
from
Brill, M., Weidemann, S., Olsen, J., Keable, E., & Bosti (2001). Disproving widespread myths about workplace
design. Research report.
Browen, M., & Cudeck, R. (1993). Alternative Ways of Assessing Model Fit, in Testing Structural Equation Models.
Sage Publication.
Browne, M. W., & Cudeck, R. (1993). Alternative ways of assessing model fit. Sage focus editions, 154, 136-136.
Chen, H. C., & Baron, M. (2006). Nursing directors' leadership styles and faculty members' job satisfaction in
Taiwan. Journal of Nursing Education, 45(10).
Chung-Chieh, L., & Chen, C. J. (2013). The relationship between employee commitment and job attitude and its
effect on service quality in the tourism industry. American Journal of Industrial and Business
Management, 3(2), 196.
Clement, A. (2000). Correlates of workers improved morale and productivity in organizations. Journal of Economic
Studies, 8(2), 40-52.
Croasmun, J. (2004). Comfort Means Productivity
/>
for
Office
Workers
[online].
Retrieved
from
Dawley, D. D., Andrews, M. C., & Bucklew, N. S. (2010). Enhancing the ties that bind: mentoring as a moderator.
Career Deveoplement International, 15(3), 259-278.
DeVellis R. (2003). Scale development: theory and applications: theory and application. Thousand Okas, CA: Sage.
Dunham, R. B., & Hawk, D. L. (1977). The four-day/forty-hour week: Who wants it? Academy of Management
Journal, 20, 644−655.
Dunnette, M. D., & Hough, L. M. (1991). Handbook of industrial and organizational psychology, Vol. 2. Consulting
Psychologists Press.
Efron, B. (1979), Bootstrap methods: Another look at jackknife, Ann. Stat, 7, 1-26.
Feinstein, A. H., & Vondrasek, D. (2001). A Study of Relation- ships between Job Satisfaction and Organizational
Commitment among Restaurant Employees. Journal of Hospitality, Tourism, and Leisure Science, 1(4), 1-20.
Flippo, E. B. (1987). Personnel Management, 6th Edition, Singapore McGraw – Hill Book Company, 227- 245.
Gaertner, S. (1999). Structural Determinants of Job Satisfaction and Organizational Commitment in Turnover
Models. Human Resource Management Review, 9(4), 479-493.
Gardner, D. G., Dyne, L., & Pierce, J. L. (2004). The effects of pay level on organization-based self-esteem and
performance: a field study’. Journal of Occup. Organ. Psychology, 77(3), 307-322.
Greene, R. J. (2010). Effectively Managing Base Pay: Strategies for Success. Retrieved from the Society for Human
Resource Management.
Grobler, P.A. (2005). Human Resource Management in South Africa, 3rd Ed, London: Cengage Learning EMEA.
Hair, J. F., Black, W. C., Babin, B. J., Anderson, R. E., & Tatham, R. L. (1992). Multivariate Data Analysis. J.
Marketing, 54(2) 46–56.
Hassan, A. R., Qamar, R., Jaffir, R., & Sidra Suhail, W. (2013). The effect of training on employee retention. Global
Journal of Management and Business Research, 13(6).
Heneman, H. G., III, & Judge, T. A. (2000). Compensation attitude. In S. L. Rynes & B. Gerhart (Eds.),
Compensation in organizations: Current research and practice, 61−203.
Bui N. B. Khue & Ho N. Quang. Journal of Science Ho Chi Minh City Open University, 7(4), 112-128 127
Herzberg, F., Mausner, B., & Snyderman, B. B. (1959). The Motivation to Work. Retrieved on February 18, 2013
from />Hoppock, R. (1935). Job satisfaction. Oxford, England: Harper.
Hu, C., & Wang, Y. (2010). Bootstrapping in AMOS. Powerpoint. Consulté le, 23-02.
Hulin, C. L. (1991). Adaptation, persistence, and commitment in organizations. Retrieved from < psycnet.apa.org>.
Jermier, J. & Berkes, L. (1979). Leader behavior in a police command bureaucracy: A closer look at the quasimilitary model. Administrative Science Quarterly, 24, 1-23.
Judge, T. A., Piccolo, R. F., Podsakoff, N. P., Shaw, J. C., & Rich, B. L. (2010). The relationship between pay and
job satisfaction: A meta-analysis of the literature. Journal of Vocational Behavior, 77(2), 157-167.
Kohun, S. (1992). Business environment. Ibadan: University Press.
Koikai, P. K. (2014). Motivational factors influencing employee retention in multi purposes training institutions: a
survey of selected institutions in Kenya. Doctoral dissertation, University of Nairobi.
Kulkarni, P. P. (2013). A literature review on training & development and quality of work life. Researchers World,
4(2), 136.
Lam, T., Baum, T., & Pine, R. (2003). Subjective Norms: Effectives on Job Satisfaction. Annals of Tourism
Research, 30(1), 160-177.
Locke, E. A. (1976). The nature and causes of job satisfaction. Handbook of industrial and organizational
psychology.
Malka, A., & Chatman, J. A. (2003). Intrinsic and extrinsic orientations as moderators of the effect of annual income
on subjective well-being: A longitudinal study. Personality and Social Psychology Bulletin, 29, 737−746.
Mat, J. (2008). The Influence of Leadership Style on Internal Marketing in Retailing. PhD Thesis. University of
Stirling.
McClelland, D. C. (1980). Motive dispositions: The merits of operant and respondent measures. Review of
personality and social psychology, 1, 10-41.
Meyer, J. P., & Allen, N. J. (1991). A three-component conceptualization of organizational commitment. Human
resource management review, 1(1), 61-89.
Michigan Organizational Assessment Package (1975). Ann Arbor: Institute for Social Research, University of
Michigan.
Milkovich, G. M., & Newman, J. M. (2004). Compensation (8th ed.). Burr Ridge, IL: Irwin McGraw-Hill.
Mincer, J. (1962). On-the-Job Training: Costs, Returns, and Some Implications. Journal of Political Economy,
70(5), 50-79.
Mohammad, M. A., & Hossein, Y. M. (2006). A study of relationship between managers' leadership style and
employees' job satisfaction. Leadership in Health Services, 19(2), 11-28.
Mowday, R.T., Porter, L.W., and Steers, R.M. (1982). Employee-Organization Linkages: The Psychology of
Commitment, Absenteeism and Turnover. San Diego, CA: Academic Press.
Moyes, G. D., Cortes, A. C., & Lin, P. (2007). Determinants of job satisfaction and retention of Mexican-American
accounting professionals. Journal of Business & Economics Research, 5(5), 77-88.
Msengeti, D. M., & Obwogi, J. (2015). Effects of Pay and Work Environment on Employee Retention: A Study of
Hotel Industry in Mombasa County. International Journal of Scientific and Research Publications, Volume 5,
Issue 4, April 2015
Nunnally, J. C., & Bernstein, I. H. (1994). Psychometric theory (3rd ed.). McGraw-Hill, Inc New York, NY.
Okumbe, J. A. O. (1998) Educational Management: Theory and Practice. Nairobi University Press
Opperman C. S. (2002). Tropical business issues. Partner Price Water House Coopers.
128 Bui N. B. Khue & Ho N. Quang. Journal of Science Ho Chi Minh City Open University, 7(4), 112-128
Payne, H. J. (2005). Reconceptualizing social skills in organizations: Exploring the relationship between
communication competence, job performance, and supervisory roles. Journal of Leadership & Organizational
Studies, 11(2), 63-77.
Sanchez, J. I., & Brock, P. (1996). Outcomes of perceived discrimination among Hispanic employees: Is diversity
management a luxury or a necessity? Academy of Management Journal, 39, 704−719.
Shrout, P. E., & Bolger, N. (2002). Mediation in experimental and nonexperimental studies: New procedures and
recommendations. Psychological methods, 7(4), 422-445.
Siebern-Thomas, F. (2005) Job quality in European labour markets, in Bazen S., Lucifora C. and Salverda W.
(Eds.), Job Quality and Employer Behaviour, Palgrave Macmillan, Basingstoke, Hants, 31-66.
Silbert, L.T. (2005). The effect of Tangible Rewards on Perceived Organizational Support. Management Sciences.
Retrieved from <uwspace.uwaterloo.ca/bitstream/10012/872/1/lsilbert2005.pdf>.
Smith, P. C., Kendall, L. M., & Hulin, C. L. (1969). The measurement of satisfaction in work and retirement,
Chicago: Rand McNally.
Stanley, B. (2003). Middle level manpower development, skill acquisition and utilization in industries. Journal of
Organizational Behaviour, 8(2), 47-53.
Syptak, J. M., Marsland, D. W., & Ulmer, D. (1999). Job satisfaction: Putting theory into practice. Family Practice
Management, 6(9), 26.
Talentnet
and
Mercer
Total
Remuneration
Survey
(TRS)
(2016).
Retrieved
from
< />Tucker, L. R. & Lewis, C. (1973). The reliability coefficient for maximum likelihood factor analysis.
Psychometrika, 38, 1-10.
Turkyilmaz, A., Akman, G., Ozkan, C., & Pastuszak, Z. (2011). Empirical study of public sector employee loyalty
and satisfaction. Industrial Management & Data Systems, 111(5), 675-696.
Vasanthi, S. & Rabiyathul, B.S. (2017). Cross Training Employees – A Conceptual Review. International Journal
of Advanced Research in Science, Engineering and Technology, 4(3).
Wakabi, B. M. (2013). Leadership Style and Staff Retention in Organizations. International Journal of Science and
Research (IJSR) ISSN (Online): 2319-7064.
Wells, M. &Thelen, L. (2002). What does your workplace say about you? The Influence of personality status and
workplace on personalization. Journal of Environmental and Behaviour Sciences, 34(3), 300-321.
Wells, M. &Thelen, L. (2002). What does your workplace say about you? The Influence of personality status and
workplace on personalization. Journal of Environmental and Behaviour Sciences, 34(3), 300-321.
Yusuf, N. & Metiboba, S. (2012). Work environment and job attitude among employees in a Nigerian work
organization. Journal of Sustainable Society, 1(2), 36-43.