Assessment of salinity processes on rice-shrimp farming model in regions converted from agricultural lands to shrimp farming in Ca Mau province
Bạn đang xem bản rút gọn của tài liệu. Xem và tải ngay bản đầy đủ của tài liệu tại đây (481.21 KB, 8 trang )
Journal of Thu Dau Mot University, No 5 (18) – 2014
ASSESSMENT OF SALINITY PROCESSES
ON RICE-SHRIMP FARMING MODEL IN REGIONS
CONVERTED FROM AGRICULTURAL LANDS TO SHRIMP
FARMING IN CA MAU PROVINCE
Dinh Quang Toan(1), Nguyen Dinh Vuong(2), Ngo Ngoc Hung(3),
Nguyen Thi Mai Khoa(1)
(1) Thu Dau Mot University, (2) Southern Institute of Water Resources Research,
(3) Can Tho University
ABSTRACT
The conversion of inefficient agricultural and forest land to rice - shrimp farming model
in the Mekong Delta in general and Ca Mau province in particular has brought remark
benefits in terms of economic development. However, the introduction of salt water into some
freshwater regions have created environmental problems, which is not only impact on shrimp
farming but also on many other agricultural ecosystems. Land degradation and especially
soil salinization is a concern not only for soil scientists and environmentalists but also for the
land managers due to its multi-dimensional impact on national sustainable development. As
such, it should be considered and addressed urgently. The case study has shown actual state
as well as changes in visible soil salinity over time for the rice-shrimp farming model. ESP
(exchangeable sodium percentage ) value is likely to decrease according to availability of
rice crops and soil depth as well because there is rain water suppling during the harvest. At
some of the sample points (CN8, TPCM2, PT1), these are the abandoned fields and are
drained in preparation for next shrimp after the failure of rice sowing, therefore the level of
sodic soils has a tendency to increase according to shrimp crops. The process of deep salinity
has been shown through some sample points such as CN2, CN5, TB2, TPCM2, sodic soils of
the floor 20 - 40 cm is higher than the level of the floor 0-20 cm, desalination process has
only reduced the amount of salt in the surface.
Keywords: rice - shrimp, salinization, Ca Mau, sodic soils
*
1. INTRODUCTION
and brackish aquaculture ecosystem and a
In recent years, the ecology of Ca Mau
rice - shrimp rotational model. Developing
province has changed from its original
shrimp hatching contributed to raising inconatural ecosystem to a human-controlled
mes and improved living standards for the
ecosystem[12]. In 1999 to 2000, many
residents. However, the use of salt water for
agriculurally ineffiicient coastal areas were
shrimp hatching has generated many probconverted rapidly from a pure freshwater
lems in regard to soil quality and has effected
rice-based agriculture model to a saltwater
to other facets of agricultural ecology.
68
Tạp chí Đại học Thủ Dầu Một, số 5 (18) – 2014
Evaluating the state of salinity concentration in the soil in the region due to
shrimp hatching is necessary to ensure
sustainable development of the rice - shrimp
model. This research has the following
objectives: (i) Survey chemical process of
plant – rice – shrimp in Ca Mau province;
(ii) Evaluate soil sanility to the rice – shrimp
model in areas which have changed their
land use from the agriculture to the shrimp
hatching model.
2. MATERIALS AND METHODS
2.1. Selection of Sample Plots
57 sample points utilizing agriculturalaquicultural methods were selected for this
study. These points were largely distributed
in districts such as Cai Nuoc, Thoi Binh, and
Ca Mau. The choice of some sample points
was based the state land use and
environmental planning maps of Ca Mau.
To evaluate changing soil characteristics
and soil quality of agricultural – aquicultural
model, sampling was performed during the
growth period of the rice. Both the first and
the last of the last of crop were sampled.
At every sample point, sample soils were
taken at 5 locations following a diagonal and
mixed to become one sample. Sample soils
were taken at depth from 0 – 20 cm and 20–
40 cm. About 2 kg of sample soil was
collected and were stored in nylon bages.
2.2. Soil Sampling and Analysis
To determinate the salinity and sodic of
the study area, the indicators in soil samples
including pH, EC, Na+ saturated, CEC were
analyzed.
Table 1: Method analyzes some sample soils with some criterion
No
Parameter
Unit
Method
1
CEC
cmol/kg
Measured in a 0.1M BaCl2 extraction
2
Na+
cmol/kg
Extracted by BaCl2 0.1M, measured by atom absorbing machine
3
pH
-
Saturatedly extracted by distilled water, measured by pH indicator
4
EC
mS/cm
Saturatedly extracted by distilled water, measured by EC indicator
Table 2: Characteristics of saline, sodic and
saline-sodic soils
Sampling Period: 114 total samples were taken
from Aug 2011 to Dec 2011.
2.3. Classify soil based on salinity
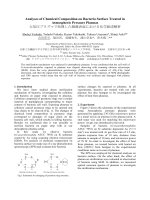
Exchange Sodium Percentage (ESP)
which were calculated based on cation
absorption ability of soil, CEC and Na
exchange by this formula [8,14]:
Classification
Na
100
CEC
Saline, sodic and saline-sodic soils are
differentiated on the basis of Exchange
Sodium Percentage (ESP), electrical conductivity, soil pH and their effects on soil
physical conditions (Table 2) [3,13].
Soil
pH
Electrical
Exchange
conductivity
Sodium
ECe
Percentage
(mS/cm)
ESP (%)
Saline
< 8,5
>4
< 15
High pH
> 7,8
<4
< 15
Saline - Sodic
< 8,5
>4
≥ 15
Sodic
> 8,5
<4
≥ 15
ESP
Source: Davis et al. (2007)
69
Journal of Thu Dau Mot University, No 5 (18) – 2014
areas because of the migration of salt water
into them. This made these agricultural areas
increasingly narrow, ineffective and unsustainable.
Based on the state of local land use
transition and aquaculture, samples were
randomly taken at transition areas. There
were 57 sample points which were taken at
Ca Mau city, Thoi Binh, Cai Nuoc and Phu
Tan district.
3.2. Chemical process of soil
a) Soil pH
Soil pH determination is an indication
of the acidity or alkalinity of the soil. Soil
pH requirements for good tree seedling
growth given in literature are generally
between pH (H2O) 5.0 and 7.0. Within this
pH range, microbial activity and nutrient
availability are considered optimal [5, 6].
3. RESULTS AND DISCUSSION
3.1. The status of using agricultural
land
Ca Mau province, which contains
464.769 ha of agricultural land, accounts for
87,78% total of natural areas in the
province. Agricultural lands are mainly
centered in the Dam Doi, U Minh and Tran
Van Thoi districts [5, 12]. At present, Ca
Mau province has 37.642 ha rice land which
is combined with shrimp hatching. These
areas are mainly at Cai Nuoc, Phu Tan, Dam
Doi, Thoi Binh district and a part of Tran
Van Thoi and Nam Can district [5,12].
Transition areas also occur at the
boundaries of freshwater areas. One reason
is spontaneous because the land use plan
and transition plan for agricultural
manufacture have not yet been combined.
So, many of these become saline/shrimp
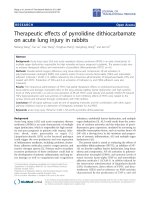
Figure 1. Frequency distribution of pH values in soil (0 – 20 cm and 20 – 40cm layer)
The results indicate, pH values is about
6.73 ± 0.79 in the 0 – 20 cm soil layer and
6.71 ± 0.84 in the 20 – 40 cm soil layer
(Figure 1). pH values of soil oscillate from
4.99 to 8.3 in the 0 -20 cm layer and from
3.63 to 8.23 in the 20 – 40 cm layer. pH
valuation of soil which has been impacted
by irrigation and salinity for many years see
an increase in pH values (Figure 2).
70
Tạp chí Đại học Thủ Dầu Một, số 5 (18) – 2014
Figure 2: Oscillation pH of soil at A (0-20 cm) layer and B (20 – 40 cm) layer between among
locations in the first and the end of the rice crop.
b) The Electrical conductivity of the soil
(EC)
interpretation of salinity standards. Salinity
should be defined in terms of the predisturbance land use potential, the proposed
postdisturbance land use, and the plant species
to be seeded on the site (Munshower, 1994).
Electrical conductivity (EC) is the most
common measure of soil salinity. By
agricultural standards, soils with an EC greater
than 4 dS/m are considered saline [1, 2, 4,11].
In actuality, salt-sensitive plants may be
affected by conductivities less than 4 dS/m
and salt tolerant species may not be impacted
by concentrations of up to twice this maximum agricultural tolerance limit. Thus, the
reclamation scientist must exercise care in
Follow this result, EC values is about
10.69 ± 3.73 in 0 – 20 cm soil layer and 6.71
± 0.84 in 20 – 40 cm soil layer (Figure 1).
The distribution of EC values range from
5.30 to 23.35 mS/cm in 0 – 20cm soil layer
and range from 3.92 to 17.81 mS/cm in 20 –
40cm soil layer. (Figure 3).
Figure 3. Frequency distribution of EC (mS/cm) values in soil (0 – 20 cm and 20 – 40cm layer)
The conductivity in surface layer is high
at the first of rice crop and decrease
gradually by the end of rice crop. This
happens because the effect of rainfall which
dilutes the salt concentration in the surface
layer. However, at locations CN8, TPCM2,
and PT1, the trend of EC value increases
with time (Figure 4), for the following
71
Journal of Thu Dau Mot University, No 5 (18) – 2014
reasons: (1) After the first sow spreadly, all
farmers didn’t use land for rice cultivation
(A)
anymore; (2) Farmers lead saline water into
the pond for shrimp hatching.
(B)
Figure 4: Oscillation EC in soil of A layer (0 – 20 cm) and B layer (20 – 40 cm) bewteen some
locations at the first and the end of rice crop. The vertical bar in the chart represents the standard
diviation value.
The salinity trend at Thoi Binh district is
lower than at Cai Nuoc, Phu Tan district and
Ca Mau city when analyzing some soil
samples; The salinity trend at Thoi Binh
district is lower than at Cai Nuoc, Phu Tan
district and Ca Mau city. This can be explained by the fact that the Thoi Binh district
is under the planning of north of Ca Mau.
That area is investing some important
irrigation projects which belong to desalination project of Ca Mau province. This
desalination project results in Thoi Binh
salination levels being more favourable than
other districts. However, if considering the
total salinity of all locations at the soil layer
as above it still exceed ecological threshold
of rice; which can't grow with these levels of
soil salinity. This is quite consistent with the
results of the actual survey.
The results also show that desalination
process is not thorough and salinity concentrates in the 20 – 40cm layer. This happened
because Ca Mau province occurred drought
and low rainfall.
c) Na+ cation
The distribution of Na+ concentration
value is about 9.0 ± 2.71 in the 0 – 20cm
layer and 8.12 ± 2.57 in the 20 – 40cm layer.
The frequency distribution of Na+ concentration value showed at Figure 5.
Figure 5. Frequency distribution of Na+ cation values in soil
(0 – 20 cm and 20 – 40cm layer.
72
Tạp chí Đại học Thủ Dầu Một, số 5 (18) – 2014
The concentration of Na+ in the 0 –
20cm layer tends to be greater than the 20 –
40cm layer in many study regions (Figure
6). This is explained by the cultivation
process involving the exchange of salt water
from canals outside and rice – shrimp fields
regularly. So, the deposition and accumulation of sodium (Na) at the lower layer is
less than at the surface layer. Following the
trend of the EC data, at some sample points
such as: CN8, TPCM2, PT1, the Na+ value
tends to decrease over time.
(A)
(B)
Figure 6. Na value of some samples at 2 layers: (A) 0 – 20cm and (B) 20 – 40cm. The vertical bar in
the chart represents to the standard diviation value.
+
d) CEC of the soils
CEC values of soil samples are shown
at Figure 7. The CEC values of the 0 – 20
cm layer range from average to high, the
lowest CEC value is 11.78 cmol(+) kg-1
(TB2), the highest CEC value is 27.69
cmol(+) kg-1 (PT1); CEC value in the 20 –
40cm layer changes from 11.93 cmol(+) kg-1
to 27.47 cmol(+) kg-1. CEC value don’t
correspondingly change with shrimp hatching time.
The cation exchange capacity (CEC) of a
soil is defined as the total sum of exchangeable cations that can adsorb at a specific
pH. Cation exchange of exchangeable cations
in reversible chemical systems is a quality
important in terms of soil fertility and yeild
nutrition studies. Mekong Delta soil often
contains more clay and less organic material
so the cation exchange capacity are average
to good (Hung Ngo Ngoc et al, 2004).
(A)
(B)
Figure 7. CEC value in soil of some samples at 2 layers: (A) 0 – 20cm and (B) 20 – 40cm). The
vertical bar in the chart represents to the standard diviation value.
73
Journal of Thu Dau Mot University, No 5 (18) – 2014
3.3. Soil classification in research
region
have used saline water for shrimp hatching
for a long period without following them
with effective desalination methods.
Weather and salination patterns contribute
as well. With high sodic concentration like
these, it would be so difficult for famers to
cultivate rice again because of the lengthy
time required to improve the soil.
All ESP values of samples exceed sodic
soil threshold (Table 1). ESP values tend to
decrease following the rice crop and with
decrease with depth of the soil because of
the addition of water to the rice crop. Some
samples points (CN8, TPCM2, PT1),
included fallow fields which had been
irrigated with salt water to prepare for the
next shrimp hatching after the failure of the
last crop. In such cases sodic level trend to
increase following said crop. Some sample
points such as: CN 2, CN5, TB2 and
TPCM2, sodic level of 20 – 40 cm layer is
higher than 0 – 20 cm layer. This result
could be explained as follows:
4. CONCLUSION
After a long time applying the shrimp
hatching – rice planting technology, it
causes the increase in the salinity and sodic
in soil that create the difficulty in salt
removing process. This situation is presented by the increase in EC, Na+ saturated
and ESP (>15%).
This study that suggests the solutions to
improve the quality of soil in area study
toward the sustainability of shrimp hatching
– rice planting model should have the
experimental researches about the salt
removing technology. To do this, the factors
including the total volume of using water,
the time to steep the lake, the improvement
technology after shrimp hatching season.
– Salinity has penetrated deeply at these
locations.
– The process of saline washing only
makes the salt at surface layer decrease
Therefore, at 2 layer 0 – 20cm and 20 –
40cm, soils of rice – shrimp model are saline
– sodic. This shows that all rice – shrimp
cultivation regions are saline because famers
*
ĐÁNH GIÁ DIỄN BIẾN ĐỘ MẶN TRÊN MÔ HÌNH CANH TÁC
LÚA – TÔM Ở TỈNH CÀ MAU
Đinh Quang Toàn(1), Nguyễn Đình Vượng(2), Ngô Ngọc Hưng(3),
Nguyễn Thị Mai Khoa(1)
(1) Trường Đại học Thủ Dầu Một, (2) Viện Khoa học Thủy lợi miền Nam,
(3) Trường Đại học Cần Thơ
TÓM TẮT
Việc chuyển đổi đất nông, lâm nghiệp kém hiệu quả sang mô hình canh tác lúa - tôm ở
đồng bằng sông Cửu Long nói chung và Cà Mau nói riêng đã mang lại lợi ích nhất định
trong phát triển kinh tế xã hội của địa phương. Tuy nhiên, quá trình chuyển đổi đã làm cho
môi trường và hệ sinh thái khu vực không ngừng biến đổi, không chỉ ảnh hưởng đến nuôi
tôm mà còn trên nhiều hệ sinh thái nông nghiệp khác. Một số vấn đề về môi trường bắt đầu
nảy sinh như mặn hóa đất đã và đang gây ra mối quan ngại về tính bền vững của mô hình
này. Qua nghiên cứu tại địa phương cho thấy, các thông số đặc trưng cho độ mặn trong đất
74
Tạp chí Đại học Thủ Dầu Một, số 5 (18) – 2014
gia tăng theo thời gian nuôi. Tại một số điểm mẫu (CN8, TPCM2, PT1) chỉ số này đã vượt
qua ngưỡng đất mặn nhiều (> 4mS/cm) gây bất lợi cho canh tác lúa và làm ảnh hưởng đến
tính bền vững của mô hình lúa – tôm.
REFERENCES
[1] Brady, N. and R. Weil, “The Nature and Properties of Soils”, 13th Edition, Prentice Hall.
Upper Saddle River, New Jersey. p.960, 2002.
[2] Corwin, D.L., and S.M. Lesch, “Application of soil electrical conductivity to precision
agriculture: theory, principles, and guidelines”. Agronomy Journal 95:455-471, 2003.
[3] Davis, J.G., Woscom, R.M., Boulder, T.A. and Cardam, G.E. “Managing sodic soils”.
Extension document No 0.504, Colorado, USA, 2007
[4] H. Ngo, “EC extraction method and the conversion for soil salinity classification of rice-shrimp
soil in the Mekong Delta”. Science and technology journal of Agriculture & Rural
Development. ISSN 0866-7020, p.41-45, 2010.
[5] K. Lam, T. Nguyen, V. Nguyen, H. Ngo, “Some characteristics of soil and water which are
concerned with sustainability of rice - shrimp model”, Agricultural Publishing House, 2009.
[6] L. Vanmechelen, R. Groenemans, E. Van Ranst. “Forest Soil Condition in Europe. Results of a
Large-Scale Soil Survey”. Technical Report. EC, UN/ECE, Ministry of the Flemish
Community; Brussels, Geneva, 1997.
[7] Majid Rashidi and Mohsen Seilsepour, “Modeling of soil exchangeable sodium percentage
based on soil sodium adsorption ratio”. ARPN Journal of Agricultural and Biological Science.
ISSN 1990-6145, p.22 – 26, 2008.
[8] Mohsen Seilsepour, Majid Rashidi, Borzoo Ghareei Khabbaz, “Prediction of Soil Exchangeable
Sodium Percentage Based on Soil Sodium Adsorption Ratio”. American-Eurasian J. Agric. &
Environ. Sci., 5 (1): 01-04, 2009. ISSN 1818-6769, p.1-4, 2009.
[9] Munshower, “Practical Handbook of Disturbed Land Revegetation”, Lewis Publ, 1994
[10] Rhoades, J.D, “Salinity: Electrical conductivity and total dissolved solids”, p.417-435, In D. L.
Sparks, ed. Methods of Soil Analysis. Part 3, Chemical Methods. Soil Science Society of
America Book Series; No. 5. Soil Science Society of America : American Society of
Agronomy, Madison, Wis, 1996.
[11] Rhoades, J.D., F. Chanduvi, and S.M. Lesch, “Soil Salinity Assessment: Methods and
Interpretation of Electrical Conductivity Measurements”. FAO Irrigation and Drainage Paper;
57. Food and Agriculture Organization of the United Nations, Rome. p.150, 1999.
[12] T. Le, N. Cao, “Assessment of agricultural land resource after converted to aquaculture in Ca
Mau peninsula region”. Ca Mau, November, 2004.
[13] U.S. Salinity Laboratory Staff, “Diagnosis and improment of saline and alkali soils”. U.S.,
Dept.Agr. Hanbook 60, 1954.
[14] Van de Graaff, R and Patterson, R.A., “Explaining the Mysteries of Salinity, Sodicity, SAR and
ESP in On-site Practice”. Published by Lanfax Laboratories, Armidale ISBN 0-9579438-0-6,
p.361 – 368, 2001.
75