Effect of different levels of zeolite and nitrogen on grain yield and nutrient uptake of maize grown in red soil
Bạn đang xem bản rút gọn của tài liệu. Xem và tải ngay bản đầy đủ của tài liệu tại đây (373.68 KB, 11 trang )
Int.J.Curr.Microbiol.App.Sci (2019) 8(6): 248-258
International Journal of Current Microbiology and Applied Sciences
ISSN: 2319-7706 Volume 8 Number 06 (2019)
Journal homepage:
Original Research Article
/>
Effect of Different Levels of Zeolite and Nitrogen on Grain Yield and
Nutrient Uptake of Maize Grown in Red Soil
CH. Ravali*, K. Jeevan Rao, M. Srilatha and K. Suresh
PJTSAU, Rajendranagar, Hyderabad, 500030, India
*Corresponding author
ABSTRACT
Keywords
Maize, Zeolite,
Nitrogen, Grain
yield, and N, P, K
uptake
Article Info
Accepted:
04 May 2019
Available Online:
10 June 2019
The present study entitled “Influence of zeolite and nitrogen levels on grain yield and
nutrient uptake of maize grown in red soils,” was a pot culture study carried out in Green
House of Soil Science department, College of Agriculture, Rajendranagar, PJTSAU,
Hyderabad, Telangana state during kharif, 2018-19. The treatments consists of
combinations of 3 levels of nitrogen (100, 150, 200 kg ha-1) and 4 levels of zeolite (0, 2.5,
5, 7.5 t ha-1) along with a control in which only P and K were applied and they were
replicated thrice in a factorial completely randomized design. The results revealed that
application of 200 kg ha-1 nitrogen in combination with 7.5 t ha-1 zeolite (Z7.5 N200)
increased grain yield of maize which was on par with the treatment receiving 200 kg ha -1
nitrogen in combination with 5 t ha-1 zeolite (Z5.0 N200). The combination of 7.5 t ha-1
zeolite with 200 kg ha-1 nitrogen (Z7.5 N200) have significantly increased N, P, K uptake of
maize compared to rest of the treatments.
soil due to increased soil surface area and
cation exchange capacity (He et al., 2002).
So, in order to improve nitrogen uptake in
maize, zeolite can be used along with
inorganic fertilizers.
Introduction
Zeolites are among the most common
minerals present in sedimentary rocks. They
are
natural
crystalline
tectosilicates
(Szerement et al., 2014) exhibiting an open
three-dimensional structure containing cations
needed to balance the electrostatic charge of
the framework of silica and alumina
tetrahedral units. Pores and voids are the key
characteristics of zeolite materials (Ramesh et
al., 2011). Amendment of clinoptilolite
zeolite to sandy soils has been reported to
lower nitrogen concentration in the leachate
and to increase moisture and nutrients in the
Clinoptilolite promote better plant growth by
improving the use efficiency of fertilizers due
to its high adsorption rate, cation exchange,
catalysis and dehydration capacities. It has a
very high CEC (from 100 to 230 cmol kg-1).
Therefore, its application to the soil increases
the CEC of soils 2-3 times greater than other
types of minerals found in soils. Keeping this
in view, the mix of zeolite (Z) and nitrogen
248
Int.J.Curr.Microbiol.App.Sci (2019) 8(6): 248-258
(N) has been investigated to enhance soil
fertility and improve crop production.
separated from the cobs and grain yield was
calculated. The soil collected from B block of
student farm, College of Agriculture,
Rajendranagar is sieved through 2 mm sieve
and is analyzed for initial physical, physicochemical and chemical properties which are
presented in the Table 1.
Materials and Methods
The present investigation was carried out at
Professor Jayashankar Telangana State
Agricultural University (PJTSAU), College
Of Agriculture, and Rajendranagar which is
located in Ranga Reddy district of Telangana
state. The soil required for the present
experiment has been collected from B block
of student farm, College Of Agriculture,
Rajendranagar. The red soil required for the
experiment was collected from B-Block of
Student farm, College of Agriculture,
Rajendranagar. The clods in the soil were
broken down and the soil is sieved through 2
mm sieve and was mixed with zeolite as per
the treatments and after mixing of zeolite, the
pot is filled with soil @ 8 kg pot-1.
Plant nutrient analysis
Plant samples collected at 30, 60, 90 DAS and
at harvest were shade dried and kept in the hot
air oven at 60ºC - 80ºC until constant weight
is attained. The dried plant samples were then
powdered separately treatment wise and were
used for analyzing the nutrient contents.
The nitrogen content in the plant and grain
samples was determined by micro Kjeldal
distillation (Piper, 1966). For estimation of
phosphorous and potassium in plant and grain
samples were first digested in diacid mixture
(HNO3 and HClO4 in 9:4 ratio). In digested
extract the phosphorous content is determined
by Vanado-Molybdo phosphate yellow colour
method in Spectrophotometer at 420 nm and
potassium by Flame photometer as described
by Piper (1966).
The test crop used in this experiment was
maize (DHM 117). 4 levels of Zeolite (0, 2.5,
5, 7.5 t ha-1 i.e., 0, 8.93, 17.26, 26.79 g pot-1
respectively) and 3 levels of nitrogen (100,
150, 200 kg N ha-1 i.e., 357.14, 535.71, 714.28
mg pot-1respectively) were applied in
different treatments which were replicated
thrice. Phosphorous (P2O5) and Potassium
(K2O) were applied @ 60-60 kg ha-1 (24.29 24.29 mg pot-1) uniformly to all the
treatments including control (Z0N0). At the
end of the maturity stage, cob from each plant
from pot was harvested. Grains were
Nutrient uptake
The dry matter obtained from each treatment
and their respective nutrient contents were
used to compute nutrient uptake at 30, 60, 90
DAS and at harvest.
N/P/K content (%) X Dry matter (g pot-1)
-1
N/ P/K Uptake (mg pot ) =
100
The data recorded from the pot culture
experiment was statistically computed by
adopting factorial completely randomized
design using standard procedures (Rao, 1983).
The critical difference was used to evaluate
the effects of treatments.
Results and Discussion
Grain yield
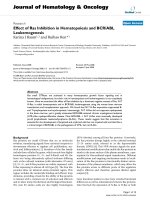
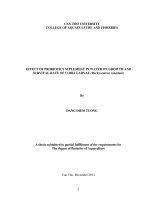
The grain yield of maize ranged from 14.86 to
46.80 g pot-1(Table 2 and Fig. 1). The grain
249
Int.J.Curr.Microbiol.App.Sci (2019) 8(6): 248-258
yield of maize was significantly improved by
application of different combinations of
nitrogen and zeolite levels. Among all the
treatments, N200 Z7.5 (Nitrogen @ 200 kg ha-1
+ Zeolite @ 7.5 t ha-1) resulted in higher grain
yield (46.80 g pot-1) which is on par with
N200Z5 (Nitrogen @ 200 kg ha-1 + Zeolite @ 5
t ha-1) where the grain yield recorded was
45.35 g pot-1. The lowest grain yield was
observed in control (14.86 g pot-1). Among
the three nitrogen levels, N200 produced
significantly higher grain yield (42.79 g pot-1
mean value) compared to other levels of
nitrogen. Among four zeolite levels, Z7.5
produced higher grain yield (36.62 g pot-1)
which is significantly superior over other
zeolite levels and control (14.86 g pot-1).
Phosphorous uptake
Nitrogen uptake
Increasing the zeolite dose have significantly
improved K uptake by maize from 208.42 mg
pot-1 in Z0 level to 268.05 mg pot-1 and
nitrogen levels also significantly improved K
uptake at 30 DAS. The zeolite level, Z7.5
(268.05 mg pot-1) recorded significantly
higher K uptake at 30 DAS compared to all
other zeolite levels while the lowest K uptake
was noticed in control (72.11 mg pot-1).
Among the nitrogen levels, highest K uptake
was registered in N200 (320.39 mg pot-1),
followed by N150 (235.79 mg pot-1) while the
interaction effect of zeolite and nitrogen on K
uptake at 30 DAS was non significant. K
uptake was significantly influenced by both
the levels of zeolite and nitrogen at 60, 90
DAS and at harvest (Table 13, 14, 15, 16, 17
respectively). N200Z7.5 showed highest K
uptake at 60, 90 DAS (549.23, 773.17 mg pot1
respectively) while the lowest K uptake was
observed in control (112.30, 160.45 mg pot-1
respectively). At harvest, the highest K uptake
in grain (210.59 mg pot-1) was observed in
Z7.5N200, which was significantly superior
over all other treatments followed by Z5N200
(191.97 mg pot-1) while the lowest K uptake
by grain was observed in control (26.75 mg
pot-1). In stover highest K uptake was
P uptake by maize at 30, 60, 90 DAS and at
harvest in grain and stover were represented
in table 8, 9, 10, 11, 12 respectively. Higher P
uptake at 30, 60, 90 DAS (75.09, 108.63,
180.88 mg pot-1 respectively) and at harvest
(118.53, 92.84 mg pot-1 by grain and stover
respectively table 11, 12) was observed in
Z7.5N200 treatment, but at 90 DAS, the P
uptake in Z7.5N200 treatment was on par with
Z5.0N200 (173.21 mg pot-1) which were
significantly superior over rest of the
treatments and control (11.84, 14.29, 31.57,
27.23, 12.12 mg pot-1 respectively).
Potassium uptake
N uptake was significantly affected by the
levels of zeolite and nitrogen at 30, 60, 90
DAS and at harvest (Table 3, 4, 5, 6, 7
respectively). Increasing the zeolite dose have
significantly improved N uptake from 179.30
mg pot-1 to 231.27 mg pot-1 and nitrogen
levels also significantly improved N uptake.
Highest N uptake was registered in N200
(275.86 mg pot-1), followed by N150 (204.50
mg pot-1) and N100 (136.30 mg pot-1), while
the interaction effect of zeolite and nitrogen
on N uptake at 30 DAS was non significant,
but it was significant at 60 and 90 DAS, by
stover. At 60 DAS, (465.37 mg pot-1) and 90
DAS, (1066.06 mg pot-1) significantly higher
N uptake was recorded with the treatment
Z7.5N200, followed by Z5N200 (442.22 mg pot-1,
1015.53 mg pot-1 respectively) while the
lowest N uptake at 60 and 90 DAS was
obtained from control (90.17 mg pot-1, 199.04
mg pot-1 respectively). At harvest, the highest
N uptake in grain (425.83 mg pot-1) and
stover (278.45 mg pot-1) was observed in
Z7.5N200, which was significantly superior
over all other treatments and the lowest N
uptake was found in control (26.91 mg pot-1).
250
Int.J.Curr.Microbiol.App.Sci (2019) 8(6): 248-258
observed in Z7.5N200 (591.72 mg pot-1)
followed by Z5N200 (566.98 mg pot-1) and the
lowest K uptake was found in control (162.04
mg pot-1).
Table.1 Properties of the experimental soil (Initial) and zeolite used in the experiment
Initial soil properties
S. No.
Property
1.
Sand (%)
2.
Silt (%)
3.
Clay (%)
4.
Soil Texture
pH
5
EC (dSm-1)
6
Organic Carbon (%)
7
Available N (kg ha-1)
Values
87.36
4.40
8.24
Loamy sand
7.08
0.45
0.57
177.00
Property
8.Available P (kg ha-1)
9. Available K (kg ha-1)
Zeolite properties
1.Water Absorption
2.Bulk Density (Mg m-3)
3. pH
4. EC (dS m-1)
5. CEC (cmol (p+) kg-1)
Values
15.48
380.66
90-100%
0.35-0.45
8.0 - 9.0
5.5
130-135
Table.2 Effect of different levels of nitrogen and zeolite on grain yield (g pot-1) of maize
Levels
N100
N150
N200
Mean (Z)
N
Z
Grain yield of maize (g pot-1)
Z0
Z2.5
19.50
22.87
29.73
33.30
38.10
40.89
29.11
32.36
SE(m) ±
CD (0.05)
0.26
0.78
0.31
0.90
Z5
25.35
34.67
45.35
35.12
NXZ
Z7.5
27.20
35.86
46.80
36.62
SE(m) ±
0.53
Mean (N)
23.73
33.39
42.79
CD (0.05)
1.55
*Control – 14.86 g pot-1
Table.3 Effect of different levels of nitrogen and zeolite on Nitrogen uptake (mg pot-1) of maize
at 30 DAS
Levels
N100
N150
N200
Mean (Z)
N
Z
Nitrogen uptake (mg pot-1)
Z0
Z2.5
116.57
126.53
178.50
198.13
242.83
273.03
179.30
199.23
SE(m) ±
CD (0.05)
2.64
7.76
3.05
8.97
Z5
138.33
213.23
285.67
212.41
NXZ
*Control – 60.69 mg pot-1
251
Z7.5
163.77
228.13
301.92
231.27
SE(m) ±
5.29
Mean (N)
136.30
204.50
275.86
CD (0.05)
NS
Int.J.Curr.Microbiol.App.Sci (2019) 8(6): 248-258
Table.4 Effect of different levels of nitrogen and zeolite on
Nitrogen uptake (mg pot-1) of maize at 60 DAS
N100
Nitrogen uptake (mg pot-1)
Z0
Z2.5
Z5
163.67
184.63
199.43
Z7.5
212.73
Mean (N)
190.12
N150
241.03
267.27
311.53
337.47
289.33
N200
Mean (Z)
364.67
256.46
402.20
284.70
442.22
317.73
465.37
338.52
418.61
N
Z
SE(m) ±
3.04
3.51
CD (0.05)
8.93
10.32
NXZ
SE(m) ±
6.09
CD (0.05)
17.87
Levels
*Control – 90.17 mg pot-1
Table.5 Effect of different levels of nitrogen and zeolite on Nitrogen uptake (mg pot-1) of maize
at 90 DAS.
N
Nitrogen uptake (mg pot-1)
Z0
Z2.5
299.96
358.89
539.74
597.81
783.35
861.16
541.02
605.95
SE(m) ±
CD (0.05)
5.19
15.22
Z
5.99
Levels
N100
N150
N200
Mean (Z)
Z5
430.19
669.29
1015.53
705.00
NXZ
Z7.5
495.74
727.69
1066.06
763.17
SE(m) ±
10.37
Mean (N)
396.19
633.63
931.52
CD (0.05)
30.45
17.58
*Control – 199.04 mg pot-1
Table.6 Effect of different levels of nitrogen and zeolite on Nitrogen uptake (mg pot-1) by maize
grain at harvest
Levels
N100
N150
N200
Mean (Z)
N
Z
Nitrogen uptake (mg pot-1)
Z0
Z2.5
Z5
Z7.5
Mean (N)
117.61
220.11
320.01
219.24
SE(m) ±
2.39
2.76
151.67
259.70
351.66
254.34
CD (0.05)
7.03
8.12
176.67
281.98
408.21
288.96
197.61
298.79
425.83
307.41
SE(m) ±
4.79
160.89
265.14
376.43
NXZ
*Control – 67.42 mg pot-1
252
CD (0.05)
14.06
Int.J.Curr.Microbiol.App.Sci (2019) 8(6): 248-258
Table.7 Effect of different levels of nitrogen and zeolite on Nitrogen uptake (mg pot-1) by maize
stover at harvest
Levels
N100
N150
N200
Mean (Z)
N
Z
Nitrogen uptake (mg pot-1)
Z0
Z2.5
Z5
36.90
104.11
205.07
115.36
SE(m) ±
1.70
1.97
51.38
124.60
221.74
132.57
CD (0.05)
5.00
5.77
67.66
146.65
265.05
159.79
NXZ
Z7.5
Mean (N)
86.85
178.80
278.45
181.37
SE(m) ±
3.41
60.70
138.54
242.58
CD (0.05)
10.00
*Control – 26.91 mg pot-1
Table.8 Effect of different levels of nitrogen and zeolite on phosphorous uptake (mg pot-1) by
maize at 30 DAS
Levels
N100
N150
N200
Mean (Z)
N
Z
P uptake (mg pot-1)
Z0
Z2.5
22.94
25.45
32.77
43.56
46.56
66.57
34.09
45.20
SE(m) ±
CD (0.05)
0.69
2.03
0.80
2.35
Z5
28.15
48.29
69.86
48.76
NXZ
Z7.5
34.25
53.66
75.09
54.33
SE(m) ±
1.38
Mean (N)
27.70
44.57
64.52
CD (0.05)
4.06
*Control – 11.84 mg pot-1
Table.9 Effect of different levels of nitrogen and zeolite on phosphorous uptake (mg pot-1) by
maize at 60 DAS
Levels
N100
N150
N200
Mean (Z)
N
Z
P uptake (mg pot-1)
Z0
Z2.5
27.65
30.67
38.09
51.99
61.29
90.71
42.35
57.79
SE(m) ±
CD (0.05)
0.67
1.98
0.78
2.28
Z5
33.57
61.18
103.10
65.95
NXZ
* Control – 14.29 mg pot-1
253
Z7.5
40.02
68.74
108.63
72.46
SE(m) ±
1.35
Mean (N)
32.98
55.00
90.93
CD (0.05)
3.95
Int.J.Curr.Microbiol.App.Sci (2019) 8(6): 248-258
Table.10 Effect of different levels of nitrogen and zeolite on phosphorous uptake (mg pot-1) by
maize at 90 DAS
Levels
N100
N150
N200
Mean (Z)
N
Z
P uptake (mg pot-1)
Z0
Z2.5
50.45
79.83
121.49
83.92
SE(m) ±
1.48
1.71
58.40
96.56
146.17
100.38
CD (0.05)
4.36
5.03
Z5
Z7.5
Mean (N)
68.25
113.03
173.21
118.16
78.19
122.44
180.88
127.17
SE(m) ±
2.97
63.82
102.97
155.44
NXZ
CD (0.05)
8.72
*Control – 31.57 mg pot-1
Table.11 Effect of different levels of nitrogen and zeolite on phosphorous uptake (mg pot-1) by
maize grains
Levels
N100
N150
N200
Mean (Z)
N
Z
P uptake (mg pot-1)
Z0
Z2.5
39.65
45.00
60.42
74.36
83.82
99.50
61.30
72.95
SE(m) ±
CD (0.05)
0.98
2.87
1.13
3.33
Z5
54.13
77.45
111.89
81.16
NXZ
Z7.5
57.02
81.28
118.53
85.61
SE(m) ±
1.97
Mean (N)
48.95
73.38
103.44
CD (0.05)
5.77
*Control – 27.23 mg pot-1
Table.12 Effect of different levels of nitrogen and zeolite on phosphorous uptake (mg pot-1) by
maize Stover
Levels
N100
N150
N200
Mean (Z)
N
Z
P uptake (mg pot-1)
Z0
Z2.5
17.41
22.03
30.32
46.36
52.72
33.48
SE(m) ±
0.96
0.83
73.91
47.43
CD (0.05)
2.45
2.83
Z5
27.45
52.67
Z7.5
31.30
57.42
Mean (N)
24.55
46.69
85.15
55.09
92.84
60.52
SE(m) ±
1.67
76.16
NXZ
*Control – 12.12 mg pot-1
254
CD (0.05)
4.90
Int.J.Curr.Microbiol.App.Sci (2019) 8(6): 248-258
Table.13 Effect of different levels of nitrogen and zeolite on potassium uptake (mg pot-1) by
maize at 30 DAS
Levels
N100
N150
N200
Mean (Z)
N
Z
K uptake (mg pot-1)
Z0
Z2.5
136.86
147.70
206.57
227.39
281.81
315.47
208.42
230.19
SE(m) ±
CD (0.05)
2.95
8.67
3.41
10.01
Z5
160.60
246.91
331.17
246.22
NXZ
Z7.5
188.72
262.31
353.13
268.05
SE(m) ±
5.90
Mean (N)
158.47
235.79
320.39
CD (0.05)
NS
*Control – 72.11 mg pot-1
Table.14 Effect of different levels of nitrogen and zeolite on potassium uptake (mg pot-1) by
maize at 60 DAS
Levels
N100
N150
N200
Mean (Z)
N
Z
K uptake (mg pot-1)
Z0
Z2.5
198.94
210.38
275.28
308.40
423.81
472.49
299.34
330.42
SE(m) ±
CD (0.05)
3.69
10.83
4.26
12.50
Z5
224.07
359.47
523.58
369.04
NXZ
Z7.5
240.59
393.06
549.77
394.47
SE(m) ±
7.37
Mean (N)
218.50
334.05
492.41
CD (0.05)
21.65
*Control – 112.30 mg pot-1
Table.15 Effect of different levels of nitrogen and zeolite on potassium uptake (mg pot-1) I by
maize at 90 DAS
N100
K uptake (mg pot-1)
Z0
Z2.5
240.60
274.01
Z5
320.49
Z7.5
366.02
Mean (N)
300.28
N150
400.35
446.11
492.00
532.22
467.67
N200
567.74
619.20
735.71
773.17
673.95
Mean (Z)
402.90
SE(m) ±
3.53
4.07
446.44
CD (0.05)
10.35
11.96
516.07
557.13
SE(m) ±
7.05
CD (0.05)
20.70
Levels
N
Z
NXZ
*Control – 160.45 mg pot-1
255
Int.J.Curr.Microbiol.App.Sci (2019) 8(6): 248-258
Table.16 Effect of different levels of nitrogen and zeolite on potassium uptake (mg pot-1) by
maize grain
N100
N150
K uptake (mg pot-1)
Z0
Z2.5
38.99
53.39
83.28
104.40
Z5
63.38
115.55
Z7.5
73.43
129.08
Mean (N)
57.30
108.08
N200
144.82
167.66
191.97
210.59
178.76
89.03
SE(m) ±
1.07
1.24
108.48
CD (0.05)
3.15
3.63
123.64
137.70
SE(m) ±
2.14
CD (0.05)
6.93
Levels
Mean (Z)
N
Z
NXZ
*Control – 26.75 mg pot-1
Table.17 Effect of different levels of nitrogen and zeolite on potassium uptake (mg pot-1) by
maize stover
Levels
N100
N150
N200
Mean (Z)
N
Z
K uptake (mg pot-1)
Z0
Z2.5
209.50
249.63
344.75
387.15
488.28
503.00
347.51
379.93
SE(m) ±
CD (0.05)
2.82
8.29
3.26
9.57
Z5
284.58
416.33
566.98
422.63
NXZ
Z7.5
315.84
439.87
591.72
449.14
SE(m) ±
5.65
Mean (N)
264.89
397.03
537.50
CD (0.05)
16.57
*Control – 162.04 mg pot-1
Fig.1 Effect of different levels of nitrogen and zeolite on grain yield (g pot-1) of maize
The combined application of nitrogen with
zeolite, increased the grain yield of maize due
to the slow and controlled release of nitrogen
from zeolite and thus making availability of
nitrogen throughout the crop growth period
which resulted in increased uptake, plant
256
Int.J.Curr.Microbiol.App.Sci (2019) 8(6): 248-258
height, number of grains per row and test
weight, which ultimately lead to increase in
the grain yield. These results were
comparable
to
results
obtained
by
Manikandan and Subramanian (2016) where
the grain yield of maize in alfisols was
increased in zeourea treatment. The
enhancement of maize yield with application
of zeolite @ 200 kg ha-1 compared to without
application of zeolite was also reported by
Weaks et al., (2011).
interaction between zeolite and nitrogen on K
uptake in rice plants was observed. There was
a significant influence of both zeolite and
nitrogen levels in increasing the K uptake at
60, 90 DAS and at harvest, due to less
leaching of potassium. This is because when
zeolites are mixed with soil, they help to
retain nutrients from the applied fertilizers in
the root zone. These results were in line with
the findings of Rabai et al., (2013), who
concluded that treatments with clinoptilolite
zeolite significantly increased K uptake in
maize stem, roots and leaves. Similar results
were also obtained by Ahmed et al., (2010),
who found that best K uptake from all plant
tissues of maize from the treatments with
zeolite.
The slow release pattern of nitrogen by zeolite
and reduction of leaching losses which
resulted in increased N availability in the
plant root zone might be the responsible
factor for enhanced nitrogen uptake. The
similar results were obtained by Lija et al.,
(2014), who reported that combination of
zeolite with compound fertilizer enhanced N
uptake in maize. Ahmed et al., (2008) (a)
found that zeolite had significantly improved
N uptake in maize and application of higher
doses of zeolite along with nitrogen enhanced
N uptake in rice grain and straw (Kavoosi,
2007).
References
Ahmed, O.H., Hussin, A., Ahmad, H.M.H.,
Rahim, A.A. and Majid, N.M.A. 2008.
Enhancing the Urea-N Use Efficiency
in Maize (Zea mays) cultivation on
Acid soils amended with Zeolite and
TSP. The scientific world journal. 8:
394–399.
Ahmed, O.H., Sumalatha, G. and Majid,
N.M.A. 2010. Use of zeolite in maize
(Zea mays) cultivation on nitrogen,
potassium and phosphorus uptake and
use efficiency. International Journal
of the Physical Sciences. 5(15): 23932401.
He, Z.L., Calvert, D.V., Alva, A.K., Li, Y.C.
and Banks, D.J. 2002. Clinoptilolite
zeolite and cellulose amendments to
reduce ammonia volatilization in a
calcareous sandy soil. Plant and Soil.
247: 253–260.
Kavoosi, M. 2007. Effects of Zeolite
application on rice yield, nitrogen
recovery and nitrogen use efficiency.
Communications in Soil Science and
Plant Analysis. 38:1-2, 69-76.
Manikandan, A. and Subramanian, K.S. 2016.
The increase in the P uptake in maize at
different stages with the addition of zeolite
may be due to increase in the P content in the
plant tissues and dry matter production. These
results were in accordance with the findings
of Ahmed et al., (2010) (b) who concluded
that irrespective of the treatments, addition of
zeolite significantly improved P uptake in
leaves, stems and roots of maize. P uptake in
stems, maize was significantly higher in
treatment with compound fertilizer mixed
with clinoptilolite zeolite (Rabai et al.,
(2013).
At 30 DAS there was no significant
interaction between zeolite and nitrogen on K
uptake in plants was observed which was in
correspondence with the results obtained by
Kavoosi (2007), where no significant
257
Int.J.Curr.Microbiol.App.Sci (2019) 8(6): 248-258
Evaluation of Zeolite based nitrogen
Nano-fertilizers on Maize growth,
yield and quality on Inceptisols and
Alfisols. International Journal of
Plant and Soil Science. 9(4): 1-9.
Piper, C.S. 1966. Soil and plant analysis.
Hans publishers, Bombay, pp: 137153.
Polat, E., Karaca, M., Demir, H. and Onus,
A.N. 2004. Use of natural Zeolite
(clinoptilolite) in agriculture. Journal
of Fruit and Ornamental Plant
Research. 12.
Rabai, K.A., Ahmed, O.H. and Kasim, S.
2013. Use of formulated nitrogen,
phosphorus, and potassium compound
fertilizer using clinoptilolite zeolite in
maize (Zea mays L.) cultivation.
Emirates Journal of Food and
Agriculture. 25 (9): 713-722.
Ramesh, V., George, J., Jyothi, S.J. and
Shibli, S.M.A. 2015. Effect of Zeolites
on Soil Quality, Plant Growth and
Nutrient Uptake Efficiency in Sweet
Potato (Ipomoea batatas L.). Journal
of Root Crops. 41(1): 25-31.
Rao, G.N. 1983. Statistics for Agricultural
Science. Oxford and IBH publications,
New Delhi.
Szerement, J., Ambrozewicz-Nita, A.,
Keaziora, K. and Piasek, J. 2014. Use
of zeolite in agriculture and
environmental protection. A short
review.
/>on/268504037_Use_of_zeolite_in_agr
iculture_and_environmental_protectio
n_A_short_review
Weaks, E.N., Raut, Y., Jahan, H. and Islam,
H.R. 2011. Zeolite effects on nitrogen
and phosphorus availability in soil.
/>m/webprogram/Handout/Paper79339/
Zeolite%2C%20Nitrogen%20and%20
Phosphoous.pdf
How to cite this article:
Ravali, CH., K. Jeevan Rao, M. Srilatha and Suresh, K. 2019. Effect of Different Levels of
Zeolite and Nitrogen on Grain Yield and Nutrient Uptake of Maize Grown in Red Soil.
Int.J.Curr.Microbiol.App.Sci. 8(06): 248-258. doi: />
258