Marketing pattern and marketing efficiency of organic large cardamon and ginger spices grown in East district of Sikkim, India
Bạn đang xem bản rút gọn của tài liệu. Xem và tải ngay bản đầy đủ của tài liệu tại đây (629.03 KB, 10 trang )
Int.J.Curr.Microbiol.App.Sci (2019) 8(5): 1359-1368
International Journal of Current Microbiology and Applied Sciences
ISSN: 2319-7706 Volume 8 Number 05 (2019)
Journal homepage:
Original Research Article
/>
Marketing Pattern and Marketing Efficiency of Organic Large Cardamon
and Ginger Spices Grown in East District of Sikkim, India
Archana Sharma and Amod Sharma*
Department of Agricultural Economics, Nagaland University SASRD,
Medziphema Campus, District: Dimapur - 797 106, Nagaland, India
*Corresponding author
ABSTRACT
Keywords
Large cardamom,
Ginger, Marketing,
pattern, Efficiency,
Spices
Article Info
Accepted:
12 April 2019
Available Online:
10 May 2019
The present study on marketing pattern and marketing efficiency of organic large
cardamom and ginger spices crops grown in East district of Sikkim state was initiated
during the year 2017 to 2019 with the selection of 80 numbers of respondents and it was
categorized into three groups viz., marginal, small and semi-medium size groups based on
available cultivable land under the both selected spices crops. To achieve the specific
objectives of the present study a multi stage purposive stratified random sampling method
was adopted. Further data reveals that on the selected farm size group the majority of the
respondents (50.00 per cent) belonged to small land holding with an area of 1.01 ha to 2.00
ha. While in the marketing of ginger, the highest cost was incurred by processor (Rs.6.08)
in Channel II followed by Producer (Rs1.5) in Channel I. The total marketing cost was
higher in Channel II (Rs. 7.42/Kg) than Channel I (Rs.3.21/Kg). Total marketing margin
was found to be the highest in Channel II (Rs.247.64) than Channel I (Rs.41.89). The
largest chunk of margin was enjoyed by the producers in Channel II (Rs.219.5 per Kg)
followed by processor in channel II (Rs.13.93 per Kg). On assessing efficiency, through
Conventional method it was found that Channel II was more efficient (4.72 per cent) as
compared to Channel I (2.21 per cent). Through Shepherd method also Channel II was
found to be more efficient (34.37 per cent) than Channel I (14.05 per cent). Through
Acharya’s method Channel II was found to be more efficient (0.86 per cent) than Channel
I (0.84 per cent), respectively. The producer’s share in consumer’s price was found to be
high in channel II (97.09 per cent) than Channel I (92.88 per cent), respectively.
Introduction
IFOAM defines organic agriculture as “a
production system that sustains the health of
soils, ecosystems and people. It relies on
ecological processes, biodiversity and cycles
adapted to local conditions instead of using
inputs with adverse effects. Organic
agriculture combines tradition, innovation and
science to promote fair relationships and a
good standard of life for all involved
(IFOAM, 2019).
Large cardamom (Amomum subulatum, Roxb)
is a member of the family Zingiberacea under
the order Scitaminae (Bisht et al., 2011). It is
1359
Int.J.Curr.Microbiol.App.Sci (2019) 8(5): 1359-1368
believed that Sikkim is the place of origin for
cardamom (Adhikari, 2016). Nepal is the
largest producer of large cardamom in the
world; more than 95.00 per cent of the
produce is marketed to India, the largest
exporter of large cardamom (Sharma et al.,
2018).
Ginger (Zingiber officinale Rosc.) is
cultivated in India, China, Japan, Indonesia,
Australia, Nigeria and West Indies. India is
the largest producer and consumer of ginger
in the world (Anonymous, 2018). It is one
among the regionally advantageous crops in
the Northeast India. Among North Eastern
States, Sikkim ranks third in area and fifth in
production as well as productivity (Rahman et
al., 2007).
Bhutia et al., (2017) in their paper entitled
“Post-harvest and value chain management of
large cardamom in hills and uplands” have
mentioned that the post-harvest value chain
consisted of growers, collectors, traders, and
exporters. The losses in the field vary from
5.00 to 10.00 per cent which may go up to
80.00 per cent in case of disease affected
materials. India exports large cardamom to
Australia, Canada, Pakistan, UK, etc. They
also mentioned that Singtam, Gangtok,
Jorethang, Rongli, and Mangan etc.are the
major local markets in Sikkim. Siliguri is the
main trade link from where it is distributed to
Guwahati, Kolkata and Delhi (Willan and
Larnold, 2008).
Agriculture marketing is not regulated in the
state so the marketing of horticultural produce
is unorganized. Largest fruits and vegetables
market is Kanchenjunga Complex in Gangtok
which is occupied by wholesalers and
retailers. NERAMAC, SIMFED and few
farmers’ groups and individuals have outlets
in the complex. There is no other facility
available as per the APMC guideline.
Government made effort to organize
horticulture trade by locating it under one
regulated market in East Sikkim but due to
non-interest of traders it could not be
implemented (Anon, 2017; APEDA, 2019).
Materials and Methods
Sikkim is a small state with only four districts
and sixteen sub-divisions. This state was
chosen primarily due to the lack of academic
research in the field of post-harvest as well as
marketing of organic spices. Spices are grown
in almost all the districts; however large
cardamom and ginger are the two major cash
crops and important source of income for the
farmers in the East district of Sikkim, which
is also a hub of all administrative activities.
For the present study out of total eight
developmental blocks two blocks were
selected randomly viz., Khamdong and Regu.
For the marketing cost and post-harvest
activities / information altogether 10 numbers
of marketing agencies were selected with the
help of FPO's and Progressive organic
farmers viz., 5 wholesalers and 3 retailers
along with two marketing institutes viz.
SIMFED and NERAMAC all are actively
functional in the state with the help of the
Assistant Managers of both the institutes.
Price variation in different marketing
channels
The marketing cost was calculated by
estimating the cost incurred in the process of
marketing of the two crops depending on their
channels.
Marketing margin
Marketing margin was calculated as follows.
MMi = SPi – (PPi + MCi)
Whereas: MMi = Marketing margin of the i-th
middleman,
1360
Int.J.Curr.Microbiol.App.Sci (2019) 8(5): 1359-1368
SPi = Selling price of the i-th middleman,
Price spread
PPi = Purchasing price of the i-th middleman,
Price spread is the difference between the
price paid by the consumer and the price
received by the producer. It mainly consists of
marketing costs and margins. The price spread
analysis was carried out as follows:
MCi = Marketing cost incurred by the i-th
middleman
Marketing efficiency
There are three methods of calculating
marketing efficiency. The degree of market
performance was calculated using all the three
methods as discussed below.
Ratio of output to input (Conventional
method)
ME = O / I x 100
Whereas: ME =
efficiency,
O = Value added,
I = Marketing cost
Index
of
marketing
Value added = Difference between the price
paid by the consumer to price received by the
producers.
Producer'
s share
in consumer'
s rupee
Producer'
s price
Consumer'
s price
x100
Results and Discussion
Marketing
pattern
and
marketing
efficiency of organic large cardamom
Large cardamom and ginger being spice
crops, farmers usually do not retain the
produce for family consumption. Thus, the
entire quantity of the produce is available as
marketable surplus. In the present study two
channels were identified in the marketing of
large cardamom.
Channel I: Producer - Wholesaler- Dealer
from terminal markets
Channel II: Producer - Auction centre Dealer from terminal markets
Shepherd’s method
ME = CP / MC
Whereas: ME = Index of marketing
efficiency,
CP = consumer’s purchase price and
MC= Total marketing cost.
Acharya’s method
MME= FP/ (MC +MM)
Whereas: MME = Modified measure of index
of marketing efficiency,
FP = Price received by farmer,
MM = Marketing margin,
MC = Total marketing cost.
Terminal market is one where the produce is
either finally disposed of to the consumers or
processors or assembled for export.
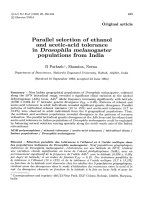
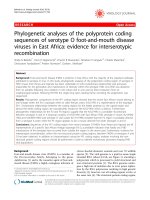
Table 1 reveals that the marketing cost
incurred by the intermediaries of two
channels in the marketing of large cardamom.
The Total marketing cost was found to be
higher in channel I (Rs.15.65/-per kg), as the
marketing cost was comparatively lower in
channel II (Rs. 6.80/- per kg) due to the
prevalence of auction system. It also shows
that the wholesalers incurred highest
marketing cost (Rs. 8.90/- per kg), followed
by producers (Rs. 3.50/- per kg) in Channel I,
respectively. Similar study was also carried
out by Sharma (2011) (Fig. 1–4).
1361
Int.J.Curr.Microbiol.App.Sci (2019) 8(5): 1359-1368
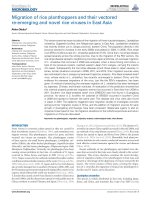
Table 2 reveals that the marketing margin of
the intermediaries at various stages of
marketing. Total marketing margin was found
to be the highest in Channel II (Rs. 1,151.50).
The largest chunk of margin was enjoyed by
the dealers from terminal markets in channel
II (Rs. 575.75/- per kg), followed by producer
in channel II (Rs. 573.20/- per kg),
respectively.
Table 3 reveals that the empirical assessment
of marketing efficiency of large cardamom.
Through Conventional method it was found
that Channel II was more efficient (30.26 per
cent) as compared to Channel I (17.89 per
cent), while through Shepherd method the
Channel II was found to be more efficient
(114.71 per cent) than Channel I (49.84 per
cent), respectively. Through Acharya’s
method Channel II was found to be more
efficient (0.99 per cent) than Channel I (0.95
per cent), respectively (Sharma and Sharma,
2014).
Table 4 reveals that the price spread in
marketing of large cardamom. The producer’s
share in consumer’s price was found to be
high in channel II (99.13 per cent) than
Channel I (97.99 per cent), respectively.
Similar study was also carried out by Sharma
(2011).
Marketing
pattern
and
efficiency of organic ginger
Marketing
While in the marketing of ginger two
channels were identified.
Channel I: Producer - Wholesaler - Retailer Consumer
Channel II: Producers - Processors
Wholesaler - Retailer - Consumer
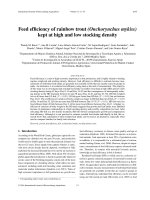
Table 5 reveals that the cost incurred by the
intermediaries in marketing of ginger. The
highest cost was incurred by processor (Rs
6.08/-) in Channel II, followed by Producer
(Rs 1.50/-) in Channel I, while the total
marketing cost was higher in Channel II (Rs
7.42 per kg) than Channel I (Rs 3.21 per kg),
respectively. Similar study was also carried
out by Sharma et al., (2016) (Fig. 5–8).
Table.1 Marketing cost of large cardamom (in Rs per kg)
Sl. No.
1.
2.
3.
4.
-
Category
Channel I
3.50
0.00
8.90
3.25
15.65
Producer
Auction centre
Wholesalers
Dealers from terminal markets
Total marketing cost
Channel II
1.00
2.55
0.00
3.25
6.80
Table2 Marketing margin of large cardamom
Sl. No.
Category
Producer
1.
Auction centre
2.
Wholesalers
3.
Dealers from terminal markets
4.
Total marketing margin
Channel I
496.50
0.00
15.10
511.60
1023.20
1362
Channel II
573.20
2.55
0.00
575.75
1151.5
Int.J.Curr.Microbiol.App.Sci (2019) 8(5): 1359-1368
Table.3 Marketing efficiency of large cardamom
Sl. No.
1.
2.
3.
4.
5.
Particulars
Channel I
Consumer's price (CP) (Rs / Kg)
780.00
Total marketing cost (MC) (Rs / Kg)
15.65
Total margins of intermediaries (MM) (Rs / Kg)
511.60
Price received by farmers (FP) (Rs / Kg)
500.00
Value added by the marketing system
280.00
Index of Marketing Efficiency (Percentage)
Conventional method
17.89
Shepherd's method
49.84
Acharya's method
0.95
6.
7.
8.
Channel II
780.00
6.80
575.75
574.20
205.80
30.26
114.71
0.99
Table.4 Price spread of large cardamom in different channels
Sl. No.
Particulars
Channel I
Channel II
1.
Terminal market price (Consumer’s price)
780.00
780.00
2.
Total marketing cost (Rs / kg)
15.65
6.80
3.
Total marketing margin (Rs / kg)
511.60
575.75
4.
Producer's share in consumer price (%)
97.99
99.13
Table.5 Marketing cost of ginger in different channels
Sl. No.
Category
Channel I
Channel II
1.
Producer
1.50
0.55
2.
Processor
0.00
6.08
3.
Wholesaler
0.96
0.28
4.
Retailer
0.75
0.52
3.21
7.42
Total marketing cost
Table.6 Marketing margin in different channels of ginger
Sl. No.
Category
Channel 1
Channel II
1.
Producer
36.50
219.50
2.
Processor
0.00
13.93
3.
Wholesaler
4.04
7.23
4.
Retailer
1.35
6.99
41.89
247.64
Total marketing margin
1363
Int.J.Curr.Microbiol.App.Sci (2019) 8(5): 1359-1368
Table.7 Marketing efficiency in different marketing channels of ginger
Sl. No.
Particulars
Channel I
Channel II
1.
Consumer's price (Rs/Kg)
45.10
255.00
2.
Total marketing cost (MC) (Rs/Kg)
3.21
7.42
3.
Total margins of intermediaries (MM)
(Rs/Kg)
41.89
247.63
4.
Price received by farmers(FP) (Rs/Kg)
38.00
220.00
5.
Value added by the marketing system
7.10
35.00
Index of Marketing Efficiency (Percentage)
6.
Conventional method
2.21
4.72
7.
Shepherd's method
14.05
34.37
8.
Acharya's method
0.84
0.86
Table.8 Price spread in different marketing channels of ginger
Sl. No.
Particulars
Channel I
Channel II
1.
Consumer's price (Rs./Kg)
45.10
255.00
2.
Total marketing cost (Rs./kg)
3.21
7.42
3.
Total marketing margin (Rs./kg)
41.89
247.63
4.
Producer's share in consumer price
(%)
92.88
97.09
15.65
6.8
3.25
0
1
2.55
8.9
3.25
0
0
20
3.5
Fig.1 Marketing cost of large cardamom (Rs/Kg) in different marketing channels
Channel
1
1364
Int.J.Curr.Microbiol.App.Sci (2019) 8(5): 1359-1368
Fig.2 Marketing margin in different marketing channels of large cardamom
1500
1000
500
0
573.2
496.5
2.55
0
575.75
0
15.1
511.6
1151.5
1023.2
Channel 1
Channel 2
Fig.3 Index of marketing efficiency in different channels of large cardamom marketing
114.71
120.00
100.00
80.00
60.00
49.84
20.00
Channel I
0.36
40.00
0.99
0.55
0.00
Channel II
0.95
Conventional
method
Shepherd's method
Acharya's method
Fig.4 Price spread in different marketing channels of large cardamom
1365
Int.J.Curr.Microbiol.App.Sci (2019) 8(5): 1359-1368
Fig.5 Marketing cost in different marketing channels of ginger
6.075
8
6
4
2
0
1.5
0.55
7.415
0.275 0.515
0.96
0.75
0
3.21
Channe…
Channe…
247.635
Fig.6 Marketing margin in different marketing channels of ginger
41.89
6.985
1.35
7.225
4.04
0
100
36.5
200
13.925
219.5
300
Channe…
Channe…
0
Producer
Wholesaler
Total marketing
margin
Fig.7 Index of marketing efficiency in different marketing channels of ginger
34.37
35.00
30.00
25.00
20.00
15.00
10.00
5.00
0.00
4.72
14.05
Channel I
0.86
2.21
0.84
Conventional
method
Shepherd's method
Acharya's method
1366
Channel II
Int.J.Curr.Microbiol.App.Sci (2019) 8(5): 1359-1368
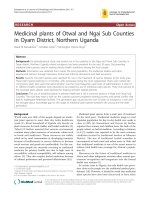
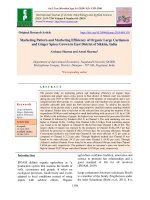
Fig.8 Price spread in different marketing channels of ginger
300
250
200
150
100
50
0
255
247.63
97.09
7.42
45.1
3.21
92.88
41.89
Channel I
Channel II
Consumer's
price (Rs./Kg)
Total
marketing
cost (Rs./kg)
Total
marketing
margin
(Rs./kg)
Table 6 reveals that the marketing margin of
the intermediaries at various stages of
marketing. Total marketing margin was found
to be the highest in Channel II (Rs 247.64/-)
than Channel I (Rs 41.89/-), respectively. The
largest chunk of margin was enjoyed by the
producers in Channel II (Rs 219.50/- per kg),
followed by processor in channel II (Rs
13.93/- per kg), respectively. Similar study
was also carried out by Sharma (2012).
Table 7 reveals that the empirical assessment
of marketing efficiency of ginger. Through
Conventional method it was found that
Channel II was more efficient (4.72 per cent)
as compared to Channel I (2.21 per cent),
respectively. While, through Shepherd
method the Channel II was found to be more
efficient (34.37 per cent) than Channel I
(14.05 per cent), respectively. Through
Acharya’s method Channel II was found to be
more efficient (0.86 per cent) than Channel I
(0.84 per cent), respectively. Similar study
was also carried out by Shuya and Sharma
(2014).
Table 8 reveals that the price spread in
marketing of large cardamom. The producer’s
share in consumer’s price was found to be
high in channel II (97.09 per cent) than
Producer's
share in
consumer
price (%)
Channel I (92.88 per cent), respectively.
Similar study was also carried out by Sharma
and Sharma (2008).
It is concluded that, in the marketing of
ginger, the highest cost was incurred by
processor (Rs 6.08/p-) in Channel II, followed
by Producer (Rs 1.50/-) in Channel I, the total
marketing cost was higher in Channel II (Rs
7.42/- per kg) than Channel I (Rs 3.21/- per
kg). While the total marketing margin was
found to be the highest in Channel II (Rs
247.64/-) than Channel I (Rs 41.89/-). The
largest chunk of margin was enjoyed by the
producers in Channel II (Rs 219.50/- per kg),
followed by processor in channel II (Rs
13.93/- per kg) on assessing efficiency,
through Conventional method it was found
that Channel II was more efficient (4.72 per
cent) as compared to Channel I (2.21 per
cent), respectively. While through Shepherd
method the Channel II was found to be more
efficient (34.37 per cent) than Channel I
(14.05 per cent), respectively. Through
Acharya’s method Channel II was found to be
more efficient (0.86 per cent) than Channel I
(0.84 per cent), respectively. The producer’s
share in consumer’s price was found to be
high in channel II (97.09 per cent) than
Channel I (92.88 per cent), respectively.
1367
Int.J.Curr.Microbiol.App.Sci (2019) 8(5): 1359-1368
References
Adhikari, P.P. 2016. Cardamom cultivation
technology, Agriculture Information and
Communication Center, Hariharbhawan
Lalitpur, Nepal.
Analogous. 2018. Statistical Hand of Sikkim
Published by Directorate of Economics
and Statistics (various issues), Gangtok,
Sikkim.
Anonymous. 2017. Marketing strategies for
organic produce of Sikkim, A report
submitted to Sikkim Organic Mission,
Government of Sikkim, Gangtok, CGS
National Institute of Agricultural
Marketing. Ministry of Agriculture and
Farmers Welfare, Kota road, Bambala,
Pratap Nagar, Jaipur, India.
Bhutia, P.H., Sharangi, A.B., Lepcha, R. and
Yonzone, R. 2017. Post-harvest and
value chain management of large
cardamom in hills and uplands.
International Journal of Chemical
Studies. 6(1): 505-511.
Bisht, V.K., Negi, A.K. and Bhandari, A.K.
2011. Ammomum subulatum cardamom:
Traditional
Phytochemical
and
Biological Activities – An overview.
African
Journal
of
Agriculture
Research, 8(24): 5388-5390.
/>ic_Products. Assessed on 13 March
2019.
/>les/ifoamstandarddraftv1.1_forconsultat
ion_clean_new.doc. Assessed on 23
April 2019.
Rahman, H., Bujarbaruah, K.M., Srivastava,
L.S., Karuppaiyan, R., Avasthe R.K.
and Singh, M. 2007. Status of ginger
cultivation in Sikkim with special
reference to disease management. ICAR
Research Complex for NEH Region
Sikkim Centre, Tadong, Gangtok.
Sharma, A. and Sharma, Anamika. 2008.
Problems faced by the farmers in
adoption of improved maize cultivation
practices in hills. TJRAR. 8(2): 22-23.
Sharma, Amod. 2011. Economic and
Constraints of King Chilli Growers in
Dimapur District of Nagaland. Journal
of Interacademicia. 15(4): 710-719.
Sharma, Amod. 2012. Inter-state Disparities in
Socio-economic Development in North
East Region of India. Journal of
Agricultural Science. 4(9). September:
236-243.
Sharma, Amod., Kichu, Yimkumba. and
Chaturvedi, B. K. 2016. Economics and
Constraints of Pineapple Cultivation in
Dimapur District of Nagaland. TJRAR.
16(1). January: 72-75.
Sharma, Amod., Kichu, Yimkumba. and
Sharma, Pradeep. Kumar. 2018.
Sustainable economic analysis and
constraints faced by the pineapple
growers in Nagaland. Progressive
Agriculture. 18(1). February: 27-33.
Shuya, Keviu. and Sharma, Amod. 2014.
Impact and constraints faced by the
borrowers of cooperative bank finance
in Nagaland. Economic Affairs. 59(4).
October: 561-567.
Willer, H. and Lernoud, J. 2018. The world of
organic agriculture. Statistics and
emerging trends 2018. Research
Institute of Organic Agriculture (FiBL),
Frick, and IFOAM – Organics
International, Bonn.
How to cite this article:
Archana Sharma and Amod Sharma. 2019. Socio Marketing Pattern and Marketing Efficiency of
Organic Large Cardamon and Ginger Spices Grown in East District of Sikkim, India.
Int.J.Curr.Microbiol.App.Sci. 8(05): 1359-1368. doi: />
1368