Summary of physics doctoral thesis: Study of organic dye lasers nanogold doped active medium for generation of short pulses by distributed feedback lasers
Bạn đang xem bản rút gọn của tài liệu. Xem và tải ngay bản đầy đủ của tài liệu tại đây (1.55 MB, 27 trang )
MINISTRY OF EDUCATION
VIETNAM ACADEMY OF
AND TRAINING
SCIENCE AND TECHNOLOGY
GRADUATE UNIVERSITY SCIENCE AND TECHNOLOGY
……..….***…………
NGUYEN THI MY AN
STUDY OF ORGANIC DYE LASERS NANOGOLD-DOPED
ACTIVE MEDIUM FOR GENERATION OF SHORT
PULSES BY DISTRIBUTED FEEDBACK LASERS
Major: Optics
Code: 9440110
SUMMARY OF PHYSICS DOCTORAL THESIS
Ha Noi – 2019
The work was completed at the Center for Quantum Electronics,
Institute of Physics, Vietnam Academy of Science and Technology
Supervisor:
1. Assoc. Prof. Dr. Do Quang Hoa
2. Dr. Nghiem Thi Ha Lien
Referee 1:
Referee 2:
Referee 3:
The thesis will be presented and defended at the Scientific
Committee of Institute of Physics held in:
...........................................................................................................
at........................................................................................................
The thesis can be found at the library:
- National Library of Hanoi
- Library of Institute of Physics, VAST
INTRODUCTION
1. Recent necessary of the topics
Short pulse dye lasers recently become necessary instruments in
many laboratories in Vietnam and in the world, also. However, the
investigation for developing laser active medium is still attracted in
many laboratories on optics and photonics. Moreover, the achievements
in nanostructured materials have been bringing numerous applications
in both the science and human life. Especially, gold nanoparticles
(GNPs) with different sizes have become attractive subjects due to their
distinguished properties. Thus, in this research, the study and
preparation of new laser active medium to be used for the laser
resonance cavity included the mixture of the dye and nanostructured
metallic particles is focused.
Research purpose:
Preparation and characterization of GNPs-doped active
medium based on dye molecules in PMMA applied to generate short
pulses in the range of pico-seconds by using distributed feedback dye
lases (DFDL) configuration are aimed.
Research content:
To fulfill the investigation purposes, the following work have
been carried-out:
- Researching technology of preparation of the active
mediums for dye lasers with doped GNPs in solid states.
- Characterization of optical properties of dye active mediums
for doped GNPs.
- Theoretical simulation of dynamic processes of emission of
pulse DFDL, using the active doped mediums.
- Testing performance of dye short-pulse lasers using dye
active medium doped with GNPs.
1
CHAPTER 1. OVERVIEW OF THE DYE LASERS,
LUMINESCENT ORGANIC DYES AND GOLD
NANOPARTICLES
1.1. Dye lasers
A dye laser is a typical laser which uses an organic dye as
the lasing medium. Due to these laser dyes contained double bonds
conjuncted to functional group, its could be strongly able to absorb in
the wide spectral band from ultratviolet to visible.
In this thesis, we used the dye DCM (4-(Dicyanomethylene)-2methyl-6-(4-dimethylaminostyryl)-4H-pyran) for the study. It can be
explained by special properties of DCM such as: the DCM molecule
possesses both donor and acceptor behavior, leading to a large range of
emission wavelengths (~ 100 nm) in visible light; DCM molecules
strongly absorbs in shorter wavelengths than the peak of absorption
resonance plasmon band of GNPs, therefore it is suitable for our research
on the mixture medium of dyes and GNPs. Besides, the lasers having
ability of the wavelength selectivity could be easy choose desired
continuous wavelengths in the emission range of DCM.
1.2.
Optical properties of nanostructured metallic materials,
Gold nanoparticles
As known, nanostructured materials possess most special
properties. Due to a small size (much smaller than the wavelengths of
ultra-violet and visible range), all the laws of classic optics used to
explain the phenomena occured when light interacts with the materials
are more unsatisfied. The resonance oscilation of the electron cloud
on the surface of metallic nanoparticles (surface plasmon resonance SPR) has been applied to the explaination of quantum confinement
and quantum effect occured on the nanomaterials.
2
At the interface between nanostructure metals and vincinity
medium, surface plasmonic effect exists in a smaller space than the
typical optical materials. In other side, metallic nanoparticles strongly
influence on the optical properties of the medium, like receiver and
emitter “anten”. For example, a nanoparticles of the precious metal
with 10 nm diameter possesses a extinction coefficient of ca. 107 M1
cm-1 or larger in two orders of magnitude in comparison with a typical
value of the organic laser dye.
1.3. Short pulse dye laser
1.3.1. Working principle of dye laser
Dye laser performances on the gain medium having two large
energy levels up-down, that can emit a large band.
1.3.2. Several types of configurations of dye lasers emiting picosecond pulses:
In this section several configurations of dye lasers emiting picosecond pulses were presented.
1.3.3. Distributed feedback (DFB) dye laser
Distributed feedback (DFB) dye laser is based on the Bragg
reflect effect without mirrors in resonance cavity.
The optic resonance occured when light beam propagates in a
medium existed the modulation of gain and refractive index to be
suitable to light wavelength, which leads to burn out the laser
emission.
Characteristics of DFDL lasers
* Posibility to continuously tunable wavelengths
* High monochromatic
* Emission of single short pulses
3
lp
lp
q
q
Laser
Laseroutput
ra
Laser
output
Laser
ra
z
Interference pattern
Laser lL
Gain
Biếnmodulation
điệu gain
L
Laser lL
n
n(t ) T (t )
T
L
Fig. 1.1: Schema of working principle of a DFDL laser.
CHAPTER 2: PREPARATION OF ACTIVE MEDIUMS FOR
DYE LASERS
The difference of the mobility of the components in the active
medium allows to investigate the characteristics and optical effects,
as well as the interact between the components. Thus the medium for
the dye laser in solutions (in ethanol) and in the solid state form (in
PMMA) were prepared for study.
2.1. Initial materials and equipments used
2.1.1. Initial materials
Organic dyes DCM, GNPs Au@PEG-COOH in spherical
shape
(d20
nm),
Methyl
methacrylate
(MMA),
Azobisisobutyronitrile (AIBN).
2.1.2. Equipments
Ultrasonic stirrer ELMASONIC S30, Thermal oven with
temperature T < 200oC), spincoating, etc.
2.1.3. Preparation of GNPs and attachment of HS-PEG-COOH.
Sphere-shape GNPs were prepared by Turkevich method.
2.1.4. Changing active medium for Gold nanoparticles
GNPs dispersed in water have been re-dispersed in MMA
solvent for avoiding water, because water was not soluble MMA,
moreover DCM molecules were easy decomposed in water.
4
2.2. Active medium in solution for dye lasers
2.2.1. Preparation of DCM solutions
Table 2.1: Concentration of DCM dye in ethanol.
Sample
DCM concentration (M)
Sample 1
3.0×10⁻⁵
Sample 2
1.0×10⁻⁵
Sample 3
5.0×10⁻⁶
Sample 4
1.0x10⁻⁶
Table 2.2: Concentration of DCM dye in MMA solution
Sample
DCM concentration (M)
Sample 1
2.5×10⁻⁶
Sample 2
2.0×10⁻⁶
Sample 3
1.5×10⁻⁶
Sample 4
2.0×10⁻⁷
Sample 5
5.0 10-7
2.2.2. Doped medium of DCM/GNPs dye
Table 2.3: Concentration of DCM and GNPs in ethanol.
DCM concentration
GNPs volume
(mol/L)
(particles/ml)
Sample 1
1.0x10⁻⁴ M
5.0x10⁹
Sample 2
1.0x10⁻⁴ M
1.0x10¹⁰
Sample 3
1.0x10⁻⁴ M
1.5x10¹⁰
Sample 4
1.0x10⁻⁴ M
2.0x10¹⁰
Sample
5
Table 2.4: Concentration of DCM and GNPs in MMA solution
Sample
DCM concentration
GNPs volume
(mol/L)
(particles/ml)
Sample 0
3.0x10⁻⁵
0
Sample 1
3.0x10⁻⁵
1.0x10¹⁰
Sample 2
3.0x10⁻⁵
1.5x10¹⁰
Sample 3
3.0x10⁻⁵
2.0x10¹⁰
Sample 4
3.0x10⁻⁵
3.3x10¹⁰
2.3. Preparation active medium for dye laser with doping GNPs
in PMMA matrices (DCM/GNPs/PMMA)
2.3.1. Active medium with PMMA matrice
Dye laser solid state active medium
was prepared by polymerization of MMA
monomers.
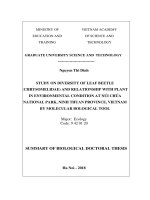
2.3.2. Template for preparation
Solid state active medium was
prepared in a cubic shape of 1x1x2,5 cm3
Fig. 2.1. Template for
size (similar to cuvet). Synthesis process
preparation solid state
for
polymers
was
carried-out
at
active mediums.
0
temperature of ~ 50 C (Fig. 2.1).
2.3.3. Preparation of doped solid state active mediums
Solid state active mediums were prepared by polymerization of
MMA doped DCM dye.
2.2.3.1. Preparation of solid state active mediums DCM/PMMA
a) Preparation of white samples
6
The initial materials have been used: monomer MMA and
catalytic AIBN. MMA solution for each experimental sample is 2000
µl. There are 5 samples with different weight of AIBN.
Table 2.5: Materials and concentration.
Sample
AIBN (mg)
MMA (µl)
T1
1mg
2000
T2
2mg
2000
T3
3mg
2000
T4
4mg
2000
T5
5mg
2000
Solid state samples prepared with 3 mg of AIBN have a high
homogeneity, best quality and without bubbles. They were used for
all experiments in the thesis.
b) Preparation of DCM/PMMA active medium
The aim: Preparation of solid state samples for studying of the
active mediums with different DCM concentration.
Table 2.6: Initial materials and concentration of DCM/PMMA.
Sample
DCM/MMA (M)
DCM/MMA (µl)
AIBN (mg)
D1
1x10⁻²
2000
3
D2
-3
5x10
2000
3
D3
1x10⁻³
2000
3
D4
-4
2000
3
D5
-4
1x10
2000
3
D6
3x10⁻⁵
2000
3
D7
-5
2000
3
5x10
1x10
7
Fig. 2.1: Active DCM mediums dispersed in PMMA matrice used
for lasers.
2.2.3.2. Preparation of PMMA/DCM doped with GNPs
The GNPs “Au@PEG-COOH” were dispersed in MMA such
as introduced in the first step of the samples preparation.
Table 2.7: DCM/GNPs/PMMA samples with DCM of 10-3 M.
DCM
GNPs/MMA
DCM/MMA
AIBN
(mol/l)
(µl)
(µl)
(mg)
DA1
10-3
0
2000
3
DA2
10-3
4
2000
3
DA3
10-3
8
2000
3
DA4
10-3
12
2000
3
DA5
10-3
20
2000
3
Sample
Table 2.8: DCM/GNPs/PMMA samples with DCM of 10-4 M.
Sample
DCM
Au/MMA
DCM/MMA
AIBN
(mol/l)
(µl)
(µl)
(mg)
DA6
10
-4
0
2000
3
DA7
10-4
4
2000
3
DA8
10-4
8
2000
3
DA9
10-4
12
2000
3
-4
20
2000
3
DA10
10
8
2.4. The determination of parameters of the samples and applied
techniques
In this section we listed the methods and equipments to detect
different parameters of the samples for researching, such as the UVVis
absorption,
fluorescence
spectra,
fluorescence
lifetime,
autocorrelation etc.
CHAPTER 3: INVESTIGATION OF ACTIVE MEDIUM OF
GNPs-DOPED DYE MOLECULES
In this chapter we presented recent results of the investigation
on the quenching and enhancement effects of laser dye in the active
medium of GNPs-doped DCM.
3.1. Optical properties of active mediums in dye laser with doping
sphere-shape GNPs
3.1.1. Samples preparation
The samples were prepared according to describing in
Chapter 2. Nd:YAG laser was used for pumping DFDL, dye and
GNPs-doped PMMA samples were prepared in a bulk with a size of
1×1×2.5 cm3.
3.1.2. Optical characteristics of DCM in solution and solid-state
medium
3.1.2.1. Absorption spectra of DCM dye in ethanol and MMA
Absorption spectra of DCM dye in ethanol and MMA without
GNPs dopant are presented in Fig. 3.1a and Fig. 3.1b, respectively.
These spectra have a similar shape, however the bandwidth of
the absorption spectra of DCM in ethanol is narrower than that in
MMA, and the spectral intensity fast decay in the long wavelength
side. This can be explained due to the weak interaction between dye
9
molecules and the solvent, which did not expand or change the states
1
0.10
-5
1
2
3
4
1.4
1x10 M
-6
5x10 M
-6
3x10 M
-6
1x10 M
Normalized absorption (a.u.)
Absorption Intensity (a.u)
of the upper and lower energy states of the DCM molecules.
0.7
0.0
0.08
3
4
0.06
500
600
-6
DCM 2.5 10 M
-6
DCM 2.0 10 M
-6
DCM 1.5 10 M
-6
DCM 2.0 10 M
-7
DCM 5.0 10 M
5
0.04
0.02
0.00
400
1
2
3
4
5
2
700
400
500
600
Wavelength (nm)
Wavelength (nm)
Fig. 3.1: Absorption spectra of DCM dye in ethanol (a)
and in MMA (b)
3.1.2.2. Absorption spectra of the DCM dye in PMMA matrice
In the solid state matrice of PMMA the mobility of the DCM
molecules is smaller than in solution. Thus the absorption spectra are
broaden in the long wavelength side (Fig. 3.3).
Fig. 3.3: Absorption spectra of DCM dye in PMMA.
3.1.3. Fluorescent spectra of GNPs-doped DCM in ethanol
(DCM/GNPs/ethanol)
10
The intensity of
maximum value when
the GNPs/DCM equal
to 1/20 (solution of
1x10¹⁰ particles/ml of
GNPs, d ≈ 16 nm;
450
Fluorescence intensity (a.u.)
fluorescence attained a
(3)
(1)
350
300
-4
(1)
(2)
(3)
(4)
(5)
(2)
400
DCM 1x10 M
9
DCM+5x10 hat/ml
10
DCM+1x10 hat/ml
10
DCM+1,5x10 hat/ml
10
DCM+2,0x10 hat/ml
(5)
250
(4)
200
150
100
50
0
solution of DCM is
-4
M). When the
GNPs
concentration
1x10
increased (c.a. >1x10¹⁰
particles/ml),
450
500
550
600
650
700
Wavelength (nm)
Fig. 3.6: Fluorescent spectra of
DCM/GNPs in ethanol.
the
fluorescence intensity slowly increases, and then started decreasing.
(Fig. 3.6) This can be explained due to the fluorescence
enhancement by near-field interaction between GNPs and DCM
molecules. After reached a saturation value, the fluorescence
quenching is occurred due to the Foster and SET energy transfer.
3.1.4. Optical properties of GNPs-doped DCM in PMMA matrice
3.1.4.1. Absorption spectra
of DCM/GNPs/PMMA
concentration of DCM was
maintained at 1×10⁻⁴ M,
and the concentration of
GNPs was varied. The
intensity
spectra
of
of
the
of
1
0.5
350
400
450
500
550
600
650
Wavelength (nm)
DCM
GNPs
1.0
DCM+1.0x10 par/mLGNPs
10
DCM+1.5x10 par/mLGNPs
10
DCM+2.0x10 par/mLGNPs
0.0
absorption
slightly increased with the
increase
Absorption intensity (a.u.)
In this experiment,
10
1
2
3
3
2
Fig. 3.7: Absorption spetra of the
active medium DCM/GNPs/PMMA.
11
concentration from 5 l/ml to 20 l/ml (or from 0.5x10¹⁰ particles/ml
to 2x10¹⁰ particles/ml) (Fig. 3.7). At low concentrations of GNPs, a
slightly increase of the fluorescence intensity was also observed. This
can be explained due to the appearance of the near-field interaction.
Several molecules of DCM were adhered on the GNPs surface,
resulting in higher absorption cross-section of DCM increased. With
higher concentration of GNPs, the absorption intensity of the samples
decreased.
3.1.4.2. Fluorescence of the dye of DCM/GNPs/PMMA
Fluorescence
spectra
concentration of 3x10
-4
of
DCM/GNPs/PMMA
(DCM
M) vs. GNPs concentration under an
excitation wavelength of 472 nm is shown in Fig. 3.8. From this figure
one can see that the fluorescence intensity of DCM increased up to a
maximum value at the GNPs concentration of 1.5x10¹⁰ particles/ml
(Curve “2”), then decreased with increasing GNPs concentration
(Curves “3, 4”).
Fluorescence intensity (a.u.)
2
1
2
3
4
1
40
10
1x10 par/ml
10
1,5x10 par/ml
10
2x10 par/ml
10
2,5x10 par/ml
3
20
4
0
500
600
700
800
Wavelength (nm)
Fig. 3.8: Fluorescence spectra of DCM/GNPs/PMMA.
The excitation wavelength l = 472 nm (DCM concentration is
of 3x10⁻⁴ M).
12
This can be explained due to less mobility of the DCM molecules
in the solid state host, thus the larger GNPs concentration, the smaller
average distance between GNPs and DCM, resulting in clearer SET
effect. This behavior of GNPs can be applied for controlling the
emission of the dye centers around the particles. GNPs exhibited as an
anten, emiting or detecting electromagnetic radiation.
With low GNPs concentrations, when pumping source excited
to fluorescence is presented, GNPs play a role of emitting energy,
leading to the energy transfer from GNPs to DCM molecules. At
higher GNPs concentration, the quenching of fluorescence radiation
from DCM molecules occurred. With excitation wavelength of 532
nm, only fluorescence quenching was observed (Fig. 3.9). This can be
explained as follows. When the excitation wavelength is closed to
maximum of plasmonic absorption of GNPs, the bleaching occurred
for the DCM molecules located on the GNPs surface. This result
obtained is different from that observed in case when DCM solutions
doped GNPs.
Fig. 3.9: Fluorescence spectra of DCM/GNPs/PMMA.
The excitation wavelength l = 532 nm (DCM concentration is
3x10⁻⁵ M).
13
3.1.5. Fluorescence lifetime of molecules of DCM/GNPs/PMMA
For the solution
samples,
DCM
molecules
are
easy
affected
by
the
polarization
of
medium
matrice.
Therefore,
the
the
Fluorescence life time
of
DCM
strongly
dependent on both the
solvent and doping
Fig. 3.10: Fluorescence lifetime of DCM
doped with different GNPs in solution.
materials (Fig. 3.10). Whereas, fluorescence lifetime of DCM in
PMMA with different GNPs concentration (namely from 0 to 33 l of
GNP solution of 1x10¹¹ particles/ml) is presented in Fig. 3.11.
The fluorescence
of
DCM
molecules
exhibited similarly to
self-emission,
the
transition from higher
energy levels almost
did not change. Thus,
solid
state
materials
containing DCM doped
Fig. 3.11: PL lifetime of
with GNPs can be used
DCM/GNPs/PMMA.
for the active medium for lasers as they exist in solutions.
3.2. Influence of the light-to-heat of GNPs on DCM molecules
3.2.1. Thermal conversion of plasmonic effect of GNPs
14
Light-to-heat effect between GNPs particles and around
environment was simulated by Mie theory. This simulation can be
applied for explanation of the experimental results obtained when
GNPs particles with a diameter of 16 nm doped in the active medium
of solid state DCM dye laser.
3.2.2. Fluorescence decay of DCM/GNPs/PMMA
effect
strongly affected to the
working time of the active
medium of DFDL. Fig.
3.13 shows the decay of
integrated
fluorescence
Fluorescencence (a.u.)
Light-to-heat
intensity over time of the
6000
3
DCM/2x10 GNPs (T4C)
10
3
2
2000
1
0
0
1000
2000
Pulses (x102)
Fig. 3.13: Lowering process of
DCM/GNPs/PMMA
by
1x10 mol/l DCM
10
DCM/2x10 GNPs (TP)
4000
active medium based on
pumped
-3
1
2
secondary
harmonic generation of the
photoluminescence vs time of the
acive medium DCM/GNPs/PMMA at
RT with cooling.
Nd:YAG laser.
3.2.3. The decay of dye
laser intensity
o
Fig
3.15
at
room
temperature (RT) and 4
°C.
At
RT,
intensity
similarly
fluorescence
to
6000
3000
the
degradation curve of
laser
Laser intensity (a.u)
the DFDL is shown in
at 10 C
room temp.
9000
The stability of
0
0
decay
1000
1500
2000
2500
Pulses (x102)
is
the
500
Fig. 3.15: The decay of laser intensity
(532 nm, 140J, 5,6 ns, 10Hz).
15
curve. At temperature of (4 ± 1) °C, the unchanged laser intensity was
maintained for a long time.
CHAPTER 4. DISTRIBUTED FEEDBACK DYE LASER
(DFDL) USING GNPs-DOPED SOLID STATE MEDIUM
- Modeling theoretical simulation for solid-state DFDL laser
used DCM/GNPs/PMMA. Calcultion of spectro-temporal evolution of
the DFDL by Matlab language.
- Studing the influence of the laser parameters on the laser
properties for optimization of the performance of DFDL.
- Experimentally researching
the influence of some
parameters of solid-state DFDL on laser properties.
- Setup a DFDL equipment that can be applied in practice
based on the results of both the theoretical and experimental research.
4.1. Theoretical research on the solid-state DFDL dye laser
4.1.1. Rate equations of two dissimilar components
It is suggested that the peformance of a dye laser can be
described by two broad energy levels (corresponding to a laser with
four energy levels, as shown in Fig. 4.1).
S1
GNP
p
e
00
GNP
S0
Fig. 4.1: Schematic draw of energy levels in a laser doped with
GNPs.
16
To describe the energy levels transition in a dye laser doped
GNPs, the rate equations has been shown in Ref. [126], it consists of
four equations describing spectro-temporal evolution of the laser
emission of DFDL with intrinsic quenching parameters:
𝑑𝑛𝐴𝑢
𝑑𝑡
𝑑𝐸𝑖 (𝑡)
𝑑𝑡
𝑑𝑛𝑎
𝑑𝑡
= (𝐼𝑝 𝜎𝑝𝐴𝑢 + 𝜎𝑎𝐴𝑢 𝑐𝐼𝑎𝑖 (𝑡))(𝑛0𝐴𝑢 − 𝑛𝐴𝑢 (𝑡)) −
𝑛𝐴𝑢 (𝑡)
−𝑛𝐴𝑢 [∑𝑘𝑖=1 𝜎𝑎𝑖𝐴𝑢 𝐸𝑖 (𝑡)],
𝜏𝐴𝑢
𝜎𝑠𝐴𝑢 𝑐
𝐸 (𝑡)
𝑛𝑎𝑢 (𝑡)𝐸𝑖 (𝑡) − 𝜏𝑖 ,
𝜂
=
4.1)
(4.2)
𝐴𝑢
= 𝐼𝑝 (𝑡)𝜎𝑝𝑎 [𝑁𝑎 − 𝑛𝑎 (𝑡)] +
𝐾𝑠 𝜎𝑎𝐴𝑢𝑎 𝑛𝐴𝑢 𝑐𝐸𝑖
𝜂
−
𝜎𝑒𝑎 𝑐𝑛𝑎 (𝑡)𝐼𝑎 (𝑡)
−
𝜂
𝑛𝑎 (𝑡)
𝜎 𝑐[𝑁 −𝑛 (𝑡)]𝐼 (𝑡)
+ 𝑎𝑎𝑙 𝑎 𝜂 𝑎 𝑎 ,
𝜏𝑎
𝑑𝐼𝑎𝑖 (𝑡)
𝑑𝑡
=
(𝜎𝑒𝑎𝑖 −𝜎𝑎𝑎𝑖 )𝑐
𝜂
(4.3)
𝑛𝑎 (𝑡)𝐼𝑎𝑖 (𝑡) −
𝐼𝑎𝑖 (𝑡)
Ω𝑛 (𝑡)
𝐾 𝜎
𝑐𝐼 (𝑡)
+ 𝜏𝑎 − 𝐹 𝑎𝐴𝑢𝜂 𝑎𝑖 ,
𝜏𝑐 (𝑡)
𝑎
(4.4)
3
where n0Au, na are the densities of GNP and DCM molecula in 1cm ,
respectively; nAu(t), na(t) – the average densities of GNPs and DCM at
above energy level in 1cm3, respectively; τc – life time of a photon in
the active medium equivalent that is considered as follows:
𝜏𝑐 =
𝜂𝐿3 [𝑛𝑎𝑖 (𝑡)𝜎𝑒𝑎𝑖 𝑉]2
8𝑐 3 𝜋2
=
2
𝜂𝐿3
𝜋
∆𝜂(𝑡))
[(
3
2
2𝑐 𝜋
𝜆𝑖
𝑛𝑡ℎ =
2
𝛾𝑖 (𝑡) 2
) ].
2
+(
(4.5)
2
𝜋 3
( ).
𝜎𝑒𝑎𝑖 𝐿 𝑉
(4.6)
Equation (4.1) describes the changing rate of GNPs at the excited
state by energy pumping and laser emission energy of the DCM
molecules. The change of resonance surface plasmon energy of GNPs
is shown in equation (4.2). The energy transfer from/to molecules of
dye DCM is described by equation (4.3) with KF and Ks – coefficients
of the energy transfer. This value is positive when the energy transfer
17
from GNPs to the dye molecule and – negative when energy transfer on
opposite direction. The change rate of the photon density in the active
medium is shown in equation (4.4).
4.1.2. The influence of pumping rate
At a pumping rate that is appropriate to the threshold, the single
pulses can be observed. When the pumping rate increases
corresponding r/rth increases from 1.5 to 2 above the ngưỡng, the pulse
width decreases and then the secondary pulse occured due to the
relaxation of the population at the higher energy level (Fig. 4.2).
2.00E+015
(a)
4.00E+015
(b)
1.00E+015
2.00E+015
0.00E+000
0.00E+000
A19
635
635
A18
A24
640
A23
640
645
A28
A29
645
4.00E-012
8.00E-012
A33
650
1.20E-011
4.00E-012
X Time
Axis (s)
8.00E-012
XTime
Axis (s)
1.5 times above threshold
Appr. Threshold
6.00E+015
DCM = 1x10⁻³ M
GPs = 1x10¹⁰par/ml
4.00E+015
(c)
2.00E+015
0.00E+000
A17
635
640
A22
A27
645
A32
650
4.00E-012
8.00E-012
Time (s)
2 times above threshold
Fig. 4.2: Procedure of the DFDL spectrum according to the change
of pumping rate.
4.1.3. Influemce of GNPs concentration
With increase of the GNPs concentration, the energy transfer
from DCM molecules to GNPs increases, leads to quench secondary
pulses in the output laser, which generate by oscillation relaxation of
population in upper laser level (Fig. 4.3).
18
645
(a)
4.00E+015
4.00E+015
(b)
2.00E+015
2.00E+015
0.00E+000
0.00E+000
A16
635
635
A16
A21
640
A21
640
A26
645
A26
645
A31
650
A31
650
4.00E-012
4.00E-012
8.00E-012
8.00E-012
Time (s)
Time n(s)
GNPs 8x10¹⁰ par/ml
GNPs 9,5x10¹⁰ par/ml
4,00E+015
2 times above threshold
DCM =1X10⁻³ M
(c)
2,00E+015
0,00E+000
635
640
645
650
4,00E-012
8,00E-012
Time (s)
GNPs 1,1x10¹⁰ par/ml
Fig. 4.3: Procedue of laser emission spectrum according to the
change of GNPs concentration at the pumping rate larger 2 times
of the threshold.
4.2. Distribute feedback dye laser adjusting wavelengths (DFDL)
4.2.1. Experimental configuration of DFDL
To post amplification
Nd:YAG laser
532 nm, 10 Hz, 5.6 ns
To multipass amplifier
160 J
BS
M6
L2
M
CM
M
L4
M5
M1
L3
M
M
M7
M
C2
M1
M
M2
M2
M
M
C3
M
560 – 610 nm
12 ps, 1 mJ
M
M5
M3
DC
M4
Fig. 4.8: Scheme of a distributed feedback dye laser: Oscillater,
Amplification with six passed times and Power amplification.
19
4.2.2. Configuration of the wavelength control
The wavelength control unit consists of an electronic system
connected to a computer for controlling step motor through a pair of
conducting bars, that rotates mirrors to adjust the wavelength
selection. Motor performance is controled by the software of the
computer.
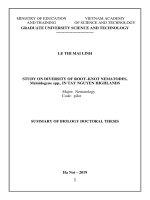
4.2.3. Experimental results
4.2.3.1. Pulse width
Experimental approaches of the influence of the doped-GNPs
concentration in the laser medium on the laser pulse width are shown
in Fig. 4.10. Two shoulders in the autocorrelation trace of the
laser pulse were observed when the active laser medium without
GNPs and low concentration of GNP were used. This shows that there
is an overlap of the secondry pulses in the autocorrelation trace.
a)
Intensity (normalized)
1.0
0.5
0.5
0.0
0.0
0
b)
1.0
30
60
0
30
60
30
60
1.0
1.0
c)
d)
0.5
0.5
0.0
0.0
0
30
0
60
Delay time (ps)
Fig. 4.10: Autocorrelation spots of intensity of laser pulses.
concentration of GNPs: (a) 2.5×10⁹ particles/cm3, (b) 5×10⁹
particles/cm3, (c) 1×10¹⁰ particles/cm3 and (d) 2.5×10¹⁰ particles/cm3.
20
With increase of the GNPs concentration up to 2.5×10¹⁰
particles/mL, there was observed a narrower pulse and the secondary
pulses was quenched. Finaly, a single pulse corresponding to the
concentration of 2.5×10¹⁰ particles/mL has been obtained.
4.2.3.2. The investigation of laser intensity vs GNPs concentration
The peak laser intensity with different GNPs concentration in the
active medium of DCM/PMMA is presented in Fig. 4.12.
0.6
0.2
0.0
1
2
3
4
Intensity (a.u)
0.4
laser (a.u)
độ đỉnhintensity(a.u.)
Cường
lasser
Peak
1.0
9
2x10
9
5x10
10
1x10
10
1.5x10
10
2x10
Cường độ (a.u)
1
2
3
4
5
5
600
620
0.9
0.8
0.7
0.6
0.5
0.4
0.3
0.2
0.1
0.0
640
0.00E+000
Bước sóng
(nm)
Wavelength
(nm)
1.00E+010
2.00E+010
GNPs concentration (par/ml)
Nồng độ GNPs (hạt/mL)
Fig. 4.12: Intensity of laser emission of DCM at the wavelength of
626 nm with different GNPs concentration.
With the increase of GNPs concentration, the peak intensity of
laser emission at 5×10⁹ particles/cm3 increases to maximal value.
When GNPs concentration is increased, the laser intensity started
decreasing.
4.2.3.3. The range of wavelength adjusting
It is observed that the adjusting wavelength range of the DCM
laser is almost unchanged (590 – 620 nm) when GNPs concentration is
ranging from 2.5 × 10⁹ to 2.5 × 10¹⁰ particles/cm3 (Fig. 4.13).
21
1: GNPs
2: GNPs
3: GNPs
4: GNPs
Normalized Intensity
1,0
2,5x10⁹ par/ml
5x10⁹ par/ml
1x10¹⁰ par/ml
2,5x10¹⁰ par/ml
1
2
0,5
3
4
0,0
570
580
590
600
610
620
630
640
Wavelength (nm)
Fig. 4.13: Range of adjusting laser wavelength with use of
GNPs-doped DCM.
CONCLUSION
The thesis titled “Study of organic dye lasers nanogolddoped active medium for generation of short pulse by distributed
feedback lasers” is presented new results of the research in the field
of developing active medium for the dye laser doped spherical gold
nanoparticle in the polymeric host of PMMA. The research on the
spectro-temporal evolution of the distributed feedback laser using
manufactured active medium. The main new contribution are obtained
as following:
1.1. Setup a technological process and sucessfully manufacture an dye
doped-GNPs active medium in the PMMA. The results showed that
in order to attain mono-dispersive GNPs in PMMA medium, firstly,
it is necessary to remove water from GNPs, and then disperse them in
MMA solution contained
DCM with desired concentrations.
Manufactured samples possess a high optical homogenity and limited
the damage of the DCM dye centers.
22
1.2. Investigated and recorded of the significant optical properties
of the hybrid active medium made for dye lasers. In detail, the
fluorescence intensity and absorption spectra of DCM molecules
in PMMA host doped GNPs deacreased with the increase of GNPs
concentration, whereas fluorescence lifetime of the DCM molecule
was
almost
unchanged.
In
particular,
the
fluorescence
enhancement was observed when the excittion wavelength near the
peak of the absorption spectrum of DCM molecule (about 470 nm)
was rather far from the peak of the absorption spectrum of GNPs
(namely 530nm).
1.3. Research results showed that the stability of the DFDL laser using
active medium of DCM/GNPs/PMMA has been improved due to the
high thermal conversion coefficient of GNPs with the thermal
controling mechanism by the Peltier cell.
1.4. Establishing calculation modelization for the spectro-temporal
evolution of the hybrid active medium of solid state DCM/GNPs
(weak mobility). Bi-direction energy transfer process between two
components is a new theoretical model of the energy transfer in the
active medium based on DCM/GNPs.
1.5. The study has shown that single picosecond laser pulses of can be
detected at a high pumping rate above threshold in a DFDL structure
with the active medium of DCM/PMMA/GNPs. The secondary pulses
were quenched due to the energy transfer from DCM molecules to
GNPs, whereas the first pulses were almost not affected.
1.6. Experimental results by using the DFDL configurations are rather
closed to the theoretically modeling calculations. In detail, the width
of laser pulse of (122) ps was measured by intensity autocorrelation
technique at the length of the active volume of 0.5 cm. The tuning
23