Summary of chemistry doctoral thesis: Study on the fabrication of magnetic fluids based on superparamagnetic iron oxide nanoparticles (SPIONs) applied to magentic resonance imaging (MRI)
Bạn đang xem bản rút gọn của tài liệu. Xem và tải ngay bản đầy đủ của tài liệu tại đây (2.9 MB, 28 trang )
MINISTRY OF
EDUCATION AND TRAINING
VIETNAM ACADEMY OF
SCIENCE AND TECHNOLOGY
GRADATE UNIVERSIY OF SCIENCE AND TECHNOLOGY
LE THE TAM
STUDY ON THE FABRICATION OF MAGNETIC FLUIDS BASED ON
SUPERPARAMAGNETIC IRON OXIDE NANOPARTICLES (SPIONs)
APPLIED TO MAGENTIC RESONANCE IMAGING (MRI)
APPLICATION
Major: Inorganic chemistry
Code: 9.44.01.13
SUMMARY OF CHEMISTRY DOCTORAL THESIS
Ha Noi - 2019
This thesis was done at:
Laboratory of Biomedical Nanomaterials, Institute of Materials and Sciene,
Vietnam Academy of Science and Technology.
Laboratory of Electronic-Electrical Engineering, Institute for tropical
technology, Vietnam Academy of Science and Technology.
Centre for Pratices and Experimences, Vinh University.
Supervisor: Prof., Dr. Tran Dai Lam
Assoc.Prof., Dr. Nguyen Hoa Du
Reviewer 1: .....................................................
Reviewer 2: .....................................................
Reviewer 3: .....................................................
The dissertation will be defended at Graduate University of Science and Technology, 18
Hoang Quoc Viet street, Hanoi.
Time: .............,.............., 2019
This thesis could be found at National Library of Vietnam, Library of Graduate
University of Science and Technology, Library of Chemistry, Library of Vietnam
Academy of Science and Technology.
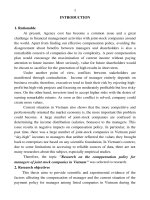
INTRODUCTION
Recent applications of magnetic nanoparticles in biomedical applications, especially in
imaging diagnostics using MRI Magnetic Resonance Imaging engineering have attracted the
attention of scientists around the world. Currently in imaging diagnostics using MRI magnetic
resonance imaging, Tl contrast agents have become a traditional commodity, which is a
complex of paramagnetic ions with a large torque value like Gd3+ (7 unpaired electrons).
These Gd3+ ions are combined with molecules such as DTPA (diethylentriamine penta acetic
acid) and create Gd-DTPA chelate round complex structures. During the recovery process,
the interaction between the magnetic moment of the proton and the magnetic moment of the
paramagnetic ions causes the T1 time to be reduced, so the recovery rate R1 increases. The
concentration of agents is different in each cell tissue region, thus providing an effective
contrasting on MRI images. For nearly 10 years now, along with the development of
nanotechnology iron oxide (IO) nanoparticle having been strongly researched and actual
many commercial products that increase MRI contrast levels using this iron oxide material,
proving that iron oxides-MRI can give better quality of contrast level than Gd-DTPA because
iron oxide particles have a higher magnetic induction coefficient. IO-MRI substances can
reduce both T1 and T2, increasing MRI recovery rates in both Tl and T2 MRI modes. The
important requirements for MRI contrast increasing products are that magnetic nanoparticles
must have a relatively uniform particle distribution and magnetic saturation enough large, and
the coating materials must have good biological compatibility. While some commercial
products in the world, such as Resovist, use dextran as a coating material, with a 65 nm core
particle created from saturation of about 65 emu/g. Products with particle sizes in the 2040nm region such as AMI-227: Sinerem/Combidex are suitable for lymph and bone. In the
last 10 years, people have been studying to create superparamagnetic nanoparticles with a
particle size smaller than 20 nm (also known as microscopic if the particle size is D<10 nm)
and especially iron oxide particles, marked with magnetic markers is intended for MRI
targeted imaging.
In Vietnam, up to now the fabrication of nanoparticles in general and magnetic
nanoparticles in particular has been focused to research in accordance with two aspects: basic
research and application-orientation research. The profound research results are published
mainly from large research institutions such as: Hanoi National University, Hanoi University
of Science and Technology and Vietnam Academy of Science and Technology. The synthesis
of magnetic nanomaterials is mostly carried out in water and by synthetic methods such as
co-precipitation methods, hydrothermal methods, microwave methods and ultrasonic
electrochemical synthesis methods. Due to the synthesis in the water environment, the
fabricated magnetic nanoparticles have not high quality, the particles are uneven in size and
heterogeneous in shape and therefore they are restricted for use in vivo printing applications
in biomedicine such as used as a contrast drug in imaging diagnosis by MRI magnetic
resonance imaging, magnetic induction heating, etc. in addition, the such unevenness even
affects the research results of their magnetic properties. Therefore, up to now, the selection
of conditions in the fabrication of Fe3O4 nano magnetic fluid to produce particles with small
particle size, uniform distribution, homogeneous shape and high durability, high magnetism
and high biocompatibility, thus making it possible to apply as contrast medicine in imaging
diagnostics using MRI magnetic resonance imaging, creating optimal values of impulses TR,
TE when taking with T1, T2 mode, and determining recovery coefficient r1, r2 to assess the
quality of magnetic fluids as contrast medicine in imaging diagnosis by MRI magnetic
resonance imaging is still asking for continuing and systematic research.
Derived from the research on nanomaterials in the world as well as in Vietnam, based
on the research and Doctor training potential of the Institute of Science and Technology,
Vietnam Academy of Science and Technology, under the guidance of a group of experienced
scientists, we select the topic "Study on the fabrication of magnetic fluids based on
superparamagnetic iron oxide nanoparticles (SPIONs) applied to magentic resonance
imaging (MRI) application" to make this thesis content.
Research object of the thesis:
Magnetic fluid system based on superparamagnetic iron oxide.
Research targets of the thesis:
The goad of the thesis is to build the manufacture process of nano-sized magnetic fluids
based on iron oxide (uniform particle size and high magnetic saturation) with stable
technology; Characteristic research of magnetic properties of magnetic nanoparticles;
assessment of toxicity and test of effects on cells, aiming to make contrast medicine in
imaging diagnosis by magnetic resonance imaging (MRI), application on accurately
identifying cancer.
Scientific and practical meaning of the thesis:
The implementation organization of the topic itself has important implications for
developing a multi-disciplinary science and technology direction as Nanotechnology for
Medicine. There will be academic exchange, mutual learning between research groups in the
industries deem as independent. Scientifically, the magnetization of magnetic particle systems
for biomedical applications is strongly influenced by many factors, but the mechanism of
these effects is still a problem that has not been studied fundamentally.
For the application of cancer diagnosis and treatment, nanotechnology in general is
creating a great expectation that is able to contribute to solve the problem of early disease
diagnosis and drugs to target or intervention areas localized at the destination. The subject has
a goal of using magnetic fluid improving the contrast of nuclear magnetic resonance imaging
(MRI), which can contribute to the analysis of early-stage cancer tissue.
Research methodology:
The thesis is conducted by experimental method combined with numerical calculation
techniques. The research sample is fabricated by hydrothermal and thermal decomposition
methods. Study the structure of the sample by X-ray diffraction techniques (XRD), electron
microscopy (FESEM, TEM and HRTEM). The magnetic properties of the materials are
surveyed by magnetic measurements on the vibrating sample magnetometer (VSM) system.
Using Fourrier Transformation InfraRed (FTIR), Thermal gravimetric analysis (TGA) to
evaluate the presence of functional groups on the particle surface and the mass reduction of
polymer-coated magnetic particle layer. Dynamic Light Scattering (DLS) technique
determines the hydrodynamic size and durability of magnetic fluids. Experimental assessment
of toxicity through in-vitro test. MRI imaging method T1, T2 for studies of contrast
enhancement of material samples for manufacturing (on 1.5T MRI scanner, SIEMENS
MAGNETOM, Germany).
Research contents of the thesis:
1.
Successful summary of Fe3O4 magnetic nanoparticles with uniform particle size and
high saturation magnetization by hydrothermal and thermal decomposition methods.
2.
Successfully fabrication of high-strength magnetic fluids on Fe3O4 particles
synthesized by the above two methods.
3.
Research on the toxicity and durability of magnetic fluids.
4.
Study the applicability of image contrast enhancer in MRI magnetic resonance
imaging.
The layout of the thesis:
The thesis has 137 pages (not including references, appendices), including the
introduction, 5 chapters of content and conclusions.
The main results of the thesis are published in 09 published projects, including 01 article
published under SCI list, 01 article sent from SCI list submitted and reviewing, 05 articles on
National magazine, 01 article published in the Proceedings of the National Science
Conference, and registered 01 intellectual property (SC) has been published in the volume A
Industrial Ownership Gazette.
Main results of the thesis:
The influence and optimization of technological conditions on the structure and
magnetic properties of chitosan-coated Fe3O4 nanoparticles (CS) were investigated using
hydrothermal method.
Successfully fabricated magnetic fluids based on Fe3O4 particles by thermal
decomposition method by phase transformation and coating by polymer PMAO.
Fe3O4@PMAO liquid samples are highly durable in different conditions, single-dispersed,
uniform particles.
Evaluation of the toxicity of magnetic fluids on typical samples with different cell lines,
results are good IC50 index. Manufactured fluid Samples are not cytotoxic, which is the basis
for conducting subsequent experiments on animals.
Determined the relaxation rate of nuclear magnetic resonance imaging (MRI) of 2
systems Fe3O4@CS, Fe3O4@PMAO showed that the uniform fabrication systems have high
r2 values of over 150 mM-1s-1 for samples of Fe3O4@PMAO, higher than commercial products
Resovist. These substances, when given MRI imaging tests, show good potential for
applications to increase contrast.
In vitro, ex-vivo and in-vivo studies of MRI contrast enhancement showed that many of
the magnetic fluids of the manufacturing subject group exhibited good contrast enhancement.
Applying the Fe3O4@PMAO system to solid tumors under the skin and liver tumors, shows
the potential for observing the detailed shape and structure of the tumor, supporting diagnosis
and treatment.
CHAPTER 2. REVIEW OF SPINEL FERRITE MATERIAL AND MAGNETIC
RESONANCE IMAGING METHOD BY MRI SHOOTING ENGINEERING
1.1. The structure and magnetic properties of spinel ferrite materials
1.1.1. Structure of spinel ferrite
Ferrite spinel is the term used to refer to a material with a two-subnetwork structure of
which interactions are antiferromagnetic or magnetic ferrite. A basic cell unit of spinel ferrite
(with crystal lattice constant a ~ 8.4 nm) is formed by 32 atoms O2- and 24 cation (Fe2+, Zn2+,
Co2+, Mn2+, Ni2+, Mg2+, Fe3+ và Gd3+). In a base cell there are 96 positions for cations (64 in
octahedral position, 32 in tetrahedral position). The number of cations is more octahedral in
the tetrahedral position (A), in particular there are 16 cations occupied in the octahedral
position (B) while in the tetrahedral position there are only 8 cations (including valency cation
2+ or 3+).
1.1.2. Magnetic properties of spinel ferrite materials
According to molecular field theory, the magnetic origin in spinel ferrite materials is
due to the indirect exchange interaction between metal ions (magnetic ions) in two
subnetworks A and B through oxygen ions.
1.1.3. Magnetism of nanometer-sized particle magnetic materials
The superparamagnetic phenomenon (or status) occurs for ferromagnetic materials
composed of small crystalline particles. When the particle size is large, the system will be in
the multidomain state (i.e. each particle will be composed of many magnedomain particles).
When the particle size decreases, the substance will turn into a mono-state, which means that
each particle will be a dime. When the particle size decreases too small, the directional energy
(which predominantly dominates are that the crystal magnetic anisotropic energy is much
smaller than the thermal energy, then the thermal energy will break the parallel orientation of
magnetic moments) and then the magnetic moment of the particle system will orient
chaotically as in paramagnetic material.
1.2. The studying situation of nanomaterials in the domestic and abroad
In Vietnam, a number of research groups at the Institute of Materials Science,
International Training Institute for Materials Science - Hanoi University of Science and
Technology and Hanoi National University (VNU) have also announced their manufacture of
magnetic nanoparticles for biomedical applications and for basic research.
1.3 . Manufacture methods of magnetic fluids
1.3.1. Synthesizing methods of magnetic nanomaterials
For biomedical applications, the material is often made by a number of chemical
methods such as co-precipitation, solgel, microemulsion, hydrothermal, thermal
decomposition, microstorage, etc. Chemical methods can create nanoparticles with a quite
high uniformity and facilitate to be able to coat particles and transfer phase of the particles
from oil to water. Each of the above methods has different characteristics.
1.3.2. Particle coating technologies in water solvent
For nanoparticles synthesized by chemical methods in water solvents, the coating of
the particles or the functionalization of the nanoparticle surface after fabrication is a very
important factor to ensure both magnetic properties and biological compatibility. When
the surface is coated and functionalized, the nanoparticles easily disperse in a suitable
solvent and become homogeneous colloidal particles called magnetic fluids.
1.3.3. The process to transfer the phase from organic solvents to water solvents
In order to obtain high-quality magnetic nanoparticles, sample fabrication is usually
carried out in organic solvents at high boiling temperatures such as: benzyl ther, phenyl ether,
octadecene...Therefore, before being able to be used in Biomedical, these magnetic
nanoparticles need to be transferred from organic solvents to water solvents through phase
transfer processes.
1.4. Application of magnetic nanoparticle systems in biomedical
Magnetic nanoparticles have the potential to be applied in many different fields. In
biomedical, magnetic nanoparticles can be used to extract biological molecules using
magnetism, nano curcumin, and substances increasing contrast in magnetic resonance
imaging (MRI) and magnetic burning application for cancer treatment. However, this thesis
focuses on researching magnetic nanoparticle application orientation Fe3O4 to enhance
nuclear magnetic resonance imaging (MRI) affect.
CHAPTER 2. EXPERIMENTAL ENGINEERING
2.1. Summary of magnetic fluid system Fe3O4@CS by hydrothermal method
Magnetic nanoparticles Fe3O4@CS is synthesized by hydrothermal method according
to Figure 2.1 diagram.
Figure 2.1. Fabrication process of magnetic fluids Fe3O4@CS.
2.2. Summary of nanoparticle system Fe3O4@OA/OLA by thermal decomposition method
Nanoparticle system Fe3O4@OA/OLA is synthesized by thermal decomposition method
according to Figure 2.2 diagram.
Figure 2.2. Fabrication process of magnetic nanoparticles Fe3O4@OA/OLA.
2.3. Transfer the phase of nanoparticles slowly from organic solvents to water solvents
The phase transfer process of magnetic nanoparticles from organic solvent to water is
carried out according to the diagram of Figure 2.3.
F e 3O 4
F e 3O 4
F e 3O 4
Figure 2.3. PMAO encapsulation process.
2.3. Typical methods
Study the structure of the sample by X-ray diffraction techniques, electron microscopy.
Magnetic properties are surveyed by magnetic measurements on vibrating sample
magnetometer system. Using infrared absorption spectra, weight analysis to assess the
presence of functional groups on the particle surface and the mass reduction of the magnetic
particle-coated polymer layer. Dynamic laser scattering technique determines the
hydrodynamic size and durability of magnetic fluids.
2.4. Experimental planning method
In experimental chemical and chemical technology studies, there are many experimental
problems described as extreme problems: determining the optimal conditions of the process,
the optimal composition of the mixture... Experimental planning allows to simultaneously
change all the factors that affect the process and allow quantitative evaluation of basic effects
and simultaneous interaction effects of the elements, thereby optimizing chemical
technologies.
2.5. Evaluate the toxicity of fluids from cancer cells
Evaluate potentially lethal the cancer cells and healthy cells and intact cells of fabricated
magnetic fluid.
2.6. Testing the ability to contrast agent in MRI imaging techniques
MRI imaging experiment in T1, T2 is used for the researches of image contrast
enhancement of images of manufacturing materials (on 1.5T MRI scanner, SIEMENS
MAGNETOM, Germany).
CHAPTER 3. RESEARCH MAGNETIC FLUID BASED ON MAGNETIC IRON
OXIDE SYTHETISED BY HYDROTHERMAL METHOD
3.1. Implement the optimal three-level quadratic experimental planning
Run
1
2
3
4
5
6
7
8
9
10
11
12
13
Table 3.1. Levels of independent variables and experimental conditions
Variable levels
Temperature Time Concentration
Ms
0
3+
C
(h)
Fe (M)
(emu/g)
A
B
C
+
+
180
4,00
0,1
34,73
+
+
180
2,00
0,25
53,22
+
+
120
4,00
0,25
61,89
120
2,00
0,10
57,26
-1,414
0
0
107,57
3,00
0,17
55,38
1,414
0
0
192,43
3,00
0,17
63,21
0
-1,414
0
150
1,59
0,17
61,4
0
1,414
0
150
4,41
0,17
60,07
0
0
-1,414
150
3,00
0,07
46,67
0
0
1,414
150
3,00
0,28
59,96
0
0
0
150
3,00
0,17
66,67
0
0
0
150
3,00
0,17
63,32
0
0
0
150
3,00
0,17
64,68
0.05
p
-value
0.04
prob > F
Model
35.75
0,0068a
0.03
A
10.64
0,0038a
B
7.31
0,0457b
0.02
C
30.64
0,0116b
AB
9.27
0,0308b
0.01
AC
76,96
0,0031a
BC
5,83
0,0346b
0
2
A
33,46
0,0103b
B2
21,85
0,0185b
C2
107,69
0,0019a
Variable
2
R =0,9908
Figure 3.2. Analysis of variance (ANOVA) for full quadratic model and Model coefficient
estimated by linear regression (asignificant at 1% level; bSignificant at 5% level).
Giá trị F
C2
BC
A
A2
C
B2
AB
AC
B
p-value
Factor
Figure 3.3. Surface plot and contour plot of the combined effects of A and B (a); A and C
(b) on the yield of Ms at another coded level of zero
The suitability analysis of the model and the significance of the model assessed by
ANOVA analysis (Figure 3.2) and correlation indicators. The significance of the regression
coefficients is tested by standard F, with values p<0.05 indicating significant regression
coefficients. Thus, in Figure 3.2 found that the value of "Model F-value" is 35.75, the model
is completely statistically significant with 99.08% reliability. With all the factors of sample
incubation temperature, time, Fe3+ concentration and each pair of these factors have a value
of p<0.05, indicating that each of these factors also interact with each other and are
meaningful (Figure 3.2), this is illustrated more clearly when observing the response surface
in Figure 3.3.
Figure 3.4 describes the fit line according to the Langevin function of the samples at
optimal conditions M11 - M13 at the magnetism at the magnetism 10 kOe. Throught this
figure, the experimental data on the M(H) base line of all samples measured at 300K
temperature closely matched according to Langevin function with high accuracy (R2> 0.998).
Figure 3.4. Experimental and fitting hysteresis curves of the Fe3O4@CS nanoparticles (inset
is the enlarged hysteresis curve).
3.2. Structural and morphological characteristics of magnetic nanoparticles Fe3O4@CS
(a)
(b)
(c)
Figure 3.5. X-ray diffractions (a) and và FTIR spectrum (b) and TGA analysis (c) of Fe3O4,
CS and Fe3O4@CS samples.
Figure 3.5a shows all the diffraction lines of the samples coincide with the standard lines
of Fe3O4 with spinel structure. The combination with Chitosan makes the pics of the Fe3O4@CS
nano sample more noise than the pics of pure Fe3O4 samples but does not change the crystal
structure. Figure 3.5b (a) shows that, on the infrared spectrum of the sample Fe3O4@CS, there
are characteristic oscillations related to functional groups of Fe3O4 particles and CS cover. This
proves that Fe3O4 nanoparticles were covered by CS.
On TEM image (Figure 3.6), the spherical shaped particles with small size from 12-18 nm
and relatively uniform, the particles after covering Fe3O4@CS are larger than those of Fe3O4
before covering. However, the particles when dispersed in water have not been dispersed simple
shape, the groups have shinking phenomenon with the organic chitosan shell about 21.5%
(Figure 3.5c).
Figure 3.6. TEM images of the magnetic fluids Fe3O4@CS prepared by optimization
3.3. Characteristics of Fe3O4@CS magnetic fluid system durability
Figure 3.7. Hydrodynamic size distribution of Fe3O4@CS magnetic fluid at a) different pH of 2,
4.5, 7.4, 11.5 and 12 and b) different NaCl concentrations of 0, 50, 100, 200, and 300 mM.
By determining the strength of a sample of Fe3O4@CS fluid in a physiological field,
the fluid sample has a high durability in a wide pH range, long time and high strength when
the salt content is up to 300 mM. This shows that the samples of Fe3O4@CS fluid have suitable
properties in biomedical conditions.
3.4. Test and evaluation of the toxicity of chitosan-coated Fe3O4 magnetic fluid system
Figure 3.8. Sarcoma 180 cell’s viability after incubating with different concentration of
Fe3O4@CS MNPs after 48h: (C1): 500 µg/ml, (C2): 250 µg/ml, (C3): 125 µg/ml, (C4): 62,5
µg/ml, (C5): 30,25 µg/ml and (C6): 15,125 µg/ml. All presented values were expressed as
mean±standard deviation (SD) (a) and Observation of Sar.180 cells morphology under the
different concentrations of Fe3O4@CS using inverted microscope. CA: control with culture
medium. CB: control with DMSO. Objective lens: 20X, zoom: 5.6.
The results of MTT testing are shown in Figure 3.8, whereby Fe3O4@CS nanomagnetic
fluids are not toxic to Sarcoma 180 cells with 83% - 106% of survival cells after 48 hours of
incubation with nanomagnetic fluids with concentrations of 15.125 µg/ml and 30.25 µg/ml.
When increasing the concentration of nanoparticles up to 62.5 µg/ml, 125 µg/ml, 250 and 500
µg/ml, the rate of survival cells decreased respectively to 66.1%, 38.4%, 17.8% and 2.8135%.
Accordingly, the toxicity of the Fe3O4@CS nanomagnetic product is linear with concentration
when the increase in magnetic fluid concentration leads the reduction of cell growth. From
the in vitro test results and comparing with recent publications, it can be concluded that
chitosan- coated magnetic nanomaterial Fe3O4@CS are not toxic to Sarcoma 180 mouse
cancer cell line.
CHAPTER 4: STUDYING THE MAGNETIC FLUID SYSTEM BASED ON IRON
OXITE SYNTHETIZED BY THE THERMAL DECOMPOSITION METHOD
4.1. Effect of solvent and temperature on properties of Fe3O4 particle
Figure 4.1. TEM images of Fe3O4 synthesized at different reactions solvent and temperature
of 1 hours.
By surveying the effect of temperature, it was found that the sample was made at a
temperature lower than the solvent temperature for particles of small, uneven, and grainy size.
Dibenzyl ether solvents give heterogeneous particles in shape, uneven size compared to
octadecene solvents. Particles of uniform size with grain boundaries are more clear when the
reaction temperature is increased to 300 to 310 oC and 320 oC. This indicates that the
temperature and nature of the solvents are important factors in the formation and development
of particles.
Figure 4.1. The M(H) curves of Fe3O4 synthesized at different reactions solvent (inset is the
enlarged hysteresis curve)
The value from Ms saturation increased from 51 emu/g (OIO-DIO1) to 59 emu/g (OIODIO2) and 62 emu/g (OIO-DIO3) when changing the reaction temperature from 270oC đến
310oC (Figure 4.1c).
4.2. Effect of reaction time on magnetic structure and properties
Figure 4.2. TEM images of Fe3O4 synthesized at different reaction times
Figure 4.2 shows that all models are composed of cubic and spherical particles with
relatively uniform dimensions. The average particle size (DXRD) of samples increased from
5.2 nm to 11.2 nm corresponding to reaction time increased from: 0.5 hours to 2 hours.
Looking at TEM images, we find that grain boundaries become more pronounced when
reaction time increases.
Figure 4.3 shows the magnetization curves of fabricated Fe3O4 samples with different
reaction times. Thus, by changing the reaction time, the single-phase Fe3O4 nanoparticles
samples have the size from 7.52 nm to 13.15 nm correspond to the price magnetic values
increased from 53 emu/g to 65 emu/g. However, prolonged time can lead to large particle size
so that the value of magnetic coercivity is large and may not reach superparamagnetic state.
Figure 4.3. The M(H) curves of Fe3O4 synthesized at different reactions times (inset is the
enlarged hysteresis curve) (a) and HRTEM images of OIO-DIO5 samples (b).
4.3. Manufacturing magnetic fluids containing Fe3O4 magnetic nanoparticles coated
with PMAO
F e 3O 4
F e 3O 4
F e 3O 4
(b)
(a)
Figure 4.4. Fe3O4 nanoparticle before and after encapsulating PMAO in hexane and water
(a); HRTEM images of Fe3O4 nanoparticles before and after encapsulating PMAO (b)
Figure 4.4a is a photograph of the sample before and after the phase transfer with PMAO
in n-hexane and water solvent. It can be seen that the sample before coating PMAO is
dispersed very well in hexane and completely not dispersed in water. After coating PMAO,
the surface of Fe3O4 particles becomes hydrophilic and disperses well in water, not dispersed
in hexane. Thus, it can be determined that the polymer layer has covered the surface of the
particles and helps them stabilize and disperse well in water.
Hình 4.5. TEM images of Fe3O4 nanoparticles encapsulating PMAO after dilution solvent.
Observation of TEM and HR-TEM images in Figure 4.4 and Figure 4.5 showed that the
coated samples still have spherical shape, with uniform- distributed particle size. The particle
size of the coated samples is larger than the particle size of the original sample, corresponding
to the average size of 9.6 nm and 12.1 nm.
Figure 4.6. The M(H) curves of Fe3O4, Fe3O4@PMAO samples (a); FTIR spectrum of
Fe3O4, Fe3O4@OA, OLA and Fe3O4@PMAO (b)
From Figure 4.6, it can be seen that the experimental data on the M(H) base line of the
uncoated sample (Fe3O4) and the fluid sample contains of Fe3O4@PMAO particles
completely follow Langevin function, it can be assumed that these magnetic fluid samples is
superparamagnetic at room temperature.
Figure 4.7. The zeta potential scanning of the nanoparticles dispersed in fluids at different
times: for 0 day (a), 3 months (b), 6 months (c) of the Fe3O4@PMAO MNPs.
The responsiveness on durability in body physiology environment is also one of the
requirements for magnetic nanoparticles for biomedical applications. As we know, the salt
concentration in the body remains in the range of 165 ÷ 180 mM, pH ~ 7.5. Therefore, we
investigated the strength of the phase-transferred samples in physiological salt medium with
concentrations of 100 mM, 200 mM, 250 mM and 300 mM, respectively, with a pH of 7.5.
The survey results show that synthetic PMAO coated particles completely meet the durability
requirements for biomedical purposes.
Figure 4.8. The Zeta potential of PMAO coated Fe3O4 NPs dispersed in fluids at different
NaCl concentrations.
4.4. Test and evaluation of the toxicity of Fe3O4 phase-transferred and PMAO coated
fluid system
Figure 4.9. The toxicity of Fe3O4 phase-transferred and PMAO coated fluid system to cells line
Hep-G2, MCF-7 and RD. The cells incubated with Fe3O4 25 µg/ml. Objective lens: 40X.
Cellular toxicity of the PMAO magnetic nanomaterials system is assessed on three
human cancer cell lines Hep-G2, MCF-7, RD and a healthy cell line from Vero using the
Sulforhodamine B (SRB) method. Results of SRB analysis on the four cell lines shown in
Figure 4.9 showed that DMSO at the test concentration did not have a toxic effect on the cell
with 100% of proliferating cells while the standard matter in the positive check sample is
nearly exterminated all cancer cells rightly after 72 hours and inhibit strong overgrowth for
healthy cells. Compared with the results of incubation disc and Fe3O4@PMAO magnetic
nanoparticles, the values were almost unchanged against solvent control with the rate of
overgrowth cells on the cell lines Hep-G2, MCF-7, RD and Vero are 95.45%, 99.64%,
99.63% respectively in 100%. Thereby, it was concluded that the Fe3O4@PMAO system has
absolutely no toxic effect on these four cell lines. This shows that Fe 3O4@PMAO materials
have great potential in image diagnosis and cancer treatment applications.
CHAPTER 5: REHABILITATION CHARACTERISTICS R1, R2, TOXIC TEST
AND EVALUATION OF IMAGE CONTRAST WITH MRI MAGNETIC
RESONANCE IMAGING
5.1. Evaluation of the recovery rate r1, r2 of the magnetic fluid system
Figure 5.1 and Figure 5.2 are magnetic resonance images of Fe3O4@PMAO fluid
samples at concentrations of 2.5 µg/ml, 5.0 µg/ml, 10 µg/ml, 15 µg/ml, 25 µg/ml and 30
µg/ml in T1, T2 mode in different shooting conditions of TR and TE values.
TE = 12; TR = 100
TE = 12; TR = 200
TE = 12; TR = 400
Figure 5.1. MRI images of the magnetic fluids samples by different concentrations taken by
the T1W status, TR= 100 ms (a), TR =200 ms (b), TR =400 ms (c), TE =12 ms with (A)
Fe3O4@PMAO, (B) Fe3O4@CS. The sample magnetic fluids prepared by different
concentrations of (1) 2,5 µg/ml, (2) 5,0 µg/ml, (3) 10,0 µg/ml, (4) 15,0 µg/ml, (5) 25,0 µg/ml
and (6) 30,0 µg/ml.
TE = 11; TR = 3970
TE = 23; TR = 3970
TE = 57; TR = 3970
TE = 91; TR = 3970
TE = 34; TR = 3970
TE=113; TR=3970
TE = 91; TR = 3970
Figure 5.2. MRI images of the magnetic fluids samples by different concentrations taken by
the T2W status, TE =11 ms (a), TE =23 ms (b), TE = 34 ms (c), TE= 57 ms (d), TE =91 ms
(e), TE =113 ms (f), TR =4000 ms with (A) Fe3O4@PMAO, (B) Fe3O4@CS in agarose
media 2%%. The sample magnetic fluids prepared by different concentrations of (1) 2,5
µg/ml, (2) 5,0 µg/ml, (3) 10,0 µg/ml, (4) 15,0 µg/ml, (5) 25,0 µg/ml and (6) 30,0 µg/ml.
From Figure 5.1 and Figure 5.2, we see that agar 2% check sample with white image
has a concentration of C = 0 µg/ml (there is no concentration of the fluid sample
Fe3O4@PMAO). Six white to black order images placed in the wells from left to right are
samples with corresponding concentrations: 2.5; 5; 10; 15; 25; and 30 µg/ml. The contrast
changes very clearly when changing a small amount of concentration of the sample
Fe3O4@PMAO. MRI image contrast agents have the same effect increasing the signal value
of T1 imaging mode (increasing the recovery speed along R1) and reducing the T2 signal
imaging mode (reducing the horizontal relaxation rate R2). The inverse of the recovery times
T1 and T2 is the recovery rate R1, R2. However, the increase or decrease ability of this signal
depends on the reversibility of ri (i = 1,2, corresponding to vertical recovery and horizontal
recovery) of each specific magnetic fluid. The reversibility of ri of magnetic fluids can be
determined from a linear relationship between Rx relaxation rate:
R1,2 = 1/T1,2 = Ro1.2 + r1.2.C
(5.1)
Figure 5.3. Exponential decay curve for T2 signal intensity with increasing
concentration of Fe3O4@PMAO (a) Fe3O4@CS (b)
(a)
(b)
Figure 5.4. The plot of T2 relaxation rate (1/T2) (a); (b) T1 relaxation rate of Fe3O4@CS
nanoparticles at 1.5 T for different Fe concentration.
Figure 5.1. Matching the dependent function of R1 and R2 to the fluid sample
concentration according to the expression (5.1) shows that this dependence is linear. From
Figure 5.1, we see that our phase-transferring magnetic fluid samples, coated with PMAO and
CS give a horizontal recovery much higher than the value of Resovist and some commercial
products. Thus, as expected, the fluid from superparamagnetic particles based on our Fe3O4
can be used as a MRI imaging contrast enhancer under a good T2 regime.
5.2. Evaluation of the in vitro magnetic resonance imaging contrast ability in different
environments
5.2.1. Evaluate the contrast ability in the water environment of magnetic fluids and Resovist
commercial products.
(a)
(b)
Figure 5.5. MRI images of the magnetic fluids samples by different concentrations taken by
the T2W status, TE= 62 ms (a), TE =75 ms (b), TR =4000 ms with (A) Fe3O4@PMAO in
water, (B) Fe3O4@Dextran (Resovist) in water, (C) Fe3O4@CS, (D) control with water
(with the concentration C=0 µg/mL). The sample magnetic fluids prepared by different
concentrations of (1) 5,0 µg/ml, (2) 10,0 µg/ml, (3) 15,0 µg/ml, (4) 30,0 µg/ml, (5) 45,0
µg/ml.
When removing affect of factors such as protein and lipid from the cells, MRI image
in the water shows PMAO polymer coating Fe3O4 gives better contrast than T2, resovist give
better contrast than T1.
TE=15; TR=100 (a)
TE=15; TR=400 (b)
Figure 5.6. MRI images of the magnetic fluids samples by different concentrations taken by
the T1W status, TR= 100 ms (a), TR =400 ms (b), TE =15 ms with (A) Fe3O4@PMAO in
water, (B) Fe3O4@Dextran (Resovist in water, (C) Fe3O4@CS; (D) control with water (with
the concentration C=0 µg/mL). The sample magnetic fluids prepared by different
concentrations of (1) 5,0 µg/ml, (2) 10,0 µg/ml, (3) 15,0 µg/ml, (4) 30,0 µg/ml, (5) 45,0
µg/ml.
From Figure 5.5, we see that the distilled water check sample in the final well series
(vertical column) with a white image has concentration of C = 0 µg/mL (no concentration of
fluid samples Fe3O4@CS, Fe3O4@PMAO, Resovist). Three ranges of top-down horizontal
wells were prepared in accordance with the concentrations of Fe3O4@PMAO, Resovist and
Fe3O4@CS hydrothermal samples with respective concentrations: 5, 10, 15, 30 and 45 µg/ml.
The contrast changes very clearly when changing a small amount of concentrations of
Fe3O4@CS, Fe3O4@PMAO as well as Resovist commercial products.
The difference in contrast in the T2W shooting mode (Figure 5.5) is very clear. It is
shown that the dark signal gradually increases with the concentration of nanomaterials in the
wells compared to biological control (well 6) as well as comparison between different
samples. At high concentrations such as 30 µg/ml of the Fe3O4@PMAO fluid sample, the
dark signal almost occupies the entire well, even if there is no bright signal (well No. 4) when
shooting in TE, TR mode appropriately, it shows that the Fe3O4@PMAO magnetic fluid
system has a higher saturation value, which gives better image contrast. Between two samples
Fe3O4@CS fabricated by hydrothermal and Resovist method, when shooting in T2W mode,
the contrast is compared to the check sample, the contrast image is similar.
5.2.2. Evaluation of contrast ability in changed pH environment of manetic fluid system
and Resovist commercial product.
TE=34; TR=3970 (c)
TE=57; TR=3970 (d)
Figure 5.7. MRI images of the magnetic fluids samples by different concentrations taken by
the T2W status, TE= 11 ms (a), TE = 23 ms (b), TE =34 ms (c), TE =57 ms (d) with (A)
Fe3O4@PMAO in water, (B) Fe3O4@Dextran (Resovist in water. The sample magnetic
fluids prepared by the concentration incubated with Fe3O4 45.0 µg/ml of (1) pH =2, (2) pH
=3, (3) pH =7, (4) pH =9, (5) pH =12.
MRI images on different pH environments showed polymer-coated Fe3O4 gave better
contrast at T2 and the signal strength decreased sharply at pH = 7, resovist samples gave good
contrast at T2, lower signal strength (well No. 3).
TE=12; TR=100 (a)
TE=12; TR=200 (b)
TE=12; TR=400 (c)
Hình 5.8. MRI images of the magnetic fluids samples by different concentrations taken by
the T1W status, TR= 100 ms (a), TR = 200 ms (b), TR =400 ms (c), TE =12 ms (d) with (A)
Fe3O4@PMAO in water, (B) Fe3O4@Dextran (Resovist in water. The sample magnetic
fluids prepared by the concentration incubated with Fe3O4 45.0 µg/ml of (1) pH =2, (2) pH
=3, (3) pH =7, (4) pH =9, (5) pH =12.
The difference in image contrast in the T2W shooting mode (Figure 5.7) is shown more
clearly than in T1 mode (T1W) (Figure 5.8). It can be clearly seen that the signal the is almost
unchanged when increasing the pH value of the environment from 2 to 12. In the physiological
environment of the Fe3O4@PMAO fluid sample, the dark signal almost occupies the entire
well, even not also see a light color signal (well No. 3) when shooting in the appropriate TE,
TR mode, which shows that the Fe3O4@PMAO magnetic fluid system provides good image
contrast, equivalent to the suitable Resovist commercial product according to MRI
application.
5.2.3. Evaluation of contrast ability in environment with changing salt concentration of
magnetic fluid system and Resovist commercial product.
TE=57; TR=3970 (a)
TE=75; TR=3970 (b)
TE=87; TR=3970 (c)
Figure 5.9. MRI images of the magnetic fluids samples by different NaCl concentrations.
taken by the T2W status, TE =57 ms (a), TE =75 ms (b), TE 87 ms (c), TR =3970 ms with
(A) Fe3O4@Dextran (Resovist in water), (B) Fe3O4@PMAO in water, (C) control with
water. The sample magnetic fluids prepared by the concentration incubated with Fe3O4 45.0
µg/ml of (1) 50 mM, (2) 100 mM, (3) 150 mM, (4) 200 mM.
MRI images on the environment with different concentrations of salt showed that
polymer-coated Fe3O4 and resovist samples gave better contrast at T2 and good signal strength
even at high salt concentration environment (200 Mm). This shows that Fe3O4@PMAO fluid
samples have suitable properties in biomedical conditions.
TE=12; TR=100 (a)
TE=12; TR=400 (b)
Figure 5.10. MRI images of the magnetic fluids samples by different NaCl concentrations.
taken by the T1W status, TR= 100 ms (a), TR =400 ms (b), TE =12 ms with (A)
Fe3O4@Dextran (Resovist in water), (B) Fe3O4@PMAO in water, (C) control with water.
The sample magnetic fluids prepared by the concentration incubated with Fe3O4 45.0 µg/ml
of (1) 50 mM, (2) 100 mM, (3) 150 mM, (4) 200 mM.
5.3. Survey of applicability of magnetic fluids on laboratory animals
5.3.1. In-vivo test assesses the applicability of nanomagnetic Fe3O4 fluid system as a
contrast drug in MRI magnetic resonance imaging technique in animals
MRI images on rabbits before and after injecting magnetic fluids were taken in different
types of shooting (SAGITAL and CORONAL), taken in T1 mode (vertical recovery) and
taken in T2 mode (horizontal recovery) shown in Figure 5.11 to Figure 5.12.
Hình 5.11. T1 weighted (Sagital) MR images showing rabbit liver (A) before injection of
contrast agent (B) after injection of contrast agent with TE= 9,2 ms, TR =659
Figure 5.11 and Figure 5.12 show that the image of rabbit parts before injection almost
are gray, not clearly distinguish the boundary of the internal organs of Rabbit. After injecting
Fe3O4@PMAO magnetic fluid, it shows that image in T1 ode has a slight change in contrast
intensity.
Figure 5.12. T2 weighted (Sagital) MR images showing rabbit liver (A) before injection of
contrast agent (B) after injection of contrast agent with TE= 94 ms, TR =3571 ms
The results showed that after 10 minutes of injection (the Fe3O4@PMAO magnetic fluid
sample) the internal organs of rabbits on MRI images showed more clearly than the MRI
images before injecting drugs. Compared to MRI images taken in T1 mode, MRI images taken
in T2 mode give much clearer contrast. At liver tissue position, when taking T1 mode with TR
= 659 ms, TE = 9.2 ms with spin-echo impulse, the brightness and darkness of images in liver
tissue are almost unchanged with the intensity ratio signal before injection Ia = 325 and signal
strength after injection Ib = 369. While taking image under T2 mode (TR = 3571 ms, TE = 94
ms with turbo spin echo - TSE impulse sequence), the brightness and darkness of the image
at the liver tissue changes with the decreased ratio of signal strength Ia/Ib = 2.3 times.
Hình 5.13. T2 weighted (Coronal) MR images showing rabbit (A) before injection of
contrast agent (B) after injection of contrast agent (a) for 0 minute (b)for 30 minutes (c) for
60 minutes with TE= 112 ms, TR =7500 ms
From Figure 5.13 shows that, after 30 minutes of injection (Fe3O4@PMAO magnetic
fluid sample) image (B), the rabbit's internal organs on MRI images have been shown more
clearly than MRI images before injection (Figure A) Specifically when taking an area in liver
tissue before and after the injection is 1.6 -1.8 cm2 respectively, the signal strength decreases
from 88.1 to 35.8 (corresponding to decrease 2.46 times compared with before injection. This
shows that magnetic fluids have the ability to change the contrast very strongly. With MRI
images taken at 60 minutes (C), the images are as clear as MRI images at time of 30 minutes
(B).
5.3.2. In-vivo test assesses the applicability of nanomagnetic fluid system Fe3O4 as a
contrast drug in cancer diagnosis using MRI magnetic resonance technique in animals
Solid tumor under the skin 15 days old in the thighs of mouse. The tumor is thick, not
necrotic and has a relatively homogeneous structure. We performed an MRI scan and obtained
images at the time immediately after direct injection of Fe3O4@PMAO magnetic fluid system
into mouse tumors and injecting intravenously (Figure 5.14 and Figure 5.15). To assess the
distribution of the Fe3O4@PMAO nano system in solid tumors under mouse skin, the tumor
after injection of the magnetic nanoparticle will be monitored over time under a 90° imaging
angle under Axial and Coronal style.
In Figure 3.9, the tumor of mouse C, F, G. The tumor of mouse C, E, F, and G show a
much higher contrast (darker) than the tumor of mouse B. Signal strength in the tumor varies
from 284.6 to 249, corresponding to mouse F and G. This indicates that the magnetic fluid
began to spread evenly throughout the tumor and changed the signal strength. While for mouse
C, although the intravenous fluids also had a signal change in the tumor clearly, specifically the
signal strength in mouse treated with cancer B was 296.5 downed 226.8.
Figure 5.14. T2 weighted (Coronal)MR images showing solid tumor mice with TE= 91 ms, TR
=3970 ms
With an average bidirectional size of about 15x10 mm, under normal conditions, there is
almost no observation of the tumor on the mousebody. However, after injecting the
nanomagnetic system of Fe3O4@PMAO, it can be seen that a dark area with a shape similar to
the tumor appears on the image (Figure 3.9). Thus, the presence of magnetic nanoparticles
supported 1.5T magnetic resonance imaging system to detect tumors at low material
concentrations (magnetic particles 0.18 mg). (Figure 3.10). Thus, the amount of 0.18 mg of
magnetic particles allows to detect the tumor in the image but not enough for the nano-system
can be spread to the entire tumor within 15 minutes, the shooting signal shows that
nanomaterials are almost covered the entire tumor at 30 minutes after injecting and maintaining
continuously for nearly 1 hour afterwards (Figure 3.10).