Postharvest losses during the marketing of large cardamon and ginger spices crops in east district of Sikkim
Bạn đang xem bản rút gọn của tài liệu. Xem và tải ngay bản đầy đủ của tài liệu tại đây (563.83 KB, 9 trang )
Int.J.Curr.Microbiol.App.Sci (2019) 8(5): 1274-1282
International Journal of Current Microbiology and Applied Sciences
ISSN: 2319-7706 Volume 8 Number 05 (2019)
Journal homepage:
Original Research Article
/>
Postharvest Losses during the Marketing of Large Cardamon and Ginger
Spices Crops in East District of Sikkim
Archana Sharma and Amod Sharma*
Department of Agricultural Economics, Nagaland University SASRD, Medziphema Campus,
District: Dimapur - 797 106, Nagaland, India
*Corresponding author
ABSTRACT
Keywords
Postharvest losses,
Cardamon,
Ginger, Sikkim
Article Info
Accepted:
12 April 2019
Available Online:
10 May 2019
The present study on post-harvest losses during the marketing of large cardamom and
ginger spices crops in the East district of Sikkim state was initiated during the year 2017 to
2019 with the selection of 80 numbers of respondents and it was categorized into three
groups viz., marginal. Small and semi-medium size groups based on available cultivable
land under the both selected spices crops. To achieve the specific objectives of the present
study a multi stage purposive stratified random sampling method was adopted. Further
data reveals that on the selected farm size group the majority of the respondents (50.00 per
cent) belonged to small land holding with an area of 1.01 ha to 2.00 ha. The post-harvest
losses incurred for large cardamom at farmer's level was found maximum on marginal
with 24.83 per cent and on the overall farm size group it was found to be 20.04 per cent.
The overall post-harvest losses incurred for large cardamom at wholesaler, auction and
retailer level was found to be 0.0008 kg. The post-harvest losses incurred at farmer’s level
were found maximum on semi-medium farmers with 3.00 per cent. While the post-harvest
losses incurred at traders’ level at various stages of marketing of ginger. The highest
estimated loss was incurred by wholesalers with 3.00 per cent, followed by retailers with
2.80 per cent and Processors with 2.30 per cent, respectively.
Introduction
IFOAM defines organic agriculture as “a
production system that sustains the health of
soils, ecosystems and people. It relies on
ecological processes, biodiversity and cycles
adapted to local conditions instead of using
inputs with adverse effects. Organic
agriculture combines tradition, innovation and
science to promote fair relationships and a
good standard of life for all involved
(IFOAM, 2000). According to the latest FiBL
survey on certified organic agriculture
worldwide, there were 57.81 million hectares
of organic agricultural land in 2016. The
regions with the largest areas of organic
agricultural land are Oceania (27.32 million
hectares) and Europe (13.51 million hectares).
Latin America has 7.12 million hectares, Asia
(4.90 million hectares), North America (3.1
million hectares) and Africa (1.8 million
hectares). The countries with the most organic
agricultural lands are Australia (27.4 million
hectares), Argentina (3 million hectares), and
China (2.31 million hectares) (Willer and
Lernoud, 2018). As on 31st March 2018, total
area under organic certification process
(registered under National Programme for
1274
Int.J.Curr.Microbiol.App.Sci (2019) 8(5): 1274-1282
Organic
Production)
is 3.56
million
Hectare (2017-18). Madhya Pradesh has
covered largest area under organic
certification
followed
by
Rajasthan,
Maharashtra and Uttar Pradesh (APEDA,
2019).
Large cardamom (Amomum subulatum, Roxb)
is a member of the family Zingiberacea under
the order Scitaminae (Bisht et al, 2011). It is
believed that Sikkim is the place of origin for
cardamom (Adhikari, 2016). Nepal is the
largest producer of large cardamom in the
world; more than 95% of the produce is
marketed to India, the largest exporter of
large cardamom (Sharma et al, 2018).
Ginger (Zingiber officinale Rosc.) is
cultivated in India, China, Japan, Indonesia,
Australia, Nigeria and West Indies. India is
the largest producer and consumer of ginger
in the world (Anonymous, 2018). It is one
among the regionally advantageous crops in
the Northeast India. Among North Eastern
States, Sikkim ranks third in area and fifth in
production as well as productivity (Rahman et
al, 2007).
Bhutia et al., (2017) in their paper entitled
“Post-harvest and value chain management of
large cardamom in hills and uplands” have
mentioned that the post-harvest value chain
consisted of growers, collectors, traders, and
exporters. The losses in the field vary from
5.00 to 10.00 per cent which may go up to
80.00 per cent in case of disease affected
materials.
India exports large cardamom to Australia,
Canada, Pakistan, UK, etc. They also
mentioned that Singtam, Gangtok, Jorethang,
Rongli, and Mangan etc. are the major local
markets in Sikkim. Siliguri is the main trade
link from where it is distributed to Guwahati,
Kolkata and Delhi. NERAMAC along with
the Spices Board of India conducts auctions
for the sale of large cardamom to provide
remunerative prices to the farmers. The rate
of commission charged is only 1.00 per cent.
In the absence of NERAMAC the marketing
of large cardamom is left solely at the hands
of the middlemen of the region who have
control over the prices of large cardamom.
The growers have little or no idea regarding
marketing and as a result they sell the produce
at a much cheaper rate.
Agriculture marketing is not regulated in the
state so the marketing of horticultural produce
is unorganized. Largest fruits and vegetables
market is Kanchenjunga Complex in Gangtok
which is occupied by wholesalers and
retailers. NERAMAC, SIMFED and few
farmers’ groups and individuals have outlets
in the complex. There is no other facility
available as per the APMC guideline.
Government made effort to organize
horticulture trade by locating it under one
regulated market in East Sikkim but due to
non-interest of traders it could not be
implemented (Anon, 2017).
Materials and Methods
Sikkim is a small state with only four districts
and sixteen sub-divisions. This state was
chosen primarily due to the lack of academic
research in the field of post-harvest as well as
marketing of organic spices. Spices are grown
in almost all the districts; however large
cardamom and ginger are the two major cash
crops and important source of income for the
farmers in the East district of Sikkim, which
is also a hub of all administrative activities.
For the present study out of total eight
developmental blocks two blocks were
selected randomly viz., Khamdong and Regu.
For the marketing cost and post-harvest
activities / information altogether 10 numbers
of marketing agencies were selected with the
help of FPO's and Progressive organic
farmers viz., 5 wholesalers and 3 retailers
along with two marketing institutes viz.
1275
Int.J.Curr.Microbiol.App.Sci (2019) 8(5): 1274-1282
SIMFED and NERAMAC all are actively
functional in the state with the help of the
Assistant Managers of both the institutes.
Table 1 reveals the distribution of respondents
of sample size according to the land holding
size groups, the majority of the respondents
(50.00 per cent) belonged to small (having an
land holding of 1.01 ha to 2.00 ha) even the
total household of the selected area is almost
same, while 28.75 per cent of the respondents
were of semi-medium group (having an land
holding of 2.01 ha to 3.00 ha) will be same
and 21.25 per cent were of marginal farm size
group (having an land holding of 0.02 ha to
1.00 ha) is almost same to the population of
household size, respectively. Similar research
finding were reported by Sharma et al.,
(2016) and Walling et al., (2017).
Post-harvest loss estimation of large
cardamom and ginger at different stages of
marketing
To evaluate the post-harvest losses in the
cultivation of large cardamom and ginger,
Egyir et al., (2008) stated that there are no
accepted methods for evaluating post-harvest
losses of fresh produce whatever evaluation
method used maybe due to the result referred
only to a described situation.
Similar studies carried out by (Sharma and
Sharma, 2008); (Pongener and Sharma,
2018).
The formula used was percentage (%) TQL =
Q/TQ x 100
Where as:
% TQL = percentage post- harvest loss per
commodity.
Q = mean quantity loss of the commodity.
TQ = mean total quantity loss of the
commodity.
Results and Discussion
The post-harvest losses can occur at any stage
of the marketing chain, while the post-harvest
losses in terms of horticultural aspects are
different from economic aspects. In case of
large cardamom as stated by the respondents
weight or moisture loss during drying was the
only loss incurred. However, moisture loss is
an important aspect for drying of capsules in
order to reduce bulk while marketing and
cannot be considered as economic loss. Thus,
there was no economic loss involved at
farmer’s level.
Table 2 reveals the post-harvest losses
incurred for large cardamom at farmer's level
was found to be maximum on marginal farm
size group with 24.83 per cent, followed by
19.42 per cent on small farm size group and it
was least on semi-medium farm size group
with 18.77 per cent, whereas on the overall
farm size group it was found to be 20.04 per
cent, respectively. Similar studies carried out
by Sharma (2012); Walling and Sharma
(2015); Shuya and Sharma (2014); Shuya and
Sharma (2018).
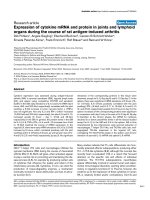
Table 3 reveals the post-harvest losses
incurred for large cardamom at wholesaler,
auction and retailer level, while it was found
maximum on Auction platform with an
average losses per kg of 0.0012 kg (0.00099
per cent), followed by 0.0007 kg (0.00102 per
cent) on Wholesaler and it was found to be
least on Retailers of 0.0006 kg with 0.00079
per cent, whereas on the overall / average
losses was found to be 0.0008 with 0.00094
per cent, respectively. Similar studies carried
out by Sharma (2011); (Sharma et al., 2016).
Table 3 reveals that the post-harvest losses
incurred at different stages of marketing. The
estimated loss was found to be very low at
every level as large cardamom capsules are
sold only after drying. The estimated loss was
1276
Int.J.Curr.Microbiol.App.Sci (2019) 8(5): 1274-1282
found to be highest at auction level (0.00099
per cent) due to the fact that farmers prefer to
sell the produce only when they get
satisfactory prices. The withdrawn lots are
stored for a long time till the next auction
takes place. Similar studies carried out by
(Dharkre and Sharma, 2010).
Table 4 reveals that the post-harvest losses
incurred at farmer’s level at various stages of
marketing of ginger. The highest estimated
loss was for medium farmers (3.00 per cent),
followed by small and marginal farmers (2.00
per cent) each, respectively. Similar studies
carried out by Sharma et al., (2018).
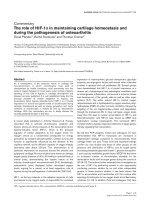
Table 5 reveals that the post-harvest losses
incurred at traders’ level at various stages of
marketing of ginger. The highest estimated
loss was incurred by wholesalers (3.00 per
cent), followed by retailers (2.80 per cent) and
Processors (2.30 per cent), respectively.
Similar studies carried out by Sharma (2012);
Sharma et al., (2018).
Table.1 Selection of sample respondents on different farm size groups
S. N.
Land holding / Category
Total house hold
Sample size
Percentage
1.
Marginal (0.02 to 1.00 ha)
172 (21.13)
17
21.25
2.
Small (1.01 ha to 2.00 ha)
408 (50.12)
40
50.00
3.
Semi-medium (2.01 ha to 3.00 ha)
234 (28.75)
23
28.75
814 (100.00)
80
100.00
Total
(Parenthesis indicate percentage to total)
Table.2 Post-harvest losses incurred for large cardamom at farmer’s level
Sl.
No.
1.
2.
3.
4.
Farm size groups
Marginal
Small
Semi-Medium
Overall
Average quantity of raw
capsules produced (Kg)
288.57 (100.00)
444.70 (100.00)
875.33 (100.00)
536.20 (100.00)
Average quantity
after drying (Kg)
71.64 (24.83)
86.37 (19.42)
164.33 (18.77)
107.45 (20.04)
Table.3 Post-harvest losses incurred for large cardamom at wholesaler, auction and retailer level
Sl. No. Marketing/
Intermediate
Agencies
Wholesalers
1.
Auction Platform
2.
Retailers
3.
Overall / Average
4.
Average
quantity
procured (kg)
68.58
121.75
75.07
88.47
1277
Average
loss (kg )
Estimated
loss
to
quantity procured (%)
0.0007
0.0012
0.0006
0.0008
0.00102
0.00099
0.00079
0.00094
Int.J.Curr.Microbiol.App.Sci (2019) 8(5): 1274-1282
Table.4 Post-harvest losses incurred for ginger at farmer’s level
Sl. No.
Farm size
groups
Marginal
Small
Medium
Average
1.
2.
3.
4.
Average Average
Price per
Price per
Estimated
quantity loss (Kg)
Kg
kg
loss to
produced
through
through
quantity
(Kg)
wholesalers processors produced (%)
(Rs )
(Rs)
760.7143
15.21
40
30
2.00
829.6078
16.592
40
30
2.00
1381.333 41.4399
40
30
3.00
990.5518 24.41397
40
30
2.33
Table.5 Post-harvest losses incurred for ginger at wholesaler, processor and retailer level
Sl. No. Particulars
Average quantity
procured (Kg)
760.69
Average loss
(Kg)
22.21
Estimated loss to
quantity procured (%)
2.92
1.
Wholesalers
2.
Processors
700.02
16.10
2.30
3.
Retailers
760.67
21.29
2.80
4.
Average
740.46
19.87
2.67
Fig.1 Trend in area, production and productivity of large cardamom in East Sikkim
350
AREA(000HA)
300
250
PRODUCTION(000MT)
200
PRODUCTIVITY(Kg/Ha)
150
100
Expon. (AREA(000HA))
50
1278
2016-2017
2014-2015
2012-2013
2010-2011
2008-2009
2006-2007
2004-2005
2002-2003
2000-2001
1998-1999
0
Expon.
(PRODUCTION(000MT))
Expon.
(PRODUCTIVITY(Kg/Ha)
)
Int.J.Curr.Microbiol.App.Sci (2019) 8(5): 1274-1282
Fig.2 Trend in area, production and productivity of ginger in East Sikkim
8000
7000
AREA(000HA)
6000
5000
PRODUCTION(000MT)
4000
3000
PRODUCTIVITY(Kg/Ha)
2000
1000
Expon. (AREA(000HA))
1998-1999
1999-2000
2000-2001
2001-2002
2002-2003
2003-2004
2004-2005
2005-2006
2006-2007
2007-2008
2008-2009
2009-2010
2010-2011
2011-2012
2012-2013
2013-2014
2014-2015
2015-2016
2016-2017
2017-2018
0
Expon.
(PRODUCTION(000MT))
Expon.
(PRODUCTIVITY(Kg/Ha))
875.33
Fig.3 Estimation of post-harvest losses in large cardamom incurred at farmers level
900
800
Average quantity
of raw capsules
produced (Kg)
700
Marginal
Small
Medium
Average
1279
107.45
536.2
444.7
200
100
0
164.33
300
86.37
400
71.64
500
288.57
600
Average quantity
after drying (Kg)
Int.J.Curr.Microbiol.App.Sci (2019) 8(5): 1274-1282
121.75
Fig.4 Estimation of post-harvest losses in large cardamom incurred at intermediaries’ level
140.00
68.58
75.074
100.00
80.00
88.47
120.00
0.000935165
0.000833333
0.000799211
0.0006
0.000985626
20.00
0.0012
0.0007
40.00
0.001020656
60.00
0.00
Wholesalers
Auction
Average quantity procured (Kg)
Retailers
Average loss (Kg)
Average
Estimated loss to quantity produced (%)
Fig.5 Estimation of post-harvest losses in ginger incurred at farmers’ level
760.71
1000.00
829.61
1200.00
Average quantity
produced (Kg)
990.55
1381.33
1400.00
Average loss (Kg)
800.00
600.00
24.41
41.44
16.59
200.00
15.21
400.00
0.00
Marginal
Small
Medium
1280
Average
Estimated loss to
quantity produced (%)
Int.J.Curr.Microbiol.App.Sci (2019) 8(5): 1274-1282
Fig.6 Estimation of post-harvest losses in ginger incurred at intermediaries’ level
500.00
Average
quantity
procured (Kg)
740.46
700.02
600.00
760.67
700.00
760.70
800.00
400.00
300.00
Average loss (Kg)
19.87
21.30
0.00
16.1
100.00
22.21
200.00
Estimated loss
to quantity
procured (%)
In conclusion, in the assessment of postharvest losses for large cardamom, it was
found that no economic loss was involved at
farmers’ level and the estimated loss at
intermediaries’ level was found to be very
low at every level as large cardamom capsules
are sold only after drying. The estimated loss
was found to be highest at auction level
(0.00099 per cent) due to the fact that farmers
prefer to sell the produce only when they get
satisfactory prices.
In case of ginger, the highest estimated loss
was for semi- medium farmers (3.00 per
cent), followed by small and marginal farmers
(2.00 per cent) each, respectively. At
intermediaries’ level the highest estimated
loss was incurred by wholesalers (3.00 per
cent), followed by retailers (2.80 per cent) and
Processors (2.30 per cent), respectively.
References
Adhikari, P.P. 2016. Cardamom cultivation
technology, Agriculture Information and
Communication Center, Hariharbhawan
Lalitpur, Nepal.
Analogous. 2018. Statistical Hand of Sikkim
Published by Directorate of Economics and
Statistics (various issues), Gangtok, Sikkim.
Anonymous. 2017. Marketing strategies for
organic produce of Sikkim, A report
submitted to Sikkim Organic Mission,
Government of Sikkim, Gangtok, CGS
National
Institute
of
Agricultural
Marketing. Ministry of Agriculture and
Farmers Welfare, Kota road, Bambala,
Pratap Nagar, Jaipur, India.
Bhutia, P.H., Sharangi, A.B., Lepcha, R. and
Yonzone, R. 2017. Post-harvest and value
chain management of large cardamom in
hills and uplands. International Journal of
Chemical Studies. 6(1): 505-511.
Bisht, V.K., Negi, A.K. and Bhandari, A.K. 2011.
Ammomum
subulatum
cardamom:
Traditional Phytochemical and Biological
Activities – An overview. African Journal
of Agriculture Research, 8(24): 5388-5390.
Dhakre, D. S. and Sharma, Amod. 2010. SocioEconomic
Development
in
India.
Environment and Ecology. 4(1): 2469-2472.
1281
Int.J.Curr.Microbiol.App.Sci (2019) 8(5): 1274-1282
Egyir, I.S., Sarpong, D. B. and Obeng-Ofori, D.
(2008) Harvest and postharvest baseline
study. Policy Planning, Monitoring and
Evaluation Directorate, Ministry of Food
and Agriculture, Ghana. Pp: 154.
/>_Products. Assessed on 13 March 2019.
/>s/ifoamstandarddraftv1.1_forconsultation_cl
ean_new.doc. Assessed on 23 April 2019.
Pongener, Bendangjungla and Sharma, Amod.
2018. Constraints Faced by the Fishery
Enterprises: A SWOC Analysis. IJCMAS.
7(5). May: 1595-1603.
Rahman, H., Bujarbaruah, K.M., Srivastava, L.S.,
Karuppaiyan, R., Avasthe R.K. and Singh,
M. 2007. Status of ginger cultivation in
Sikkim with special reference to disease
management. ICAR Research Complex for
NEH Region Sikkim Centre, Tadong,
Gangtok.
Sharma, A. and Sharma, Anamika. 2008.
Problems faced by the farmers in adoption
of improved maize cultivation practices in
hills. TJRAR. 8(2): 22-23.
Sharma, Amod. 2011. Economic and Constraints
of King Chilli Growers in Dimapur District
of Nagaland. Journal of Interacademicia.
15(4): 710-719.
Sharma, Amod. 2012. Inter-state Disparities in
Socio-economic Development in North East
Region of India. Journal of Agricultural
Science. 4(9). September: 236-243.
Sharma, Amod., Kichu, Yimkumba. and
Chaturvedi, B. K. 2016. Economics and
Constraints of Pineapple Cultivation in
Dimapur District of Nagaland. TJRAR.
16(1). January: 72-75.
Sharma, Amod., Kichu, Yimkumba and Sharma,
Pradeep. Kumar. 2018. Sustainable
economic analysis and constraints faced by
the pineapple growers in Nagaland.
Progressive Agriculture. 18(1). February:
27-33.
Shuya, Keviu and Sharma, Amod. 2014. Impact
and constraints faced by the borrowers of
cooperative bank finance in Nagaland.
Economic Affairs. 59(4). October: 561-567.
Shuya, Keviu and Sharma, Amod. 2018. Problems
faced by the Borrowers in Utilization and
Acquiring of Cooperative Bank Loans in
Nagaland. IJED. 14(2). April-June, Pp. 5256.
Walling, Imti. and Sharma, Amod. 2015. Impact
of SGRY on beneficiaries and nonbeneficiaries in Dimapur district of
Nagaland. TJRAR. 15(2). August: 90-94.
Walling, Imti., Sharma, Amod., Yadav, Mukesh.
Kumar., Rajbhar, Arun, Kumar and Kalai,
Kankabati. 2017. Impact of Agricultural
Technology Management Agency on Rural
Economy of Nagaland, India. Plant
Archiver. 17(2). October: 1511-1516.
Willer, H. and Lernoud, J. 2018. The world of
organic agriculture. Statistics and emerging
trends 2018. Research Institute of Organic
Agriculture (FiBL), Frick, and IFOAM –
Organics International, Bonn.
How to cite this article:
Archana Sharma and Amod Sharma. 2019. Postharvest Losses during the Marketing of Large
Cardamon and Ginger Spices Crops in East District of Sikkim. Int.J.Curr.Microbiol.App.Sci.
8(05): 1274-1282. doi: />
1282