Assessment of soil loss from agricultural lands of south Andaman district in tropical islands
Bạn đang xem bản rút gọn của tài liệu. Xem và tải ngay bản đầy đủ của tài liệu tại đây (301.02 KB, 9 trang )
Int.J.Curr.Microbiol.App.Sci (2019) 8(3): 2190-2198
International Journal of Current Microbiology and Applied Sciences
ISSN: 2319-7706 Volume 8 Number 03 (2019)
Journal homepage:
Original Research Article
/>
Assessment of Soil Loss from Agricultural Lands of South Andaman
District in Tropical Islands
B.K. Nanda1*, N. Sahoo2 and B. Panigrahi2
1
2
ICAR-KVK, Port Blair, India
Department of Soil and Water Conservation Engineering, CAET, OUAT,
Bhubaneswar, India
*Corresponding author
ABSTRACT
Keywords
Crop land,
Erosivity, Land
degradation, Soil
loss, Tropical
islands
Article
\ Info
Accepted:
18 February 2019
Available Online:
10 March 2019
Soil loss was estimated from agricultural lands of South Andaman district in tropical Bay
Islands applying Universal Soil Loss Equation (USLE). Mean annual rate of soil loss to the
tune of 184.1 X 10³ tons was estimated from the crop fields of the district covering 1747.0
ha area at the rate of 105.38 t ha-1 yr-1. In South Andaman district, kharif crops (rice,
maize, arhar, ground nut, ginger, sweet potato, tapioca and turmeric) are grown in medium
to low lands whereas rabi crops (pulses and vegetables) are grown in uplands. The
cropping intensity is 104.0%. Maximum (136.8 thousand tons) and minimum (0.06
thousand tons) soil loss was obtained from the cultivation of vegetables (1317.0 ha) and
arhar (0.5 ha), respectively. The highest (124.8 t ha -1 yr-1) and the lowest (70.6 t ha-1 yr-1)
rate of soil loss were obtained from the cropping pattern of rice-fallow-fallow and gingerfallow, respectively. Among the double cropped land, the sequence of sweet potatovegetable-fallow contributes the lowest rate of soil loss (68.76 t ha-1 yr-1), whereas the
cropping sequence of rice-fallow-vegetable yielded the highest rate of soil loss (106.25 t
ha-1 yr-1). The average rate of soil loss from double cropped land is 86.02 t ha -1 yr-1. The
study reveals that converting more mono crop area into double cropped land will reduce
the average soil loss annually by 18.4%.
Introduction
In India, out of 328.0 M ha, 147.0 million ha
(44.8%) area is suffering from various forms
of land degradation (Bhattacharyya et al.,
2015). Panigrahi et al., (2009) stated that any
form of agriculture involves alteration of
ecological system and causes large scale land
degradation. Agriculture can result in soil
erosion when improper management is applied
on arable land (Oldeman, 1997). Pimentel et
al., (1995) reported that nearly one-third of the
world’s arable land has become unsuitable for
cultivation due to water erosion only. Major
portion (98.0%) of total soil loss from a
watershed is from the cultivated croplands. As
a result of which, the total annual loss of
productivity of major crops in India is 7.2
million tonnes (Brandon et al., 1995; Suresh et
al., 2002; Naik et al., 2015). The tune of soil
2190
Int.J.Curr.Microbiol.App.Sci (2019) 8(3): 2190-2198
loss from the cropped lands in islands is
generally higher in comparison to the
croplands in plain area due to undulating
topography characterized with hills, hillocks
and flat bottomed valleys (Pandey et al.,
2007).
The Andaman and Nicobar group of islands in
India were once upon a time thickly covered
with tropical rain forests and were settled in
mid-twentieth century. The settlers were
provided with 2.0 ha forest land on the
hillocks and 2.0 ha lands in the valleys. Those
settlers removed the forests, constructed
houses and planted trees round the houses that
met their maximum basic needs because
markets as well as roads were not available at
that time. This led to the development of home
garden in the islands. At present coconut and
areca nut plantations as well as home gardens
are second major land uses after forests
(Pandey et al.,2007). Some portion of the
cleared forest lands are in use for vegetable
cultivation by farmers. Generally, farmers
perform deep soil working in the vegetable
fields and remove weed for the vegetable
cultivation. They mainly follow vegetablevegetable and ground nut-vegetable rotations
in the vegetable fields. Before Tsunami that
devastated these islands in 2004, 12,000 ha
land in the valley was under bunded paddy
cultivation (Pandey et al., 2007). Tsunami has
already engrossed about 4000 ha low-lying
rice fields in the islands and several thousand
hectare lands (rice fields) are still being
inundated once in a day by high tides making
them unfit for rice cultivation. These islands
experience torrential and high rainfall during
wet season from South-West monsoon
(Pandey et al., 2007). Agricultural activities,
particularly vegetable cultivation exposes
surface soils to the rainfall which carry away a
huge amount of top fine soil particles to the
Andaman Sea in Bay of Bengal through lowlying streams and makes soil deficient in
nutrients (Pandey and Singh, 2009). Loss of
soils is found to increase many folds in hilly
area due to accelerated rate of runoff (Narain
et al., 1998). The land mass of the islands is
precious not only from the soil fertility point
of view, but also for the existence of the
islands as well. Land use wise information on
soil erosion estimated using run off plot, so
far, is not available for these islands because it
is
expensive
and
time
consuming
(Velmurugan et al., 2008). Velmurugan et al.,
(2008) carried out soil erosion study in
Dhanikhari watershed of the district using
revised Morgan and Morgan Finney model
with an aid of remote sensing and GIS. But no
ground truthing was carried out for a long
term (even not for one annual cycle) to
validate the results of the model due to
extreme backwardness and inaccessible area.
The rising population, limited cropping land
and more food requirement has resulted in the
extension of cultivated area on steep slopes in
these regions which are vulnerable to erosion.
Undulating terrain, high intensity monsoon
rainfall and run off and severe soil erosion are
the major problems of these islands. Keeping
these land degradation problems in view, an
attempt has been made under the present study
to quantify the soil loss from the agricultural
lands of South Andaman district applying the
Universal Soil Loss Equation (Wischmeier
and Smith, 1978). Soil loss from agricultural
lands may be quite helpful in planning suitable
conservation measures.
Materials and Methods
South Andaman district lies between latitudes
of 6° 45´N to 13° 4´ N and longitudes of 92°
15´ E to 94° E at an elevation of 13.0 m from
mean sea level. The total available land for
utilization in the district is 280.4 thousand ha
which is 90.3% of the total geographical area
of these groups of islands. Forest area, net
sown area, current fallow land, fallow land
other than current fallow land, other
2191
Int.J.Curr.Microbiol.App.Sci (2019) 8(3): 2190-2198
uncultivated land excluding fallow land and
land not available for cultivation constitutes
95.3%, 2.5%, 0.1%, 0.5%, 0.7% and 0.9% of
the total reporting area for land utilization
respectively (District Statistical Hand Book,
2011). Soils of South Andaman districts are
low in N, P and organic matter content and are
predominantly red, mixed red and yellow
having sandy loam to sandy clay loam texture.
The annual normal rainfall in the district is
3054.2 mm distributed over 131.1 rainy days.
The daily rainfall data since last 30 years
(1987-2017) indicates that these groups of
islands receive 72.5% of the total normal
rainfall due to South-West monsoon recorded
in 91 rainy days (ICAR-CIARI, 2017; ICARKVK, 2018). May to November is the usual
wet period, where 90.4% rainfall is recorded
in about 117.3 rainy days. Most of the
monsoon rain water is let off as high speed
free surface flows which has a scour potential
and inflicts tremendous loss of valuable top
soil converting the feasible fields into
unfeasible fallow fields. More fallow fields
and land degradation cause continuous
decrease in net sown area in the district.
These Islands fall under agro-climatic zone
XV and have a true maritime climate of warm
and humid with mean maximum and
minimum temperatures of 31°C and 21°C,
respectively. Relative humidity varies from
67% to 95% in monsoon and 56% to 84% in
off season. Bright sunshine hours vary from 0
to 11.3 hours in monsoon period and from 0 to
11.1 hours in post monsoon season. The mean
wind velocity varies from 2.7 km/hr to 28.2
km/hr in monsoon period and from 2 km/hr to
14.6 km/hr in post monsoon period. Detailed
information on land uses, soil type, major
crops/cropping pattern and rainfall in respect
of South Andaman district were collected
from secondary sources and published
literature (District Statistical Hand Book,
2011) and (ICAR-CIARI, 2017). Other
relevant
information
on
physical
characteristics of the crops were collected
from Annual Reports of ICAR-KVK, Port
Blair (ICAR- KVK, 2018).
For predicting soil erosion, Universal Soil
Loss Equation, popularly known as USLE
model (Wischmeier and Smith, 1978) is most
widely used throughout the world for
estimating annual soil loss from agricultural
lands (Ahmad and Verma, 2013; Naik et al.,
2014) and is given in Eq. (1) as:
Where, A is the average soil loss (tons ha-1 yr1
), R is the rainfall erosivity factor (metric
ton.m/ha.hr), K is the soil erodibility factor, L
is the slope length factor, S is the slope
gradient factor and P is supporting
conservation practice factor.
Rainfall erosivity factor (R) was estimated
using rainfall data from 1978 to 2016.
Erosivity factor values for each erosive storm
were computed for 30 minutes rainfall
intensity using the following empirical
equation (Raghunath and Erasmus, 1971) as
stated in Eq. (2).
Where,
R = Erosion index in metric ton.m/ha.hr
I30 = Maximum 30 minutes rainfall intensity,
cm/hr which is calculated from each storm
event using recording raingauge chart and
KE = Kinetic energy of the strom in metric
ton.m/ha.cm which was computed by Eq. (3)
as proposed by Wischmeir (1959) as:
Where, KE = Kinetic energy in metric
ton.m/ha.cm
I = Rainfall intensity in cm/hr.
2192
Int.J.Curr.Microbiol.App.Sci (2019) 8(3): 2190-2198
Since daily rainfall data of recording type
raingauge were available only for 3 years
(2014 to 2016), we used these data to compute
KE (Eq. 3) and these values of KE was used to
compute corresponding R values (Eq. 2). In
the earlier studies, relationship between
monthly R and rainfall (P) was established
through regression analysis (Erasmus et al.,
1970). In the present study, using the
computed values of R and rainfall, P of these 3
years a linear regression model (Coefficient of
determination, R2 = 0.87) was developed and
expressed as:
Using the above Eq. (4), we estimated the
value of R of each strom event of rest of the
years of study using the values of P of each
storm event. Considering the local traditional
cropping practice, R value for entire crop
growing season (kharif + rabi + summer) was
considered for calculation of soil loss. The
values of soil erodibility factor (K) and slope
gradient factor (LS) were determined as the
area weightage value of considering range of
values of K and LS for different land masses
respectively as given by Sahoo et al., (2013)
for the Andaman and Nicobar group of
islands. The area weighted values of K and LS
were found to be 0.26 and 4.79 respectively.
The value of crop management factor (C) of
various crops and fallow land were taken from
the published literature (Roose, 1976;
Panigrahi, 2007) and are given in the Table 1.
The value of supporting conservation practice
factor (P) was determined considering the crop
wise conservation practice followed in the
farmers’ field of these islands (Table 2).
Results and Discussion
Major field crops grown in the district are
vegetables, paddy, maize, ginger, sweet potato
and turmeric. Vegetables and paddy are grown
in an area of 1317.0 ha and 216.0 ha which
accounts for 75% and 12% of the total
cultivated area of 1747.8 ha respectively.
Other crops cultivated in the area are maize
(55.0 ha), ginger (51.5 ha), sweet potato (46.0
ha), tapioca (26.5 ha), turmeric (19.5 ha),
green gram and black gram (13.7 ha). Among
all the crops, paddy, maize, arhar, ginger,
sweet potato, turmeric, tapioca and ground nut
are grown in kharif season whereas, mustard,
green gram, black gram and vegetables are
grown in rabi season and only vegetables are
grown in summer season.
Table.1 Values of crop management factor ‘C’
Sl. No.
1
2
3
4
5
6
7
8
9
10
11
12
13
Crop
Rice
Maize
Green gram
Black gram
Arhar
Ground nut
Mustard
Ginger
Turmeric
Sweet potato
Tapioca
Vegetable
Fallow field
2193
Value of ‘C’ factor
0.28
0.45
0.41
0.49
0.38
0.36
0.30
0.30
0.35
0.33
0.50
0.33
1.00
Int.J.Curr.Microbiol.App.Sci (2019) 8(3): 2190-2198
Table.2 Values of Conservation practice factor ‘P’
Sl. No.
1
2
3
Conservation practice
P-factor values
Contour bunding
0.20
Field bunding
0.30
Cultivated fallow
1.00
Source: Kurothe, 1991
Table.3 Month wise average rainfall and erosivity factor ‘R’ for the period 1978-2016
Month
January
February
March
April
May
June
July
August
September
October
November
December
Total
Rainfall (mm)
44.67
20.68
46.61
75.90
436.51
457.02
457.14
411.78
505.89
291.59
226.97
144.04
3,118.80
R (metric ton.m/ha. hr)
3.33
1.48
7.99
9.98
111.30
117.61
117.90
103.68
132.67
66.66
47.21
28.33
748.14
Table.4 Year wise rainfall and erosivity factor ‘R’ for the period 1978-2016
Year
Rainfall
(mm)
1978
1979
1980
1981
1982
1983
1984
1985
1986
1987
1988
1989
1990
2698.1
1574.1
3760.3
3402.7
2410.8
2903.0
3498.9
2690.5
2024.3
2657.6
3285.5
2613.3
2681.0
R (metric
ton.m/
ha.hr)
620.1
304.6
970.5
837.0
557.0
706.3
796.3
640.9
450.7
628.0
801.4
608.0
615.3
Year
Rainfall
(mm)
1991
1992
1993
1994
1995
1996
1997
1998
1999
2000
2001
2002
2003
3100.7
2747.9
2468.8
3465.3
3444.8
3356.4
2701.5
2756.8
2966.4
3158.2
3127.2
2512.3
2428.1
2194
R (metric
ton.m/
ha.hr)
749.2
659.5
589.9
861.5
890.1
800.6
643.7
672.1
661.2
705.2
723.3
565.5
536.1
Year Rainfall R (metric
(mm)
ton.m/
ha.hr)
2004 2410.4
528.9
2005 3759.2
955.7
2006 3002.2
726.1
2007 2525.6
600.3
2008 4130.4
1047.2
2009 2551.4
572.8
2010 3110.2
747.3
2011 3827.6
909.1
2012 4006.9
992.6
2013 3406.6
846.8
2014 2915.9
716.4
2015 2808.4
631.1
2016 3541.4
872.4
Int.J.Curr.Microbiol.App.Sci (2019) 8(3): 2190-2198
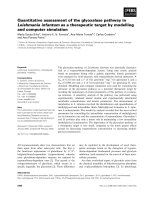
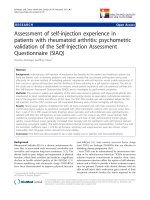
Fig.1 Rate of soil loss from mono crop lands
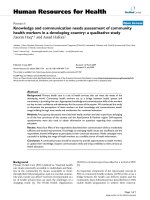
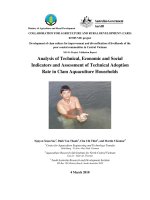
Fig.2 Rate of soil loss from double crop lands
Calculation of erosivity factor ‘R’
The monthly values of P and R of all the
years (1978-2016) were used to estimate the
average values of P and R and are shown in
Table 3. The monthly values of P and R of
each year were added to get the yearly values
of P and R. The values of so computed values
of P and R of all the years are shown in Table
4.
2195
Int.J.Curr.Microbiol.App.Sci (2019) 8(3): 2190-2198
The values of erosivity factor varied from
1.48 metric ton.m/ha.hr (in February) to
132.67 metric ton.m/ha.hr (in September).
This is due to the occurrence of more nos. of
erosive storms in the month of September as
compared to other months. The total annual
R-factor was found to be 748.14 metric
ton.m/ha.hr with the highest and the lowest R
values of 1047.2 metric ton.m/ha.hr and 304.6
metric ton.m/ha.hr in the year 2008 and 1979
respectively due to the rainfall variation
(highest rainfall of 4130.4 mm in 2008 and
the lowest rainfall of 1574.1 mm in 1979).
Higher rainfall amount was observed during
the months from May to October as compared
to other months. The months from May to
September showed R values of more than 100
metric ton.m/ha.hr (ranging from 103.68 to
132.67 metric ton.m/ha.hr) with an average of
116.6 metric ton.m/ha.hr per month.
Crop wise annual soil loss was also
calculated. The annual soil loss of 184098.12
tons was recorded at the rate of 105.38 t ha-1
yr-1 from the agricultural fields of the South
Andaman district. Among the mono crops,
paddy contributes highest rate of soil loss
(124 t ha-1 yr-1) and ginger yields lowest rate
of soil loss (70.6 t ha-1 yr-1) (Fig. 1). Paddy
crop contributed more soil loss due to longer
fallow period and cultivation of crop on
terraces. Waterlogging occurs rarely in these
islands due to quick drainage of excess
rainfall to the sea. Most of the cases standing
crop during kharif suffers when there is a dry
spell of more than a week. The areas with
assured irrigation are double cropped and are
very less in areal extent as cropping intensity
of the district is 104.0% (Nanda et al, 2018).
Among the double cropped lands (Fig. 2), the
sequence of sweet potato-vegetable-fallow
contributes lowest rate of soil loss (68.76 t ha1
yr-1), where as the cropping sequence of
rice-fallow-vegetable yield highest rate of soil
loss (106.25 t ha-1 yr-1). The average rate of
soil loss from double cropped land was 86.02
t ha-1 yr-1. Since the average annual rate of
soil loss in mono crop land was estimated as
105.38 t ha-1 yr-1 and that of double cropped
land was estimated as 86.02 t ha-1 yr-1, it is
assessed that there would be a reduction of
18.4% soil loss if the mono crop land is
changed to double cropped land.
The rate of soil loss from the cropped land
showed extremely severe soil erosion as it
exceeds considerably the soil loss tolerance
limit of 11.2 t ha-1 yr-1 (Mannering, 1981).
Soil loss tolerance is a limit which denotes the
maximum level of soil erosion that will
permit crop productivity to be sustained
economically. Mannering, 1981 reported that
the tolerance limits are ranging from 4.5 to
11.2 t ha-1 yr-1 and soil loss in excess of 11.2 t
ha-1 yr-1 affected the effectiveness of water
conservation structures. At this stage, the
gully formation starts which in turn obstructs
the intercultural operation (Singh et al, 1981).
It is a matter of serious concern that due to
huge loss of surface soil on account of soil
erosion, associated with macro, major and
micronutrients are also lost recurrently each
year leading to nutrient depletion and poor
soil fertility. Therefore, good conservation
planning in the union territory of Andamans is
of utmost importance towards optimizing
agricultural production.
References
Ahmad, I and Verma, M. K. 2013.
Application of USLE Model & GIS in
Estimation of Soi Erosion for Tandula
Reservoir. International Journal of
Emerging Technology and Advanced
Engineering, 3(4): 570-576.
Bhattacharyya, R., Ghosh, B. N., Mishra, P.
K., Mandal, B., Rao, C. S., Sarkar, D.,
Das, K., Anil, K. S., Lalitha, M., Hati,
K., M. and Franzluebbers, A. J. 2015.
Soil degradation in India: Challenges
2196
Int.J.Curr.Microbiol.App.Sci (2019) 8(3): 2190-2198
and Potential Solutions. Sustainability,
7: 3528-3570.
Brandon, C., Hommann, K. and Kishore, N.
M. 1995. The cost of inaction: Valuing
the
economy
wide
cost
of
environmental degradation in India. In
Proceedings of the UNU Conference on
the sustainable future of the global
system, Tokyo, 16-18 Oct, 1995.
District Statistical Hand Book. 2011.
Directorate of Economics and Statistics,
Andaman and Nicobar Administration,
Port Blair, 64p
Erasmus, I. E., Lal, M., Raghunath, B. and
Mathur, P. S. 1970. Evaluation of
erosion potential for daily rainfall data.
Indian Forester, 96 (II), 817-825.
/>Soil Conservation in Andaman and
Nicobar Islands.
ICAR-CIARI, 2017. Annual Report 2016-17.
ICAR-Central
Island
Agricultural
Research Institute, Post Box No. 181,
Port Blair, Andaman and Nicobar
Group of Islands, India. 265p
ICAR-KVK, 2018. Annual Report 2017-18.
ICAR-Krishi Vigyan Kendra, Port
Blair, Andaman and Nicobar Group of
Islands, India. 118p
Kurothe, R. S. 1991. Soil erosion map of
Gujarat. Indian Journal of Soil
Conservation, 25(1):9-13
Mannering, J. V. 1981. The use of soil
tolerances as strategy for soil
conservation.
Soil
Conservation
problem and prospect. R. P. C. Morgan
Jhon willey & Sons, Chichester
England, pp. 337-349.
Naik, B. S., Paul, J. C., Panigrahi, B. and
Sahoo, B. C. 2015. Soil erosion
assessment from farming lands of
Koraput district in Eastern Ghat region
of Odisha. Indian Journal of Soil
Conservation, 43 (1): 33-37.
Naik, B. S., Paul, J. C., Panigrahi, B. and
Sahoo, B. C. 2014. Soil loss from
agricultural lands in eastern ghat of
Odisha - A case study of Koraput
district. Journal of Soil and Water
Conservation, 13 (4): 324-329.
Nanda, B. K., Sahoo, N. and Panigrahi, B.
2018.
Agroclimatic
conditions,
cropping pattern and its profitability in
South Andaman district of Bay Islands.
Journal of Krishi Vigyan, 7(1): 4-9.
Narain, P., Singh, R. K., Sindhwal, N. S. and
Joshi, P. 1998. Agroforestry for soil and
water conservation in the Western
Himalaya valley region of India:
Runoff, soil and nutrient losses.
Agroforestry Systems, 39: 175-189.
Oldeman, L. R. and Van Lynden, G. W. J.
1997. The Assessment of the Status of
Human- Induced Soil Degradation in
South and Southeast Asia. International
Soil Reference and Information Centre
Wageningen,
February
1997.
ic.
org/ISRIC/webdocs/docs/assodendrepor
t.pdf.
Pandey, C. B., Rai, R. B., Singh, L. and
Singh, A. K. 2007. Homegardens of
Andaman
and
Nicobar,
India.
Agricultural Systems, 92:1-22.
Pandey, C. B. and Singh, L. 2009. Soil
fertility under homegarden trees and
native moist evergreen forest in South
Andaman, India. Journal of Sustainable
Agriculture, 33(30): 303-318.
Panigrahi, D. 2007. Water and land use
optimization in hill plateaus of Orissa.
Unpublished Ph. D. Thesis, Utkal
University, Bhubaneswar.
Panigrahi, D., Acharya, M. and Senapati, P.
C. 2009. Estimation of Soil Loss from
Croplands of Kandhamal Plateau in
Orissa. Indian Journal of Dryland
Agriculture Research & Development,
24(1): 52-56.
Pimentel, D., Harvey, C., Resosudarmo, K.,
Sinclair, K., Kurz, D., McNair, M.,
Crist, S., Shpritz, L., Fitton, L.,
2197
Int.J.Curr.Microbiol.App.Sci (2019) 8(3): 2190-2198
Saffouri, R. and Blair, R. 1995.
Environmental and Economic Costs of
Soil Erosion and Conservation Benefits.
Science, 267:1117–1123.
Raghunath, B. and Erasmus, I. E. 1971. A
method for estimating erosion potential
from daily rainfall data. Indian Forester.
97(3): 121-125.
Roose, E. J. 1976. Use of the universal soil
loss equation to predict erosion in West
Africa. In: Soil Erosion: Prediction and
Control, Soil Conservation Society of
America, Ankeny, Iowa, 60-74.
Sahoo, A. K., Das, K., Das, A. L., Obi Reddy,
G. P., Singh, S. K., Sarkar, D. and
Mishra, P. K. 2013. Soil Erosion of
Andaman & Nicobar Islands. NBSS
Publ. No. 165, NBSS&LUP (ICAR),
Nagpur, 30p
Singh, G., Ram Babu and Chandra, S. 1981.
Soil loss prediction research in India.
Bull. No. T-12/D-9, CSWCRTI,
Dehradun.
Suresh, R., Das, G. and Singh, J. K. 2002.
Estimation of soil loss generating
potential of various land use activities in
Naurar watershed of Ramganga
catchment, UP (India). Journal of Indian
Water Resource Society, 22(3):107-116.
Velmurugan, A., Swarnam, T. P., Kumar, P.
and Ravishankar, N. 2008. Soil erosion
assessment using revised Morgan,
Morgan Finney model for prioritization
of Dhanikhari watershed in South
Andaman. Indian Journal of Soil
Conservation, 36(3):173-179.
Wischmeir, W. H. 1959. A rainfall erosion
index for Universal Soil Loss Equation.
Soil Science Society of America
Proceedings. 23: May-June. 246-249.
Wischmeier, W. H. and Smith, D. D. 1978.
Predicting rainfall-erosion losses: a
guide to conservation planning. In: U.S.
Dept. of Agriculture, Agriculture
Handbook book # 537.
How to cite this article:
Nanda, B.K., N. Sahoo and Panigrahi, B. 2019. Assessment of Soil Loss from Agricultural
Lands of South Andaman District in Tropical Islands. Int.J.Curr.Microbiol.App.Sci. 8(03):
2190-2198. doi: />
2198