Effect of moisture content on physical properties of soybean
Bạn đang xem bản rút gọn của tài liệu. Xem và tải ngay bản đầy đủ của tài liệu tại đây (573.89 KB, 13 trang )
Int.J.Curr.Microbiol.App.Sci (2019) 8(4): 1770-1782
International Journal of Current Microbiology and Applied Sciences
ISSN: 2319-7706 Volume 8 Number 04 (2019)
Journal homepage:
Original Research Article
/>
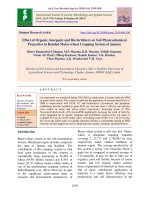
Effect of Moisture Content on Physical Properties of Soybean
Avinash Kakade*, Smita Khodke, Suhas Jadhav, Madhuri Gajabe and Nilza Othzes
Department of Agricultural Process Engineering, College of Agricultural Engineering and
Technology, V.N.M.K.V., Parbhani – 431401, India
*Corresponding author
ABSTRACT
Keywords
Moisture content,
Physical properties,
Soybean, India
Article Info
Accepted:
15 March 2019
Available Online:
10 April 2019
Soybean (Glycine max (L)) is one of the oldest principal food crops and has paramount
importance in Indian agricultural and oil industry. Soybean is recognized for its value in
enhancing and protecting health. Soybean has a tremendous potential to be transformed
into a number of traditional local foods. Different products can be prepared from soybean
such as soymilk and soy-paneer (dairy analogs), soy flour, soy bakery products, soynuts
etc.The physical properties of soybean are important to design the equipments and
machines for sorting, separation, transportation, processing and storage. Designing of such
equipments and machines without taking these into considerations may yield poor results.
For this reason the determination and considerations of these properties become an
important role. The major moisture-dependent physical properties of biological materials
are shape, size, mass, bulk -density, true-density, porosity and static coefficient of friction
against various surfaces. The study was conducted to investigate some physical properties
of soybean at various moisture levels. The dependence of physical properties of soybean
on moisture content was determined. In the moisture range from 9.98- 27.10% (wb).The
soaked soybean size increased linearly in length (6.34 - 8.95 mm), width (5.42 -6.50 mm),
and thickness (4.23 - 5.35 mm) according to final moisture content. In this study, length,
width and thickness models based on moisture content are defined as linear models and the
regression coefficients (R2) related to these models are found between 0.84, 0.72 and 0.70
respectively. Arithmetic Mean Diameter (5.330 - 6.933 mm), Geometric Mean Diameter
(5.258 - 6.777mm), Square Mean Diameter (9.171- 11.876 mm), Equivalent Diameter
(6.586 - 8.526 mm) are computed from the average values of three principal dimensions.
In the current study, it was determined that unit volume (78.352-173.084 mm3), surface
area (89.411-153.243 mm2), 1000 grain weight (120.2-132.432g) and angle of repose
(25.25o-30.08o) increases as the moisture content of soaked soybean increases. As the
moisture content of the soaked soybean increases, the value of sphericity, aspect ratio, bulk
density, true density and porosity decreased.
Introduction
Soybean is one of the oldest food sources
known to the human beings. Though soybean
is a legume crop, yet it is widely used as
oilseed. It is now the second largest oilseed in
India after groundnut. On an average, it
1770
Int.J.Curr.Microbiol.App.Sci (2019) 8(4): 1770-1782
contains
about
40%
protein,
23%
carbohydrates, 20% oil, 5% mineral, 4% fibre
and 8% moisture. Soybean is recognized for
its value in enhancing and protecting health.
Soy protein has all the eight essential amino
acids. The recent discovery of the value of
soy-isoflavones and their role in disease
prevention has created the special interest of
human beings in soybean. Lipid and protein
are two major components of soybean.
Human easily digest soy protein products. It
has boundless food potential. However,
soybean also contains some anti-nutritional
factors like trypsin inhibitor, urease,
flatulence factors, etc. hence soybean requires
careful processing before utilization (Kulkarni
et al., 2009). Soybean plays a major role in
the world food trade. As per survey conducted
by SOPA, in the whole world estimated
production for soybean 2017-18 was
348.467million MT (MMT) as compared to
351.315 MMT of soybean 2016-17, which
means a decrease in 2.848 percent over
previous year. India ranks 5th in area and
production of soybean after US, Brazil,
Argentina and China. The contribution of
India in world soybean area and production is
about 10.4 % and 4.4% respectively. SOPA
along with other associate agencies conducted
extensive crop survey in three major soybean
producing States of Madhya Pradesh,
Maharashtra and Rajasthan. In Madhya
Pradesh the Area under soybean cultivation
during 2016-17 was 54.01lac ha as compared
to 34.12 lac ha during 2015-16 showing an
increase of 19.89 %. In Maharashtra the area
under soybean cultivation during 2016-17 is
35.80 lac ha as compared to 22.00 lac hectare
during 2015-16 showing an increase of 13.80
%. The yield was 1059 Kg per ha, resulting
into a production of 57.17 Lac MT during
2016-17 in states of Madhya Pradesh, while
in Maharashtra the yield was 1102 Kg per ha,
resulting into a production of 39.455 Lac MT
during 2016-17. The state like Madhya
Pradesh, Maharashtra and Rajasthan together
contributes about 97% total area and 96%
production of soybean in the country (The
Soybean Processors Association of India
SOPA: 2017-18, Oilseeds - World Markets
and
Trade,
a
USDA
Publication)
(Anonymous, 2018a).
The physical properties of soybean are
important to design the equipments and
machines
for
sorting,
separation,
transportation, processing and storage.
Designing of such equipments and machines
without taking these into considerations may
yield poor results. For this reason the
determination and considerations of these
properties become an important role. The
major moisture-dependent physical properties
of biological materials are shape, size, mass,
bulk density, true density, porosity and static
coefficient of friction against various surfaces
(Mohsenin, 1980). In recent years, many
researchers have investigated these properties
for various agricultural crops such as lentil
grains (Carman, 1996), locust bean seed
(Olajide and Ade-Omowage, 1999; Ogunjimi
et al., 2002), pumpkin seeds (Joshi et al.,
1993), sunflower seeds (Gupta and Das,
1997), legume seeds (Altuntaş and Demirtola,
2007) and Faba bean (Altuntaş and Yıldız,
2007).
In addition, engineering and aerodynamic
properties of soybean have been determined
by Polat et al., (2006) and Isik (2007). But
there is limited information on properties of
soybean which is inadequate to design
equipment and machines in scientific
literatures for soybean to be cultivated in
India. In considering this, the study was
undertaken to investigate some physical
properties of soybean at different moisture
content level. The properties studied includes
size distribution, AMD, GMD, SMD, EQD,
sphericity, bulk density, true density, aspect
ratio, thousand grain mass, angle of repose
and porosity.
1771
Int.J.Curr.Microbiol.App.Sci (2019) 8(4): 1770-1782
Materials and Methods
Soybean (JS-335) was procured from the
Seed Processing Unit of Vasantrao Naik
Marathwada Krishi Vidyapeeth, Parbhani,
Maharashtra State (India). The soybean grains
were manually cleaned to remove foreign
matter, dust, dirt, broken and immature
grains.
Measurement of physical properties of
soybean
The physical properties of soybean were
important to design the equipment’s and
machines
for
sorting,
separation,
transportation, processing and storage.
Physical properties such as length, width and
thickness of soaked soybean grain was
considered for designing puffing cum popping
machine. Bulk density of soaked soybean was
determined at various moisture content level
was considered while designing the feed
hopper.
Thousand grain weight
1 kg of soybean grains were roughly divided
into 10 equal portions and then 1000 numbers
of soybean grains were randomly picked from
each portion and weighed using a digital
electronic balance having an accuracy of
0.001g. Three replications were carried out to
determine the mean value of weight of
soybean grain (Khedekar, 2013).
Moisture content
Moisture content of the soaked soybean was
determined at frequent interval of 15 minute.
10 gram of soybean was immersed in water in
(1:3) ratio in a 250 ml of beaker. Such 25
beakers were prepared and 10 gram of soaked
soybean was taken out of the each 250 ml
beaker at 15 minute time intervals. Surface
water was removed from the grain with the
help of tissue paper. Further moisture content
of soaked soybean was determined in three
replicates using the air oven method
according to the ASAE Standard S352.2
(ASAE, 1997) for soybean.
Moisture content (%) =
Initial weight (g) – Final weight (g)
---------------------------------------------- X 100
Initial weight (g)
Determination of length (L), width (W) and
thickness (T) of soaked soybean
Length, width and thickness of soaked
soybean was determined at 15 minute interval
of time when soaked in water at 1:3 ratio. In
order to determine dimensions, one hundred
soaked soybean grains were randomly
selected after every 15 minute time interval.
For each soybean grain, the three principle
dimensions, namely length, width and
thickness were measured using a vernier
caliper (Model: CD-15CPX, Mitutoyo Corp
Made in Japan) having the least count of
0.001 mm. The length (L) was defined as the
distance from the tip cap to kernel crown.
Width (W) was defined as the widest point to
point measurement taken parallel to the face
of the kernel. Thickness (T) was defined as
the measured distance between the two
kernels faces as described by Pordesimo et
al., (1990).
The values of arithmetic mean diameter
(AMD), geometric mean diameter (GMD),
square mean diameter (SMD), equivalent
diameter (EQD), degree of sphericity (Sp),
aspect ratio (AR), shape factor (λ) and unit
volume of soaked soybean grains were
computed by using the following equations
(Mohsenin,1980; Deshmukh, 2016).
1772
Int.J.Curr.Microbiol.App.Sci (2019) 8(4): 1770-1782
Bulk density, true density and porosity of
soaked soybean
Where,
W
T
AMD
GMD
SMD
EQD
Sp
AR
L: length (mm)
: width (mm)
:
thickness (mm)
:
arithmetic mean diameter
:
geometric mean diameter
:
square mean diameter
:
equivalent diameter
:
degree of sphericity
:
aspect ratio
Major dimension was used to calculate the
surface area (S) of single grain (Jain, 1997) as
details below.
The unit volume of single grain (Jain, 1997)
was calculated as
The bulk density of soaked soybean was
determined at 15 minute interval of time when
soaked in water at 1:3 ratio of the mass of
soaked soybeans to its total volume. It was
determined by filling a 1000 mL container
with soaked soybean grains from a height of
about 150 mm, striking the top level and then
weighing the content (Deshpande et al., 1993;
Gupta and Das, 1997; Konak Carman and
Aydin, 2002). True density of the soaked
soybean was determined by the toluene
displacement method. Soaked soybean grains
(about 5 g) was submerged in toluene in a
measuring cylinder having an accuracy of 0.1
mL, the increase in volume due to soaked
soybean was noted as true volume of soaked
soybean which was then used to determine the
true density of the soaked soybean (Wandkar,
2013).
Porosity (έ) was the ratio of volume of
internal pores in the particle to its bulk
volume. It was calculated as the ratio of the
difference in the true density and bulk density
to the true density and expressed by Mohsenin
(1986):
Where,
Vt: unit volume
L: length (mm)
GMD : geometric mean diameter
ρt - ρb
έ = -----------ρt
Shape factor ( ) based on unit volume and
surface area of grain was determined (Mc.
Cabe and Smith, 1984) as
Where,
ρt was the true density and ρb was the bulk
density.
Angle of repose
Where,
Vt: unit volume W: width S: surface area
(mm2)
The angle of repose is the characteristics of
the bulk material which indicates the cohesion
among the individual grains. The higher the
cohesion, the higher the angle of repose. The
angle of repose of soaked soybean was
determined by using an open-ended cylinder
1773
Int.J.Curr.Microbiol.App.Sci (2019) 8(4): 1770-1782
of 15 cm diameter and 30 cm height. The
cylinder was placed at the centre of circular
plate having a diameter of 70 cm and was
filled with soaked soybean grains. The
cylinder was raised slowly until it formed a
cone on the circular plate. The height of the
cone was recorded. The angle of repose, θ
was calculated by using the following formula
(Wandkar, 2013).
θ = tan-1 (2h/d)
Where,
θ was the angle of repose, h was the height of
pile and d was the diameter of cone.
Results and Discussion
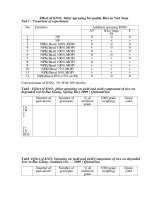
From Figure 1 it is clear that average values
of the three principle dimension of raw
soybean, namely length, width, thickness
determined in this study at different moisture
contents are presented in Table 1. Each
principle dimension appeared to be linearly
dependent on the moisture content as shown
in Figure 1. Very high correlation was
observed between the three principal
dimension and length, width and thickness
within the moisture range 9.98- 27.10% (wb).
The average length width and thickness of
100 grain varied from 6.34-8.95 mm, 5.426.50 and 4.23-5.35mm respectively, as the
moisture content increased from 9.98-27.10%
(wb). Difference between values is
statistically significant at 5% level of
significance. This result indicated that the
soaked soybean expanded in length, width,
thickness and geometrical properties within
the moisture range. The axial dimensions
increased with increase in moisture content
due to absorption of moisture, which resulted
in swelling of capillaries, stretching of
longitudinal ridges on the soaked soybean and
finally expansion in medium and minor axes.
Similar trends were showed for proso millet
(Singh, 2018); (Deshmukh, 2016) and
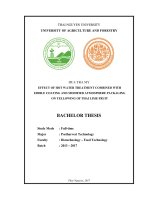
(Jadhav, 2018) for soaked soybean. Figure 2
shows the effect of moisture content on
average values of the three principle
dimension of soaked soybean in terms of
AMD, GMD, SMD and EQD.
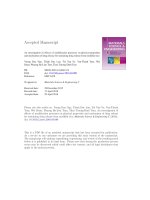
The relationship between moisture content on
sphericity and aspect ratio of soaked soybean
is shown in Figure 3. The sphericity and
aspect ratio of the soaked soybean decreased
linearly depending on the increase of moisture
content. Linearly negative change of
sphericity and aspect ratio depending on the
increase of moisture content can also be
observed in some grainy products such as
groundnut, peanut (Brayeh, 2001; Brayeh,
2002; Kibar, 2008) for soybean.
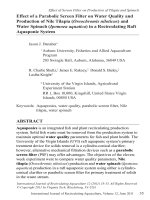
Surface area and volumetric change
depending on moisture content of soaked
soybean is shown in Figure 4. The surface
area and volume of soaked soybean increased
linearly with the increase of moisture content.
The surface area and volume of soaked
soybean increased from 89.411-153.243mm2
and 78.352-173.084mm3 respectively when
moisture content changed from 9.98-27.10%
(wb). From Table 2 it is clear that the positive
relationship between surface area and
volumetric change with respect to moisture
content of soaked soybean was also found by
(Khedekar, 2013; Deshmukh, 2016).
It can be seen from Figure 5 that the
thousand-grain mass increased from 120.2 gm
to 132.432 gm with increase in moisture
content in the specified moisture range.
Similar trends were showed for proso millet
(Singh, 2018); (Deshpande, 1993) and
(Deshmukh, 2016) for soybean.
A plot of experimentally obtained values of
bulk and true densities against moisture
content (Fig. 6) indicated a decrease in bulk
and true densities with an increase in moisture
content in the specified moisture range.
1774
Int.J.Curr.Microbiol.App.Sci (2019) 8(4): 1770-1782
Table.1 Physical properties of soybean at various levels of moisture content
Sr.No
Vt (mm3)
ƛ
1000
grain
wt. (g)
BD
(Kg/m3)
TD
(Kg/m3)
PO%
AOR
89.411
97.745
103.412
107.107
117.550
123.281
124.214
78.352
90.043
98.203
103.582
118.237
126.458
127.911
5.587
6.535
6.467
6.392
6.186
6.105
6.161
120.2
121.668
122.136
122.604
123.072
123.54
124.008
740.00
660.40
657.68
654.96
652.24
649.52
646.80
1192.00
1140.10
1131.62
1123.13
1114.65
1106.16
1097.68
37.919
42.075
41.881
41.685
41.485
41.282
41.076
25.25
27.30
27.42
27.54
27.66
27.78
27.91
0.764
0.761
132.966
134.380
140.708
142.893
6.074
6.083
124.476
124.944
644.08
641.36
1089.20
1080.71
40.866
40.654
28.03
28.15
0.778
0.779
0.777
0.769
0.765
0.763
0.760
0.762
0.758
0.746
0.740
0.736
135.207
135.738
137.048
139.999
141.759
143.097
144.197
145.071
147.095
151.580
154.292
156.395
6.105
6.131
6.124
6.110
6.116
6.110
125.412
125.88
126.348
126.816
127.284
127.752
638.64
635.92
633.20
630.48
627.76
625.04
1072.23
1063.74
1055.26
1046.78
1038.29
1029.81
40.438
40.219
39.996
39.769
39.539
39.305
28.27
28.39
28.51
28.63
28.75
28.87
8.264
8.325
0.763
0.758
0.738
0.730
143.643
146.041
157.319
161.060
6.136
6.132
128.22
128.688
622.32
619.60
1021.32
1012.84
39.067
38.825
28.99
29.12
11.623
11.672
8.350
8.386
0.759
0.756
0.730
0.726
146.899
148.260
162.507
164.681
6.152
6.146
129.156
129.624
616.88
614.16
1004.36
995.87
38.580
38.329
29.24
29.36
6.683
11.706
8.410
0.756
0.726
149.129
166.113
6.167
130.092
611.44
987.39
38.075
29.48
6.860
6.883
6.900
6.702
6.724
6.741
11.739
11.778
11.808
8.434
8.462
8.483
0.756
0.755
0.756
0.726
0.724
0.726
150.001
151.061
151.748
167.552
169.290
170.494
6.188
6.187
6.229
130.56
131.028
131.496
608.72
606.00
603.28
978.90
970.42
961.94
37.816
37.553
37.285
29.60
29.72
29.84
5.32
6.913
6.756
11.832
8.500
0.757
0.727
152.339
171.525
6.235
131.964
600.56
953.45
37.012
29.96
5.35
6.933
6.777
11.867
8.526
0.757
0.726
153.243
173.084
6.234
132.432
597.84
944.97
36.734
30.08
6.259
5.0768
6.487
6.363
11.12
7.992
0.787
0.777
134.21
143.54
6.163
126.77
633.555
1048.51
39.498
28.55
0.2240
0.2724
0.4452
0.4106
0.7380
0.5312
0.0412
0.0702
18.3040
27.1910
0.1664
3.5174
29.0909
65.8981
1.6379
1.084
0.1753
0.0448
0.0545
0.0890
0.0821
0.1476
0.1062
0.0082
0.0140
3.6608
5.4382
0.0333
0.7035
5.8182
13.1796
0.3276
0.216
0.3636
0.0929
0.1130
0.1847
0.1703
0.3061
0.2203
0.0171
0.0291
7.5925
11.2788
0.0690
1.4590
12.0669
27.3345
0.6794
0.449
10.788
3.579
5.366
6.862
6.452
6.633
6.646
5.227
9.031
13.638
18.942
2.699
2.774
4.592
6.285
4.147
3.797
Soaking
Time
(min)
Moisture
Content
(Wb%)
Lengt
h
(mm)
Width
(mm)
Thicknes
s (mm)
AMD
(mm)
GMD
(mm)
SMD
(mm)
EQD
(mm)
SP
Ar
1
2
3
4
5
6
7
0
15
30
45
60
75
90
9.98
11.73
14.28
18.64
21.82
22.49
23.21
6.34
6.40
6.47
6.55
7.22
7.58
7.60
5.42
6.01
6.07
6.09
6.11
6.13
6.17
4.23
4.39
4.71
4.90
4.98
5.02
5.03
5.330
5.600
5.750
5.846
6.105
6.242
6.267
5.258
5.527
5.698
5.803
6.035
6.155
6.179
9.171
9.641
9.916
10.089
10.514
10.735
10.778
6.586
6.923
7.121
7.246
7.551
7.711
7.741
0.829
0.864
0.881
0.886
0.835
0.812
0.813
0.855
0.939
0.938
0.930
0.846
0.809
0.812
8
9
105
120
23.50
23.91
8.13
8.19
6.21
6.23
5.07
5.09
6.470
6.503
6.349
6.380
11.099
11.154
7.973
8.013
0.781
0.779
10
11
12
13
14
15
135
150
165
180
195
210
24.42
25.38
25.48
25.60
25.79
25.94
8.22
8.23
8.29
8.45
8.54
8.60
6.25
6.27
6.28
6.30
6.32
6.33
5.10
5.11
5.13
5.15
5.16
5.18
6.523
6.537
6.567
6.633
6.673
6.703
6.399
6.413
6.440
6.496
6.530
6.558
11.188
11.211
11.261
11.367
11.430
11.479
8.037
8.054
8.089
8.165
8.211
8.247
16
17
225
240
26.25
26.34
8.61
8.73
6.35
6.37
5.19
5.21
6.717
6.770
6.571
6.617
11.503
11.588
18
19
255
270
26.50
26.52
8.75
8.81
6.39
6.40
5.23
5.25
6.790
6.820
6.637
6.665
20
285
26.68
8.84
6.42
5.26
6.840
21
22
23
300
315
330
27.10
27.10
27.10
8.87
8.91
8.92
6.44
6.45
6.48
5.27
5.29
5.30
24
345
27.10
8.93
6.49
25
360
27.10
8.95
6.50
Avg
180.0
23.5991
8.1251
SD
110.3970
4.8573
0.8765
SE
22.0794
0.9715
CD
5%
CV%
45.7927
2.0148
61.332
20.583
S (mm2)
1775
Int.J.Curr.Microbiol.App.Sci (2019) 8(4): 1770-1782
Table.2 Regression equations for physical properties of soaked soybean
Properties
Length (mm)
Width (mm)
Thickness (mm)
Arithmetic Mean Diameter (mm)
Geometric Mean Diameter (mm)
Square Mean Diameter (mm)
Equivalent Diameter (mm)
Degree of sphericity (Sp)
Aspect ratio (AR)
Surface area (S) mm2
Unit volume of single grain (Vt) mm3
Shape factor (ƛ)
1000 grain weight (g)
Bulk density (Kg/m3)
True density (Kg/m3)
Porosity %
Angle of repose (o)
Range
6.34 - 8.95
5.42 - 6.50
4.23 - 5.35
5.330 - 6.933
5.258 - 6.777
9.171 - 11.867
6.586 - 8.526
0.829 - 0.757
0.855 - 0.726
89.411 - 153.243
78.352 - 173.084
5.587 - 6.234
120.2 - 132.432
740 - 597.84
1192 - 944.97
37.91 - 36.734
25.25 - 30.08
x : moisture content, % wb.
1776
mx+c
0.1089 x + 6.709
0.0258 x +5.923
0.0309 x + 4.675
0.0552 x +5.769
0.0505 x + 5.7066
0.0912 x + 9.9407
0.0656 x + 7.113
- 0.0047 x +0.8487
- 0.0079 x + 0.8807
2.301 x + 104.3
3.4546 x + 98.636
0.001 x + 6.1513
0.4772 x + 120.57
-3.4297 x +678.14
-8.8848 x + 1164
-0.1896 x + 41.964
0.1388 x + 26.749
R2
0.84
0.72
0.70
0.84
0.83
0.82
0.83
0.72
0.70
0.86
0.88
0.99
0.76
0.98
0.72
0.88
Int.J.Curr.Microbiol.App.Sci (2019) 8(4): 1770-1782
Fig.1 Effect of moisture content on principal dimensions of soaked soybean
Fig.2 Effect of moisture content on average values of principal dimensions of soaked soybean
1777
Int.J.Curr.Microbiol.App.Sci (2019) 8(4): 1770-1782
Fig.3 Effect of moisture content on degree of sphericity and aspect ratio of soaked soybean
Fig.4 Effect of moisture content on surface area and unit volume of soaked soybean
1778
Int.J.Curr.Microbiol.App.Sci (2019) 8(4): 1770-1782
Fig.5 Effect of moisture content on 1000 grain wt. of soaked soybean
Fig.6 Effect of moisture content on bulk and true densities of soaked soybean
1779
Int.J.Curr.Microbiol.App.Sci (2019) 8(4): 1770-1782
Fig.7 Effect of moisture content on porosity of soaked soybean
Fig.8 Effect of moisture content on angle of repose of soaked soybean
The similar decreasing trend in bulk and true
densities against moisture content was reported
by Deshpande (1993), Deshmukh (2016) and
Jadhav (2018) for soybean. Since the porosity
depends on the bulk as well as true densities,
the magnitude of variation in porosity of
soybean depend on moisture content factor. The
porosity of soybean was found to decrease
1780
Int.J.Curr.Microbiol.App.Sci (2019) 8(4): 1770-1782
linearly with increase in moisture content from
9.98 to 27.10 % (wb) (Fig. 7).
The experimental data obtained for angle of
repose of soaked soybean is given in Table 1.
The angle of repose increases linearly with the
increase in moisture content (Fig. 8). The value
of angle of repose increases from 25.25 to 30.08
degrees as moisture content increases from 9.98
% to 27.10% (wb). Similar increasing trend was
reported by Munde (1997) for green gram. The
relationship between angle of repose (θ) and
moisture content (x) can be expressed by
regression equations as:
sphericity increased from 0.829 to 0.757with
the increase in moisture content from 9.98 % to
27.10% (wb), respectively.
The bulk density decreased from 740 to 597.84
kg m-3, whereas the true density decreased
from 1192 to 944.97 kg m-3. While porosity
decreased from 37.91 - 36.734 with the increase
in moisture content from 9.98 % to 27.10%
(wb), respectively.
The angle of repose increased linearly from
25.25 to 30.08 degrees with the increase in
moisture content.
θ = 0.1388 x + 26.749 R2 = 0.88
References
Where,
Altuntaş, E., and Demirtola, H. (2007). Effect
of moisture content on physical properties
of some grain legume seeds. New
Zealand Journal of Crop and Horticultural
Science, 35(4): 423-433.
Altuntas, E. and Yildiz, M. (2007). Effect of
moisture content on some physical and
mechanical properties of faba bean (Vicia
faba L.) grains. Journal of Food
Engineering, 78:174-183.
Baryeh, E.A. (2001). Physical properties of
bambara groundnuts. Journal Food
Engg.,47: 321-326.
Baryeh, E.A. and Mangope, B.K. (2002). Some
physical properties of QP-38 variety
pigeon pea. Journal Food Eng., 56:59-65.
Carman, K. (1996). Some physical properties of
lentil grains. Journal of Agricultural
Engineering Research, 63(2): 87–92.
Anonymous a (2018). www.sopa.org
Deshpande, S.D., Bal, S. and Ojha, T.P. (1993).
Physical properties of soybean. Journal of
Agricultural
Engineering
Research,
56(2):89-98.
Deshmukh, C.G. (2016). Design and
development of roaster for production of
soynut. An unpublished M.Tech thesis
submitted to Department of Agricultural
Process
Engineering,
College
of
Agricultural
Engineering
and
Technology, Parbhani-431401.
x: moisture content, % wb.
(θ): angle of repose
All the dimensions and physical properties of
soaked soybean were significantly and
positively correlated to moisture content. A
relationship was observed between moisture
content to axial dimensions and physical
properties as shown in Table 2. The change in
soybean dimension during soaking could be
best expressed by a modified exponential
relationship with the R2 for equation fitting,
respectively. The results were statistically
analyzed for all physical properties of soaked
soybean.
Based on the results, following major
conclusions have been drawn in the present
investigation:
The average length, width and thickness of
soybean grains ranged from 6.34 to 8.95 mm,
5.42 to 6.50 mm and 4.23 to 5.35 mm as the
moisture content increased from 9.98 % to
27.10% (wb), respectively.
The geometric mean diameter increased from
5.258 to 6.777 mm. The thousand grain mass
increased from 120.2 to 132.432 g and the
1781
Int.J.Curr.Microbiol.App.Sci (2019) 8(4): 1770-1782
Gupta, R. K., and Das, S.K. (1997). Physical
properties of sunflower seeds. Journal of
Agricultural Engineering Research, 66: 18.
Isik, E. (2007).Some engineering properties of
soybean grains. American Journal of
Food Technology, 2(3): 115-125.
Jadhav, S.S. (2018). Performance evaluation of
multi-grain popper cum puffer for
selected grains. An unpublished M.Tech
thesis submitted to Department of
Agricultural Process Engineering, College
of
Agricultural
Engineering
and
Technology, Parbhani-431401.
Joshi, D. C., Das, S. D and Mukharjee, R.K.
(1993). Physical properties of pumpkin
seeds.
Journal
of
Agricultural
Engineering Research, 54: 219-229
Kibar, H. and Öztürk, T. (2008). Physical and
mechanical properties of soybean.
Department of Agricultural Structures and
Irrigation, Faculty of Agriculture,
University of Ondokuz Mayis. Journal of
International Agrophysics, 22:239-244.
Khedekar,
T.A.
(2013).
Design
and
development of roaster for soaked
soybean. An unpublished M.Tech thesis
submitted to Department of Agricultural
Process
Engineering,
College
of
Agricultural
Engineering
and
Technology, Parbhani-431401.
Khurmi, R.S. and Gupta, J.K. (2005). A
textbook of Machine Design. Eurasia
Publishing House (Pvt.) Ltd., Ram Nagar,
New Delhi.
Kulkarni, S.D. and Bargale, P.C. (2009).
Soybean production and utilization in
India status, prospects and the future
strategy. Management of soy-based
enterprises. Soybean processing and
utilization center (SPU), Central Institute
of Agricultural Engineering (CIAE)
Bhopal:17-18.
Mohsenin, N. N. (1980). Physical properties of
plant and animal materials. Gordon and
Breach Science Publishers Inc, New
York.
Munde, A.V. (1997). Effects of moisture
content on physical properties of green
gram.
Journal
of
Maharashtra
Agricultural Universities, 22 (3): 324327.
Olajide, J. O. and Ade-Omowage. (1999). Some
physical properties of locust bean seed.
Journal of Agricultural Engineering
Research, 74 (2): 15-22.
Ogunjimi, L. A., Aviara, N. A. and Aregbesola
O. A. (2002). Some engineering
properties of locust bean seed. Journal of
Food Engineering, 55 (2): 95-99.
Singh, K. P., Chandel, N. S., Potdar, R. R., Jat,
D., Agrawal, K. N. and Hota, S.
(2018).Assessment
of
Engineering
Properties of Proso Millet (Panicum
miliaceum).Journal
of
Agricultural
Engineering,55 (2): 42-51.
Wandkar, S.V., Ukey, P., D. and Pawar, D.A.
(2013). Determination of physical
properties of soybean at different
moisture levels. Farm Machinery Testing
and Training Centre, Dr. A. S. College of
Agricultural Engineering, Mahatma Phule
Krishi Vidyapeeth, Rahuri, Ahmednagar,
Maharashtra, 413722, India.
How to cite this article:
Avinash Kakade, Smita Khodke, Suhas Jadhav, Madhuri Gajabe and Nilza Othzes. 2019. Effect of
Moisture Content on Physical Properties of Soybean. Int.J.Curr.Microbiol.App.Sci. 8(04): 17701782. doi: />
1782