Summary of chemistry doctoral thesis: Study on chemical constituents and biological activities of Tacca vietnmensis and Tacca chantrierispecies growing in Vietnam
Bạn đang xem bản rút gọn của tài liệu. Xem và tải ngay bản đầy đủ của tài liệu tại đây (1.5 MB, 27 trang )
MINISTRY OF EDUCATION
VIETNAM ACADEMY
AND TRAINING
OF SCIENCE AND TECHNOLOGY
GRADUATE UNIVERSITY OF SCIENCE AND TECHNOLOGY
-----------------------------
VU THI QUYNH CHI
STUDY ON CHEMICAL CONSTITUENTS AND BIOLOGICAL
ACTIVITIES OF Tacca vietnamensis AND Tacca chantrieri
GROWING IN VIETNAM
Major: Organic chemistry
Code:
9.44.01.14
SUMMARY OF CHEMISTRY DOCTORAL THESIS
Hanoi - 2018
This thesis was completed at:
Graduate University Science and Technology - Vietnam Academy
of Science and Technology
Supervisor 1: Dr. Nguyen Xuan Nhiem
Institute of Marine Biochemistry - Vietnam Academy of Science and
Technology
Supervisor 2: Dr. Pham Hai Yen
Institute of Marine Biochemistry - Vietnam Academy of Science and
Technology
1st Reviewer:
2nd Reviewer:
3rd Reviewer:
The thesis will be defended at Graduate University of Science and
Technology - Vietnam Academy of Science and Technology,
at
date
month
2018
Thesis can be found in
- The library of the Graduate University of Science and Technology,
Vietnam Academy of Science and Technology.
- The National Library of Vietnam.
1
1.
INTRODUCTION
The urgency of the thesis
Vietnam has a long tradition of traditional medicine using a variety of herbs
for treating diseases and enhancing health. Vietnam has about 12,000 species of
higher plants. Of these, nearly 5,000 species are used as medicinal plants [1, 2].
The medicinal plant resources have played important role due to the great
potential in research and development of drugs in the treatment of diseases.
Many compounds from medicinal plants and animal were discovered
and used as drugs for treating diseases and enhancing health. However,
many of medicinal plants still need to be studied chemical constituents as
well as biological activities to find out bioactive compounds. The Tacca
species, the well-known medicinal plants were used for the treatment of
diseases such as gastric ulcer, enteritis, hepatitis, etc., get the attention of
scientists around the world. The studies have showed that the extract and
compounds from Tacca species exhibited various biological activities such
as cytotoxic, microtubules, anti-inflammatory, anti-fungal, antimicrobial,
and anti-bacterial activities, etc. In Vietnam, there are some species of
Tacca such as Tacca chantrieri, a traditional medicine was used for the
treatment of rheumatism. Tacca vietnamensis roots and tubers are used as
medicines such as Tacca chantrieri. Their leaves were used as vegetable.
There are few researches on the chemical components and biological
activities of Tacca species grown in Vietnam. Until so far, there are only 3
publications on Tacca plantaginea and Tacca chantrieri [1, 4-6].
Therefore, to identify bioactive compounds from Tacca species, I chosen
thesis topic "Study on chemical constituents and biological activities of Tacca
vietnmensis and Tacca chantrieri species growing in Vietnam".
2.
The aim of the thesis
Study on chemical constituents of two Tacca species including
Tacca vietnamensis and Tacca chantrierri growing in Vietnam.
2
Evaluate cytotoxic and inflammatory activities of isolates to find out
bioactive compounds.
3.
The main contents of the thesis
1. Isolate compounds from the rhizomes of T. vietnamensis and T.
chantrierri;
2. Elucidate chemical structures of the isolated compounds;
3. Evaluate the cytotoxic activity of the isolated compounds;
4. Evaluate the anti-inflammatory activity of isolated compounds.
CHAPTER 1: OVERVIEW
Overview of national and international researches related to my
study of the chemical constituents and biological activity of Tacca and
about cancer and inflammation.
1.1. Introduction to Tacca genus
The genus Tacca (Taccaceae) includes 17 species in the world. In
Vietnam, Tacca genus includes 6 species. They are all herbal plants and
distributed predominately in Southeast Asia, Pacific islands, and Africa,
... Their rhizomes have been used in traditional medicine to treat gastric
ulcer, enteritis, and hepatitis, etc. The chemical constituents of Tacca
include steroidal, diarylheptanoids and their glucosides, and some other
compounds. The phytochemical investigations of this genus confirmed
the presence of diarylheptanoids and steroidal saponins. In addition, these
compounds showed cytotoxic and anti-inflammatory activity [1, 3-6].
1.2. Introduction to Tacca vietnamensis and Tacca chantrieri
Tacca vietnamensis Thin et Hoat is an endemic plant in Vietnam.
However, there has not been studied about phytochemical investigation
of this plant.
Tacca chantrieri André is perennial plant growing in Vietnam and
some tropical countries. The phytochemical investigations of this plant
confirmed the presence of diarylheptanoids, steroidal saponins, …
3
1.3. Introduction to cancer
Introduction to cancer and some treatments; Some types of cancer
drugs are naturally derived.
1.4. Introduction to inflammation
Introduction of inflammation, anti-inflammatory drugs and some
products from nature have anti-inflammatory activity.
CHAPTER 2: EXPERIMENTAL AND RESULTS
2.1. Plant materials
The rhizomes of Tacca vietnamensis Thin et Hoat were collected in
Bachma National park, Thua Thien Hue, Vietnam.
The rhizomes of Tacca chantrieri André were collected in Tamdao,
Vinhphuc, Vietnam.
2.2. Methods
2.2.1. Methods for isolation
Chromatographic methods such as thin layer chromatography
(TLC), column chromatography (CC).
2.2.2. Methods for structural elucidation
Physical parameters and modern spectroscopic methods such as optical
rotation ([]D), electrospray ionization mass spectrometry (ESI-MS) and
high-resolution ESI-MS (HR-ESI-MS), one/two-dimension nuclear magnetic
resonance (NMR) spectra, circular dichroism spectrum (CD).
2.2.3. Biological assays
- Cytotoxic activity was determined by the MTT assay.
- Anti-inflammatory activity of the compounds was assessed on the
basis of inhibiting NO production in lipopolysaccharide (LPS) activated
BV2 cells.
2.3. Isolation of compounds
This section presents outlines of the general methods to isolate pure
substances from the plants samples.
2.3.1. Isolation of compounds from Tacca vietnanensis:
4
This section presents the process of isolating the compounds from
Tacca vietnamensis.
Figure 2.1. Isolation of compounds from Tacca vietnamensis
2.3.2. Isolation of compounds from Tacca chantrieri:
This section presents the process of isolating the compounds from
Tacca chantrieri.
Figure 2.2. Isolation of compounds from Tacca chantrieri
5
2.4. Physical properties and spectroscopic data of the isolated compounds
2.4.1. Physical properties and spectroscopic data of the isolated
compounds from Tacca vietnamensis
This section presents physical properties and spectroscopic data of 9
compounds from Taccca vietnamensis.
2.4.2. Physical properties and spectroscopic data of the isolated
compounds from Tacca chantrieri
This section presents physical properties and spectroscopic data of
13 compounds from Tacca chantrieri.
2.5. Results on biological activities of isolated compounds
2.5.1. Results on anti-inflammatory activity of compounds from Tacca
vietnamensis and Tacca chantrieri
- 9 compounds (TV1-TV9) were evaluated for the inhibitory
activities of nitric oxide production in LPS-stimulated BV2 cells.
Table 2.1. Inhibition activities of TV1-TV9 on NO production in the
LPS-stimulated BV2 cells at concentration of 80 μM
Comp.
TV1
TV2
TV3
TV4
Inhibition (%)
45.1 ± 2.2
43.2 ± 1.8
63.2 ± 1.5
67.5 ± 2.1
Comp.
TV5
TV6
TV7
Inhibition (%)
72.0 ± 2.5
40.0 ± 2.0
46.9 ± 2.2
Comp.
TV8
TV9
Butein*
(10 µM)
Inhibition (%)
42.2 ± 1.8
40.1 ± 3.0
90.0 ± 5.0
Table 2.2. Inhibitory NO effects of compounds TV3-TV5 in the
LPS-stimulated BV2 cells
Comp.
TV3
TV4
IC50 (µM)
52.1 ± 3.6
47.3 ± 6.0
Comp.
TV5
Butein*
IC50 (µM)
43.7 ± 4.2
4.3 ± 0.5
- 13 compounds (TC1-TC13) were evaluated for the inhibitory
activities of nitric oxide production in LPS-stimulated BV2 cells.
Table 2.3. Inhibition activities of TC1-TC13 on NO production in the
LPS-stimulated BV2 cells at concentration of 80 μM
Comp.
TC1
TC2
TC3
TC4
TC5
Inhibition (%)
85.1 ± 4.5
63.8 ± 3.6
43.2 ± 2.4
47.1 ± 2.5
46.5 ± 3.3
Comp.
TC6
TC7
TC8
TC9
TC10
Inhibition (%)
47.4 ± 2.5
42.0 ± 2.1
42.0 ± 3.0
45.7 ± 2.2
44.3 ± 2.1
Comp.
TC11
TC12
TC13
Butein (10
µM)
Inhibition (%)
40.8 ± 2.0
36.8 ± 2.8
28.7 ± 1.9
78.0 ± 4.2
6
Table 2.4. Inhibitory NO effects of compounds TC1-TC2 in the
LPS-stimulated BV2 cells
Comp.
TC1
TC2
IC50 (µM)
12.4 ± 2.4
59.0 ± 3.5
Comp.
Butein
IC50 (µM)
4.3 ± 0.8
2.5.2. Results on cytotoxic activity of compounds from Tacca
vietnamensis and Tacca chantrieri
- 13 compounds (TC1-TC13) were evaluated for cytotoxic activity on four
human cancer cell lines, including PC-3, LNCaP, MDA-MB-231 and HepG2.
Table 2.6. The effects of compounds on the growth of PC3, LNCaP,
MDA-MB-231 cell lines
Comp.
TC2
TC7
TC9
TC13
Ellipticine
PC-3
24.5 ± 1.2
30.7 ± 1.5
30.8 ± 2.0
17.9 ± 1.8
1.1 ± 0.1
IC50 (µM)
LNCaP
19.0 ± 1.5
19.1 ± 1.4
20.2 ± 1.2
18.8 ± 1.3
0.7 ± 0.1
MDA-MB-231
20.9 ± 1.6
24.2 ± 1.5
49.3 ± 3.2
22.0 ± 2.0
0.8 ± 0.1
CHAPTER 3: DISCUSSIONS
3.1. Chemical structure of isolated compounds
This section presents the detailed results of spectral analysis and
structure determination of 22 isolated compounds from Tacca
vietnamensis and Tacca chantrieri.
* 9 compounds from Tacca vietnamensis ( Figure 3.2):
Taccavietnamoside
A
(TV1),
taccavietnamoside
B
(TV2),
taccavietnamoside C (TV3), taccavietnamoside D (TV4), taccavietnamoside
E (TV5), (24S,25R)-spirost-5-en-3β,24-diol 3-O-α-L-rhamnopyranosyl(1→2)-[α-L-rhamnopyranosyl-(1→3)]-β-D-glucopyranoside
(TV6);
(24S,25R)-spirost-5-en-3β,24-diol 3-O-α-L-rhamnopyranosyl-(1→2)-[β-Dglucopyranosyl-(1→4)-α-L-rhamnopyranosyl-(1→3)]-β-D-glucopyranoside
(TV7); chantrieroside A (TV8) and plantagineoside A (TV9).
* 13 compounds from Tacca chantrieri (Figure 3.1): Chantriolide D
(TC1), chantriolide E (TC2), chantriolide A (TC3), chantriolide B
(TC4), chantriolide C (TC5), (3R,5R)-3,5-dihydroxy-1,7-bis (3,4dihydroxyphenyl)heptane (TC6), (3R,5R)-3,5-dihydroxy-1,7-bis(3,4-
7
dihydroxyphenyl)heptane 3-O-β-D-glucopyranoside (TC7), (3R,5R)-3,5dihydroxy-1,7-bis(4-hydroxyphenyl)heptane
3-O-β-D-glucopyranoside
(TC8),
(3R,5R)-3,5-dihydroxy-1-(3,4-dihydroxyphenyl)-7-(4hydroxyphenyl)heptane 3-O-β-D-glucopyranoside (TC9), (6S,9R)
roseoside (TC10), 2-hydroxyphenol-1-O-β-D-glucopyranoside (TC11),
1-O-syringoyl-β-D-glucopyranoside
(TC12)
and
benzyl-β-Dglucopyranosyl (1→6)-β-D-glucopyranoside (TC13).
Figure 3.2. Chemical structure of compounds from Tacca vietnamensis
Figure 3.3. Chemical structure of compounds from Tacca chantrieri
3.1.1. Spectral characteristics of taccalonolide and withanolide compounds
3.1.2. Spectral characteristics of spirostanol saponin
3.1.3. Chemical structure of isolated compounds from Tacca
vietnamensis:
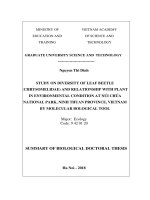
3.1.3.1 Compound TV1: Taccavietnamoside A (new compound)
8
Figure 3.4. Chemical structure of TV1 and taccasuboside C (65)
Compound TV1 was obtained as a white amorphous powder and its
molecular formula was determined as C45H72O18 on the basic of HR-ESI-MS
pseudo-ion at m/z 923.4607 [M+Na]+ (Calcd for [C45H72O18Na]+, 923.4611).
The 1H-NMR spectra of TV1 appeared signals including an olefinic protons at
δH 5.28 (br s), four methyl groups at δH 0.95 (s), 0.99 (s), 1.20 (d, J = 6.5 Hz)
and 1.59 (s), which suggested the structure of steroid skeleton. In addition to
these, three anomeric protons at δH 4.85 (d, J = 7.5 Hz), 5.71 (br s) and 5.81 (br
s), indicated the presence of three sugar moieties.
13
C-NMR and DEPT data of TV1 showed the presence of 45 carbons,
including 5 non-protonated carbons at δC 37.0, 40.9, 68.5, 111.5 and 140.7;
24 methine carbons at δC 31.5, 35.8, 50.2, 56.5, 62.3, 66.0, 69.8, 69.9, 70.5,
72.3, 72.4, 72.5, 72.7, 73.5, 73.7, 77.8, 77.9, 78.3, 81.8, 87.2, 99.8, 102.5,
103.7 and 121.7; 10 methylen carbons at δC 21.0, 30.0, 31.9, 32.2, 37.4,
38.6, 40.0, 45.1, 62.2 and 69.1 and 6 methyl groups at δC 14.5, 16.4,
18.3,18.6, 19.3 and 26.1. The HMBC correlations between H-4 (δH 2.64
and 2.70) and C-5 (δC 140.7)/C-6 (δC 121.7); between H-19 (δH 0.95) and
C-5 (δC 140,7) confirmed the position of double bond at C-5/C-6.
Moreover, the acetal group at C-22 was confirmed by 13C-NMR chemical
shift of C-22 (δC 111.5) as well as the HMBC correlations between H-20
(δH 3.00)/H-21 (δH 1.20)/H-26 (δH 3.60 and 4.13) and C-22 (δC 111.5).
Analysis the data of 1H-, 13C-NMR and DEPT spectra, chemical shift
of C-22 (δC111.5- spiro ring) and the published documents [19, 62],
which suggest the compound of TV1 is a spirostanol saponin. The NMR
data of TV1 (Table 3.1) were similar to those of taccasuboside C [19]
except for signals at C-23, C-24 and C-25 of aglycone: Chemical shift of
C-23, C-24, C-25 of TV1 are δC 66.0, 45.1 and 68.5, respectively
9
(Taccasuboside C: δC 64.6, 43.6, and 70.0 [19], recorded in pyridine-d5),
which suggested the different configuration at C-25.
The configurations of hydroxyl groups at C-23 and C-25 were defined
as equatorial orientation by ROESY observation between H-21 (δH 1.20) and
H-23 (δH 3.99); and between H-23 (δH 3.99) and H-27 (δH 1.59).
Sugars obtained by acid hydrolysis of TV1 were identified as D-glucose
and L-rhamnose based on GC analysis (identified as TMS derivatives). In
addition, the HMBC cross peaks from rha H-1′′ (H 5.81) to glc C-2′ (C
78.3); from rha H-1′′′ (H 5.71) to glc C-3′ (C 87.2) and from glc H-1′ (H
4.85) to C-3 (C 77.8) confirmed the sugar linkages as α-L-rhamnopyranosyl(1→2)-O-[α-L-rhamnopyranosyl-(1→3)]-β-D-glucopyranoside, with the
location of sugar moiety at C-3 of aglycone. This was also in good agreement
with the 13C NMR data of trisaccharide reported for taccasuboside C from
Tacca subflabellata [19]. Thus, the structure of TV1 was elucidated to be
(23S,25R)-spirost-5-en-3β,23,25-triol 3-O-α-L-rhamnopyranosyl-(1→2)-[α-Lrhamnopyranosyl-(1→3)]-β-D-glucopyranoside
and
named
taccavietnamoside A.
Figure 3.5. The important HMBC
Figure 3.6. HR-ESI-MS of TV1
and ROESY correlations of TV1
Table 3.1. NMR spectral data of TV1 and reference compound
C
Aglycone
1
2
3
4
5
6
7
8
9
C#
Ca,b
Ha,c(mult., J, Hz)
37.5
30.1
77.9
38.7
37.4
30.0
77.8
38.6
140.8
121.8
32.4
31.6
50.3
140.7
121.7
32.2
31.5
50.2
0.91 (m)/1.66 (m)
1.80 (m)/2.06 (m)
3.88 (m)
2.64 (dd. 12.0, 12.0)
2.70 (br d, 12.0)
5.28 (br s)
1.45 (m)/1.81 (m)
1.48 (m)
0.85 (m)
10
C
10
11
12
13
14
15
16
17
18
19
20
21
22
23
24
C#
C
37.2
21.1
40.2
41.1
56.7
32.3
81.9
62.6
16.6
19.4
35.8
14.9
112.2
64.6
43.6
37.0
21.0
40.0
40.9
56.5
31.9
81.8
62.3
16.4
19.3
35.8
14.5
111.5
66.0
45.1
25
26
70.0
69.3
68.5
69.1
27
3-O-
26.9
26.1
1′
2′
3′
4′
5′
6′
99.9
78.4
87.5
69.9
78.1
62.3
99.8
78.3
87.2
69.8
77.9
62.2
4.85 (d, 7.5)
4.00 (dd, 7.5, 8.5)
4.12 (dd, 8.5, 9.0)
4.00 (dd, 8.5, 9.0)
3.77 (m)
4.29 (br d, 11.5)
4.41 (br d, 11.5)
1′′
2′′
3′′
4′′
5′′
6′′
3′-O-
102.7
72.5
72.9
73.9
69.9
18.7
102.5
72.3
72.7
73.7
69.9
18.6
5.81 (br s)
4.72 (br s)
4.46 (dd, 2.5, 9.0)
4.29 (m)
4.82 (m)
1.72 (d, 6.0)
1′′′
2′′′
3′′′
4′′′
5′′′
6′′′
103.9
72.5
72.7
73.6
70.7
18.5
103.7
72.4
72.5
73.5
70.5
18.3
5.71 (br s)
4.81 (br s)
4.48 (dd, 2.5, 9.0)
4.29 (m)
4.75 (m)
1.62 (d, 6.0)
a,b
Ha,c(mult., J, Hz)
1.38 (m)
1.11 (m)/1.71 (m)
1.05 (m)
1.45 (m)/1.97 (m)
4.60 (m)
1.88 (t,. 8.5)
0.99 (s)
0.95 (s)
3.00 (q, 7.0)
1.20 (d, 6.5)
3.99 (br d, 8.5)
2.47 (br d, 12.0)
2.57 (m)
3.60 (d, 10.5)
4.13 (d, 10.5)
1.59 (s)
Glc
2′-ORha
Rha
a
Recorded in C5D5N, b125 MHz, c 500 MHz, # δC of taccasuboside C [19]
11
Figure 3.7. 1H-NMR spectrum of TV1
Figure 3.8. 13C-NMR spectrum of TV1
Figure 3.9. DEPT spectrum TV1
Figure 3.10. HSQC spectrum of
TV1
Figure 3.11. HMBC spectrum của TV1
Figure 3.12. ROESY spectrum of TV1
3.1.3.2 Compound TV2: Taccavietnamoside B (new compound)
Figure 3.13. Chemical structure of TV2 and reference compound TV1
Compound TV2 was obtained as a white amorphous powder and its
molecular formula was determined as C51H82O23 on the basic of HR-ESI-MS
pseudo-ion at m/z 1085.5133 [M+Na]+ (Calcd for [C51H82O23Na]+, 1085.5139).
The 1H-NMR spectra of TV2 appeared signals including an olefinic protons at
δH 5.27 (br s), four methyl groups at δH 0.96 (s), 0.99 (s), 1.21 (d, J = 7.0 Hz)
and 1.59 (s), which suggested the structure of steroid skeleton. In addition, four
12
anomeric protons at δH 4.85 (d, J = 8.0 Hz), 5.21 (d, J = 8.0 Hz), 5.71 (br s),
and 5.76 (br s), indicated the presence of four sugar units.
13
C-NMR and DEPT spectra of TV2 showed the presence of 51 carbons:
including 5 non-protonated carbons at δC 37.0, 41.0, 68.5, 111.5 and 140.7; 29
methine carbons at δC 31.5, 35.8, 50.2, 56.6, 62.3, 66.0, 68.7, 69.7, 69.8, 71.4, 72.0,
72.3, 72.4, 72.7, 73.7, 76.3, 77.8, 78.0, 78.3, 78.5, 78.6, 81.8, 84.3, 86.2, 99.8,
102.5, 103.1, 106.4 and 121.7; 11 methylen carbons at δC 21.0, 30.0, 32.0, 32.3,
37.4, 38.8, 40.1, 45.2, 62.1, 62.5, and 69.2; and 6 methyl carbons at δC 14.5, 16.5,
18.2, 18.6, 19.3, and 26.2. The NMR data and chemical shift at C-22 (δC111.5spiro ring) on 13C-NMR spectrum, which suggested TV2 is a spirostanol saponin.
The 1H- and 13C-NMR data of TV2 were similar to those of
taccavietnamoside A (TV1), except for the addition of a sugar unit at C-4″″:
signals of anomeric proton at δH 5.21 (d, J = 8.0) and 6 carbons at δC 62.5,
71.4, 76.3, 78.3, 78.6 and 106.4. Sugars obtained by acid hydrolysis of TV2
were identified as D-glucose and L-rhamnose based on GC analysis (identified
as TMS derivatives). In addition, the HMBC cross peaks from rha H-1″ (δH
5.76) to glc C-2′ (δC 78.5), from glc H-1″″ (δH 5.21) tới rha C-4‴ (δC 84.3),
from rha H-1‴ (δH 5.71) to glc C-3′ (δC 86.2), and from glc H-1′ (δH 4.85) to C3 (δC 77.8) confirmed the sugar linkages as O-α-L-rhamnopyranosyl-(1→2)O-[β-D-glucopyranosyl-(1→4)-O-α-L-rhamnopyranosyl-(1→3)]-β-Dglucopyranoside and the location of sugar at C-3 of aglycone. This sugar
moiety was also reported from Tacca chantrieri [29]. Consequently, the
structure of TV2 was determined to be (23S,25R)-spirost-5-en-3β,23,25-triol
3-O-α-L-rhamnopyranosyl-(1→2)-[β-D-glucopyranosyl-(1→4)-α-Lrhamnopyranosyl-(1→3)]-β-D-glucopyranoside
and
named
taccavietnamoside B.
Figure 3.14. The important HMBC and
COSY correlations of TV2
Figure 3.15. HR-ESI-MS of
TV2
13
Table 3.2. NMR spectral data of TV2 and reference compound
C
Aglycone
1
2
3
4
5
6
7
8
9
10
11
12
13
14
15
16
17
18
19
20
21
22
23
24
25
26
27
3-O-Glc
1′
2′
3′
4′
5′
6′
2′-O-Rha
1′′
2′′
3′′
4′′
5′′
6′′
3′-O-Rha
1′′′
2′′′
3′′′
C#
Ca,b
DEPT
Ha,c (mult., J, Hz)
37.4
30.0
77.8
38.6
140.7
121.7
32.2
31.5
50.2
37.0
21.0
40.0
40.9
56.5
31.9
81.8
62.3
16.4
19.3
35.8
14.5
111.5
66.0
45.1
68.5
69.1
26.1
37.4
30.0
77.8
38.8
140.7
121.7
32.3
31.5
50.2
37.0
21.0
40.1
41.0
56.6
32.0
81.8
62.3
16.5
19.3
35.8
14.5
111.5
66.0
45.2
68.5
69.2
26.2
CH2
CH2
CH
CH2
C
CH
CH2
CH
CH
C
CH2
CH2
C
CH
CH2
CH
CH
CH3
CH3
CH
CH3
C
CH
CH2
C
CH2
CH3
0.92 (m)/1.66 (m)
1.80 (m)/2.06 (m)
3.86 (m)
2.63 (dd, 12.0, 12.0)/2.69 (dd, 4.5, 12.0)
5.27 (d, 4.5)
1.42 (m)/1.80 (m)
1.48 (m)
0.86 (m)
1.38 (m)
1.11 (m)/1.71 (m)
1.05 (m)
1.43 (m)/1.97 (m)
4.60 (m)
1.88 (t, 7.5)
0.99 (s)
0.96 (s)
3.00 (q, 7.0)
1.21 (d, 7.0)
3.97 (br d, 8.5)
2.47 (br d, 11.0)/2.54 (t, 11.0)
3.60 (d, 10.5)/4.12 (d, 10.5)
1.59 (s)
99.8
78.3
87.2
69.8
77.9
62.2
99.8
78.5
86.2
69.7
78.0
62.1
CH
CH
CH
CH
CH
CH2
4.85 (d, 8.0)
4.00 (t, 8.0)
4.12 (m)
4.05 (t, 8.5)
3.76 (m)
4.29 (dd, 3.0, 12.0)/4.40 (dd, 5.0, 12.0)
102.5
72.3
72.7
73.7
69.9
18.6
102.5
72.4
72.7
73.7
69.8
18.6
CH
CH
CH
CH
CH
CH3
5.76 (br s)
4.69 (br s)
4.47 (dd, 3.0, 9.0)
4.25 (m)
4.80 (m)
1.72 (d, 6.5)
103.7
72.4
72.5
103.1
72.0
72.3
CH
CH
CH
5.71 (br s)
4.82 (br s)
4.54 (dd, 2.5, 9.0)
14
C
4′′′
5′′′
6′′′
4′′′-O-Glc
1′′′′
2′′′′
3′′′′
4′′′′
5′′′′
6′′′′
a
C#
Ca,b
84.3
68.7
18.2
DEPT
CH
CH
CH3
Ha,c (mult., J, Hz)
73.5
70.5
18.3
106.4
76.3
78.6
71.4
78.3
62.5
CH
CH
CH
CH
CH
CH2
5.21 (d, 8.0)
4.05 (m)
4.02 (m)
4.23 (t, 9.0)
3.76 (m)
4.29 (dd, 3.0, 12.0)/4.40 (dd, 5.0, 12.0)
4.39 (m)
4.76 (m)
1.66 (d, 6.0)
Recorded in C5D5N, b125 MHz, c 500 MHz, #δC of taccavietnamoside A (TV1)
Figure 3.16. 1H-NMR
spectrum of TV2
Figure 3.17. 13C-NMR spectrum of TV2
Figure 3.18. DEPT spectrum
of TV2
Figure 3.19. HSQC spectrum of TV2
Figure 3.20. HMBC spectrum
of TV2
Figure 3.21. COSY of
TV2
Figure 3.22. ROESY
of TV2
15
3.1.4. Chemical structure of isolated compounds from Tacca chantrieri
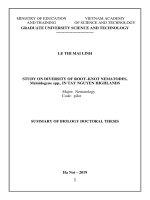
3.1.4.1 Compound TC1: Chantriolide D (new compound)
Figure 3.23. Chemical structure of TC1 and taccanlonolide M (13)
Compound TC1 was obtained as a white amorphous powder.
Its molecular formula was assigned as C35H50O15 on the basic of HR-ESI-MS
pseudo-ion at m/z 711.3237 [M+H]+ (Calcd for [C35H51O15]+, 711.3222) and
m/z 733.3055 [M+Na]+ (Calcd for [C35H50O15Na]+, 733.3042). The 1H-NMR
spectra of TC1 exhibited signals for four methyl groups at δH 0.76 (3H, s), 1.13
(3H, s), 0.80 (3H, d, J = 6.0 Hz) and 1.17 (3H, d, J = 6.0 Hz), two methyl
acetyl groups at δH 1.91 (3H, s) and 2.06 (3H, s), which suggested the structure
a steroid with two acetyl groups. In addition, anomeric protons at δH 4.20 (d, J
= 8.0 Hz), indicated the presence of a sugar unit.
The 13C-NMR and DEPT spectra of TC1 revealed the presence of 35
carbons, including: 2 ketone carbons at δC 206.0 and 211.7; 2 acetyl carbonyl
carbons at δC 170.2 and 170.5, 3 non-protonated carbons at δC 41.9, 42.6, and
81.0; 18 methine carbons at δC 31.7, 37.1, 41.6, 41.8, 51.0, 51.8, 53.7, 54.3,
54.9, 70.8, 72.7, 74.3, 74.6, 77.1, 77.4, 78.2, 86.0 and 105.5; 4 methylene
carbons at δC 25.2, 29.6, 44.5, and 61.9 and 6 methyl carbons at δC 13.3, 15.3,
15.3, 19.8, 20.2 and 21.0. All these data coupled with a literature survey
indicated that TC1 was a steroidal glucoside [15]. The HMBC correlations
HMBC between H-6 (δH 4.22) and C-5 (δC 81.0)/C-7 (δC 206.0)/C-10 (δC
42.6); between H-14 (δH 2.74)/H-16 (δH 1.46)/H-17 (δH 1.65) and C-15 (δC
211.7) confirmed the positions of two hydroxy groups at C-5 and C-6, two
ketone groups at C-7 and C-15. The 13C-NMR chemical shift to a higher field
at C-2 (δC 51.0), C-3 (δC 54.9) and correlation HMBC from H-4 (δH 2.37) to
C-2 (δC 50.1)/C-3 (δC 54.9) suggested the epoxy group at C-2/C-3. Two
16
acetoxy groups at C-1 and C-12 were confirmed by HMBC correlations from
HMBC to H-1 (δH 4.67) and H-12 (δH 4.93) to acetyl carbonyls (δC 170.2 and
170.5), respectively. The HMBC correlations between H-19 (δH 1.13) and C1(δC 72.7)/C-5 (δC 81.0)/C-9 (δC 37.1)/C-10 (δC 42.6); between H-18 (δH 0.76)
and C-12 (δC 74.3), C-13 (δC 41.9), C-14 (δC 54.3), C-17 (δC 51.8); between
H-21 (δH 0.80) and C-17 (δC 51.8), C-20 (δC 31.7), C-22 (δC 44.5); between
H-25 (δH 1.17) and C-16 (δC 53.7), C-23 (δC 86.0), C-24 (δC 41.8) confirmed
the positions of four methyl groups at C-10, C-13, C-20 and C-24,
respectively. Acid hydrolysis of TC1 gave D-glucose (identified as TMS
derivative by GC). The location of the sugar moiety at C-23 was confirmed
by HMBC correlation from glc H-1′ (δH 4.20) to aglycone C-23 (δC 86.0). The
configuration of the oxygenated groups at C-1, C-2, C-6, C-12 was defined as
α-orientations, based on the similarity of the 13C-NMR spectral data from C-1
to C-19 of TC1 and taccanlonolide M [15]. In addition, the α-orientations of
the oxygenated groups at C-1, C-2, C-6, C-12 were based on the observation
of ROE correlations on ROESY spectrum between H-18 (δH 0.76) and H-12
(δH 4.93)/H-8 (δH 2.59); H-19 (δH 1.13) and H-1 (δH 4.67)/H-2 (δH 3.57)/H-6
(δH 4.22)/H-8 (δH 2.59). The α-orientation of oxygenated group at C-23 was
based on the ROE correlations between H-23 (δH 3.10) and H-16 (δH 1.46)/H25 (δH 1.17). Thus, the structure of TC1 was determined and named
chantriolide D.
Figure 3.24. The important HMBC correlations of TC1
Table 3.9. NMR spectral data of TC1 and reference compound
C
Aglycone
1
2
3
4
5
C#
Ca,b
DEPT
Ha,c (mult., J, Hz)
73.0
49.1
55.3
29.7
81.3
72.7
51.0
54.9
29.6
81.0
CH
CH
CH
CH2
C
4.67 (d, 5.0)
3.57 (t, 5.0)
3.51 (m)
2.37 (d, 16.0)/2.07*
-
17
C
6
7
8
9
10
11
12
13
14
15
16
17
18
19
20
21
22
23
24
25
1-OAc
12-OAc
23-OGlc
1′
2′
3′
4′
5′
6′
#
C
78.4
205.8
42.0
37.5
42.2
25.7
73.9
42.1
55.4
210.8
53.2
51.4
13.4
15.5
31.0
19.4
43.8
86.4
42.0
170.3
20.7
170.6
21.0
78.2
206.0
41.6
37.1
42.6
25.2
74.3
41.9
54.3
211.7
53.7
51.8
13.3
15.3
31.7
19.8
44.5
86.0
41.8
15.3
170.2
20.2
170.5
21.0
DEPT
CH
C
CH
CH
C
CH2
CH
C
CH
C
CH
CH
CH3
CH3
CH
CH3
CH2
CH
CH
CH3
CH3
CH3
Ha,c (mult., J, Hz)
4.22*
2.59 (dd, 11.5, 12.0)
2.21 (dd, 4.0, 12.0)
1.41 (dd, 4.0, 15.0)/1.79 (br d, 15.0)
4.93 (br s)
2.74 (d, 11.5)
1.46 (dd, 11.5, 11.5)
1.65 (dd, 11.5, 11.5)
0.76 (s)
1.13 (s)
1.52 (m)
0.80 (d, 6.0)
1.13*/2.13 (m)
3.10*
1.63 (m)
1.17 (d, 6.0)
105.5
74.6
77.4
70.8
77.1
61.9
CH
CH
CH
CH
CH
CH2
4.20 (d, 8.0)
2.98 (t, 8.0)
3.17*
3.10*
3.10*
3.47 (dd, 4.0, 11.5)/3.66 (br d, 11.5)
a,b
C
1.91 (s)
2.06 (s)
a Recorded in CD OD, b125MHz, c 500MHz, # of taccanlonolide M [15], * Overlapped
3
C
signals
3.1.4.1 Compound TC2: Chantriolide E (new)
Compound TC2 molecular formula was assigned as C36H51O15+Cl on
the basic of HR-ESI-MS pseudo-ion at m/z 781.2854 [M+Na]+ (Calcd for
[C36H51O15ClNa]+, 781.2809). The 1H-NMR spectra of TC2 appeared
signals of four methyl group protons: three tertiary methyl groups at δH
0.94 (3H, s), 1.09 (3H, s) and 2.14 (3H, s), one second methyl group at δH
1.01 (3H, d, J = 7.0 Hz); one methyl acetyl group δH 2.13 (H, br s); one
anomeric proton at δH 4.36 (H, d, J = 8.0 Hz). The 13C-NMR and DEPT
spectra of TC2 showed the signals of 36 carbons including 3 carbonyl
carbons at δC 167.9, 172.3, 2 and 218.1; 5 non-protonated carbon at δC
42.0, 47.9, 74.7, 123.8, and 159.6; 17 methine carbons at δC 30.5, 35.4,
18
36.5, 41.3, 56.4, 57.3, 57.4, 60.4, 71.6, 74.6, 75.1×2, 76.7, 77.9, 78.0, 78.7
and 103.9; 6 methylene carbons at δC 25.4, 33.1, 38.1, 43.8, 62.8 and 63.5;
5 methyl carbons at δC 13.4, 14.8, 15.5, 20.7 and 21.4.
Figure 3.25. Chemical structure of TC2 and plantagiolide I (46)
The NMR spectra data of TC2 were similar to those of plantagiolide
I [5], the main difference was the absence of the acetoxy group at C-2.
The HMBC correlation between H-19 (δH 0.94) and C-1 (δC 76.7)/C-5
(δC 74.7)/C-9 (δC 30.5)/C-10 (δC 42.0); H-18 (δH 1.09) and C-12 (δC
75.1)/C-13 (δC 47.9)/C-14 (δC 41.3)/C-17 (δC 57.4); H-21 (δH 1.01) and
C-17 (δC 57.4)/C-20 (δC 36.5)/C-22 (δC 78.7); H-28 (δH 2.14) and C-23
(δC 33.1)/C-24 (δC 159.6)/C-25 (δC 123.8) showed position of 4 methyl
groups at C-10, C-13, C-20 and C-24. The HMBC correlation from
methyl proton (δH 2.13), aglycone H-12 (δH 5.18) to acetoxy carbonyl
groups (δC 172.3) confirmed position of this acetoxy group at C-12. The
13
C-NMR chemical shift of C-6, C-7 was shifted to a higher field [C-6 (δC
57.3), C-7 (δC 56.4)] and the HMBC correlation from H-6 (δH 2.99) to C5 (δC 74.7), suggesting the presence of a epoxy ring at C-6/C-7 and OH
group at C-5. The HMBC correlation from H-27 (δH 4.65) to C-24 (δC
159.6)/C-25 (δC 123.8)/C-26 (δC 167.9) showed position of carbonyl
group at C-26 and double bond at C-24/C-25. The HMBC correlation
from H-15 (δH 2.49)/H-17 (δH 2.72) to C-16 (δC 218.1), suggesting the
presence of oxo group at C-16. Acid hydrolysis of TC2 gave D-glucose
19
(identified as TMS derivative by GC). The sugar at C-27 was proved by
HMBC correlation between glc H-1′ (δH 4.36) to C-27 (δC 63.5). The 13C
NMR chemical shift of C-3 (δC 60.4) was shifted to higher field
compared with that of the oxymethine carbon C-2 (δC 74.6), suggesting
the presence of a chlorine atom at C-3. The HR-ESI-MS of TC2 showed
pseudo-molecular ion peaks at m/z 781.2854 [C36H51O15Cl35+Na]+ and
m/z 783.2891 [C36H51O15Cl37+Na]+ (Calcd for [C36H51O15Cl35+Na]+:
781.2809 and [C36H51O15Cl37+Na]+: 783.2802), confirming the presence
of chlorine atom in TC2. The configuration of chlorine at C-3 was
determined as β (equatorial) by the large coupling constant, J = 10.0 Hz,
between H-2 and H-3. The constitution of TC2 was confirmed by a detailed
interpretation of 2D-NMR spectra, including HSQC, HMBC, COSY, and
ROESY. Thus, the structure of 2 was established and named chantriolide E.
Figure 3.26. The important HMBC correlations of TC2
Table 3.10. NMR spectral data of TC2 and reference compound
C
Aglycone
1
2
3
4
5
6
7
8
9
10
11
C#
Ca,b
DEPT
Ha,c (mult., J, Hz)
73.7
76.6
56.9
43.7
74.2
56.6
55.4
34.7
30.0
41.6
24.9
76.7
74.6
60.4
43.8
74.7
57.3
56.4
35.4
30.5
42.0
25.4
CH
CH
CH
CH2
C
CH
CH
CH
CH
C
CH2
3.57 (d, 4.0)
3.94 (dd, 4.0, 10.0)
4.36 (m)
2.19*/2.33 (dd. 6.6, 13.5)
2.99 (d, 3.0)
3.36 (dd, 2.0, 3.0)
2.19 (m)
2.27 (m)
1.73 (t, 12.0)/2.01*
20
C
12
13
14
15
16
17
18
19
20
21
22
23
24
25
26
27
28
12-OAc
C#
Ca,b
74.0
47.0
40.7
37.6
215.9
56.4
14.7
15.6
35.6
13.2
77.3
32.4
156.8
123.7
165.6
63.5
20.6
170.6
21.2
75.1
47.9
41.3
38.1
218.1
57.4
14.8
15.5
36.5
13.4
78.7
33.1
159.6
123.8
167.9
63.5
20.7
172.3
21.4
DEPT
CH
C
CH
CH2
C
CH
CH3
CH3
CH
CH3
CH
CH2
C
C
C
CH2
CH3
C
CH3
Ha,c (mult., J, Hz)
5.18 (br s)
2.50 (m)
2.22 (m)/2.49 (m)
2.72 (d, 7.5)
1.09 (s)
0.94 (s)
2.38 (m)
1.01 (d, 7.0)
4.92 (m)
2.40 (m)/2.50 (m)
4.48 (d, 11.5)/4.65 (d, 11.5)
2.14 (s)
2.13 (s)
27-OGlc
1′
104.9
103.9 CH
4.36 (d, 8.0)
2′
75.4
75.1 CH
3.20 (t, 8.0)
3′
78.6
78.0 CH
3.37 (m)
4′
71.8
71.6 CH
3.32 (m)
5′
78.8
77.9 CH
3.30 (m)
6′
62.9
62.8 CH2
3.70 (dd, 2.0, 12.0)/3.89 (dd, 5.4, 12.0)
a Recorded in CD OD, b125MHz, c500MHz, # of plantagiolide I [5], * Overlapped signals
3
C
Figure 3.27. HR-ESI-MS spectrum
of TC2
Figure 3.28. 1H-NMR spectrum of
TC2
Figure 3.29. 13C-NMR spectrum of Figure 3.30. DEPT spectrum of TC2
TC2
21
Figure 3.31.HSQC spectrum of TC2 Figure 3.32.HMBC spectrum of TC2
Figure 3.33.COSY spectrum of TC2 Figure 3.34.ROESY spectrum of TC2
3.2. Biological activities of isolated compounds
3.2.1. Anti-inflammatory activity of isolated compounds
22 compounds from Tacca vietnamensis and Tacca chantrieri were
evaluated for their inhibitory activity on NO production in BV2 cells,
LPS-stimulated. As results, compounds TV3-TV5 inhibited NO
production in BV2 cells, LPS-stimulated, with IC50 values of 52.1 ± 3.6
µM, 47.3 ± 6.0 µM, 43.7 ± 4.2 µM, respectively. Butein was used as a
positive control, IC50 of 4.3 ± 0.5 µM. Chantriolide D (TC1) and
chantriolide E (TC2) inhibited NO production in BV2 cells, LPSstimulated, with IC50 of 12.4 ± 2.4 µM and 59.0 ± 3.5 μM. Butein was
used as a positive control, IC50 of 4.3 ± 0.8 µM.
3.2.2. Cytotoxic activities of isolated compound from Tacca chantrieri
13 compounds from Tacca chantrieri were evaluated for cytotoxic
activities toward four human cancer lines, including PC-3, LNCaP,
MDA-MB-231 and HepG2 cells. The results showed that the new
withanolide glucoside (chantriolide E) exhibited cytotoxic activities
against three human cancer cell lines, PC-3, LNCaP, and MDA-MB-231
with IC50 of 24.5 ± 1.2 µM, 19.0 ± 1.5 µM, 20.9 ± 1.6 µM, respectively.
TC7 exhibited cytotoxic activities against three human cancer cell lines,
PC-3, LNCaP and MDA-MB-231 with IC50 of 30.7 ± 1.5, 19.1 ± 1.4 and
22
24.2 ± 1.5 µM, respectively. TC9 exhibited cytotoxic activities against
three human cancer cell lines, PC-3, LNCaP and MDA-MB-231 with IC50
of 30.8 ± 2.0, 20.2 ± 1.2 and 49.3 ± 3.2 µM. TC13 exhibited cytotoxic
activities against three human cancer cell lines, PC-3, LNCaP and MDAMB-231 with IC50 of 17.9 ± 1.8, 18.8 ± 1.3 and 22.0 ± 2.0 µM,
respectively. Ellipticine was used as a positive control (IC50 of 1.1 ± 0.1,
0.7 ± 0.1, 0.8 ± 0.1µM, respectively).
CONCLUSIONS
This is the first study on chemical constituents and biological
activities of Tacca vietnamensis and biological activities of Tacca
chantrieri growing in Vietnam.
1. Nine compounds were isolated and identified from Tacca
vietnamensis. Among them, five new compounds: 5 spirostanol saponin:
taccavietnamosides A-E (TV1-TV5). Four known compounds: 3
spirostanol glycoside: (24S,25R)-spirost-5-en-3β,24-diol 3-O-α-Lrhamnopyranosyl-(1→2)-[α-L-rhamnopyranosyl-(1→3)]-β-Dglucopyranoside (TV6), (24S,25R)-spirost-5-en-3β,24-diol 3-O-α-Lrhamnopyranosyl-(1→2)-[β-D-glucopyranosyl-(1→4)-α-Lrhamnopyranosyl-(1→3)]-β-D-glucopyranoside (TV7), chantrieroside A
(TV8); one diaryl heptanoid glycoside: plantagineoside A (TV9).
2. Thirteen compounds were isolated and identified from Tacca
chantrieri, including: Two new compounds: one taccalonolide:
Chantriolide D (TC1) and one withanolide glucoside: Chantriolide E
(TC2). Eleven known compounds: Three withanolide glycoside:
Chantriolide A (TC3), chantriolide B (TC4) and chantriolide C (TC5);
four knowed diaryl heptanoid glycoside: (3R,5R)-3,5-dihydroxy-1,7-bis
(3,4-dihydroxyphenyl)heptane (TC6), (3R,5R)-3,5-dihydroxy-1,7-bis(3,4dihydroxyphenyl)heptane 3-O-β-D-glucopyranoside (TC7), (3R,5R)-3,5dihydroxy-1,7-bis(4-hydroxyphenyl)heptane
3-O-β-D-glucopyranoside
(TC8)
and
(3R,5R)-3,5-dihydroxy-1-(3,4-dihydroxyphenyl)-7-(4hydroxyphenyl)heptane
3-O-β-D-glucopyranoside
(TC9);
one
megastigmane: (6S,9R)-roseoside (TC10); three compounds were isolated
from Tacca genus for the first time: 2-hydroxyphenol-1-O-β-D-
23
glucopyranoside (TC11), 1-O-syringoyl-β-D-glucopyranoside (TC12) and
benzyl-β-D-glucopyranosyl (1→6)-β-D-glucopyranoside (TC13).
3. Twenty-wo isolated compounds from Tacca vietnamensis and
Tacca chantrieri were tested for their inhibitory activity on NO
production in activated BV2 cells. As the results, spirostanol saponin
compounds (TV3-TV5) were isolated from Tacca vietnamensis showed
inhibitory activity on NO production in LPS-stimulated BV2
cells with IC50 values of 52.1 ± 3.6 µM, 47.3 ± 6.0 µM, 43.7 ± 4.2 µM,
respectively. Compounds chantriolide D (TC1) and chantriolide E (TC2)
were isolated from Tacca chantrieri showed significant inhibitory
activity on NO production in LPS-stimulated BV2 cells with IC50 values
of 12.4 ± 2.4 µM and 59.0 ± 3.5 μM, respectively.
4. Thirteen isolated compounds (TC1-TC13) from Tacca chantrieri
species were evaluated for cytotoxic activity on four human cancer cell
lines, including PC-3, LNCaP, MDA-MB-231 and HepG2. The
chantriolide E (TC2) exhibited moderate activity on PC-3, LNCaP and
MDA-MB-231 cell lines with IC50 values of 24.5 ± 1.2 µM, 19.0 ± 1.5
µM, and 20.9 ± 1.6 µM, respectively. The results of the thesis also
supplemented the claims of cytotoxic activity on the new cancer lines
(PC-3, LNCaP, MDA-MB-231) of known compounds: Chantriolide A,
two diaryl heptanoid glycoside (TC7, TC9) and one benzyl glycoside
(TC13) in normal values of IC50 17.9 ÷ 49.3 µM.
RECOMMENDATIONS
From the research results: Spirostanol saponin TV3-TV5, chantriolide
D (TC1) and chantriolide E (TC2) showed significant inhibitory activity on
NO production in LPS-stimulated BV2. Therefore, further research is needed
on the applicability of these compounds in practice.
Chantriolide E has demonstrated significant anti-inflammatory
activity and demonstrated the inhibition activity of PC-3, LNCaP and
MDA-MB-231 cancer cell lines. Therefore, there should be more
research about the activity of this compound for use as medicines.