Multidimensional poverty among households in Southwest Nigeria
Bạn đang xem bản rút gọn của tài liệu. Xem và tải ngay bản đầy đủ của tài liệu tại đây (479.43 KB, 20 trang )
Journal of Economics and Development, Vol.20, No.1, April 2018, pp. 48-67
ISSN 1859 0020
Multidimensional Poverty among
Households in Southwest Nigeria
Sakiru Oladele Akinbode
Department of Economics, Federal University of Agriculture, Abeokuta, Nigeria
Email:
Folake Elizabeth Ojediran
Department of Economics, Federal University of Agriculture, Abeokuta, Nigeria
Email:
Received: 29 January 2017 | Revised: 19 December 2017 | Accepted: 13 Febuary 2018
Abstract
Money metrics have been adopted in studies of household poverty in Nigeria while few have
considered alternative methods. This study analysed poverty among households in southwest
Nigeria adopting a “Multidimensional Approach”. This is necessary for robust and effective
policy. Data were collected from 355 randomly selected households. Alkire-Foster’s methodology
was used to assess households’ poverty and this was further decomposed. The majority of the
households lacked improved toilet facilities, sanitation, improved drinking water, nearness to
healthcare centres and primary schools, while most households engaged in self-medication.
About 7.9 percent were deprived in all the eleven indicators considered. The Multidimensional
Headcount Ratio (H) when cut-off (k) was set at 1/3 revealed that 69% of the households were
poor and its Intensity (A) was 65% while the Multidimensional Poverty Index (MPI), which is the
Adjusted Head Count Ratio (M0) revealed that an average household in the area was deprived
of 45% of the total potential deprivations it could experience. Decomposition by socioeconomic
characteristics revealed that the poverty rate was higher among female-headed households.
The same applied to households headed by divorced individuals, younger persons, farmers, less
educated individuals and larger households. When k=2/3, 44.2 percent of the households were
classified as poor with an “A” value of 0.416 and the MPI being 0.184. At k=1 the percentage of
poor households reduced significantly to 7.9 percent with an intensity value of 0.074 and MPI of
0.006. It is recommended that government should improve access to education, health care and
enforce various sanitation laws to improve households’ hygiene. Policies should also be geared
towards empowering households in order to escape poverty.
Keywords: Poverty; deprivation; households; multidimensional approach; Nigeria.
JED code: I32, O12.
Journal of Economics and Development
48
Vol. 20, No.1, April 2018
1. Introduction
poverty from the point of view of effective demands, needs and wants while the psychologist
may want to look at it from the standpoint of
deprivation, esteem and ego. From whatever
perspective poverty is viewed, it is obvious that
poverty is a condition of life that is extremely
degrading and likely to insult the dignity of the
people being afflicted.
Poverty has been a widely discussed topic by
governments and development agencies around
the world. Poverty reduction is a major goal
and issue for many international organizations
such as the World Bank, the United Nations,
UNICEF and UNESCO among several others.
Various studies have been conducted on poverty by researchers adopting different views or
definitions and methodologies as well. Most
of the research works on poverty are aimed at
understanding the static and dynamic nature of
poverty and to possibly proffer solutions. Relevant literature shows that there is no general
consensus on any meaningful definition of poverty, that is, there is no concise way of defining
the concept of poverty, as it is a multi-dimensional phenomenon that affects many aspects
of the human condition, ranging from physical to moral, to psychological and to political
(Ogwumike, 2002). However, poverty may be
viewed as the general dearth, scarcity or the
state of someone who lacks a certain amount of
material possessions, money or social capital.
It has been treated as a multifaceted concept,
which includes social, economic and political
elements.
Poverty is a worldwide phenomenon that affects continents, nations and peoples differently. It afflicts people in various depths, levels of
seriousness and at different times and phases of
their existence. There is no country that is absolutely free from poverty. The major difference
is in its intensity and prevalence. According to
USAID (2013), the vast majority of those in extreme poverty reside in South Asia, Sub-Saharan Africa, The West Indies, East Asia and the
Pacific while nearly half live in India and China alone. Nations in sub-Saharan Africa, South
Asia and Latin America have the highest level
of poverty and consequently have the lowest
level of socio-economic development. They
also have the highest level of social insecurity which may be due to joblessness, violence,
unrest and a generally unacceptable low standard of living coupled with a low level of the
social safety net (Oyebola, 2003). According to
the World Bank (2015), 702.1 million people
lived in extreme poverty around the world in
2015. This represented a noticeable reduction
compared with 1.75 billion in 1990. Out of the
702.1 million, about 347.1 million people were
said to be living in Sub-Saharan Africa (which
represented 35.2 percent of the population)
and 231.3 million lived in South Asia (about
13.5 percent of the population). It was reported
that from 1990 to 2015, the proportion of the
Furthermore, poverty may be described as
the lack of many resources, which possibly
leads to physical deprivation and hunger. It
includes lack of voice, power, and independence that subjects those afflicted to exploitation. Poverty among the people exposes them
to rudeness, inhumane treatment and humiliation by the private and the public agents of the
state from whom they usually seek help. Many
criteria have been used to perceive poverty.
An economist would approach the subject of
Journal of Economics and Development
49
Vol. 20, No.1, April 2018
It is however worthy of note that the HDI figures should not be compared with those of
previous reports due to the changing structural
background.
world’s population living in extreme poverty
fell from 37.1 percent to 9.6 percent, falling below 10 percent for the first time in history. This
may be due to the direct and indirect benefits
of the United Nations’ Millennium Development Goals (MDGs) which ended in December
2015.
Poverty reduction is undoubtedly one of the
highest-ranking items in the national development strategies in Nigeria and the most potent
issue in the current international development
agenda. This is reflected in the Millennium Development Goal (MDG) whose target was to
reduce the number of people living in poverty
by half by December 2015. This important goal
is also the first in the newly launched Sustainable Development Goals (SDGs) of the United
Nations whose aim is “to eradicate poverty in
all its forms everywhere by 2030”. The vision
statements of most bi-lateral and multilateral
donor agencies are related to poverty reduction. The policy papers of most developing
countries, for instance, the Nigeria National
Economic Empowerment and Development
Strategy (NEEDS), are directly linked to poverty reduction.
According to the World Bank (2013), about
90 percent of maternal deaths which occur
during childbirth happen in Asia and sub-Saharan Africa. This is quite high if compared
with the less than 1 percent that occurs in the
developed world. Poor people have also been
shown to have a far greater tendency of having
or incurring a disability in their lifetime (Global Policy, 2003)
Nigerian governments have at various times
embarked on programmes aimed at reducing
the incidence of poverty in the country. The
Nigerian poverty rate increased from 27.2 percent in 1980 to 46.3 percent in 1985 and 65.6
percent in 1996 (National Bureau of Statistics
NBS, 1996). There was a drop in the poverty
rate to 54.4% in 2004 (Nigeria Bureau of Statistics NBS, 2004). As at 2013, the World Bank
reported that the country’s poverty rate was
33 percent. Furthermore, the poverty report
released by the Human Development Report
showed Nigeria’s Human Development Index
(HDI) value for 2012 was 0.47, positioning the
country at 153 out of 187 countries and territories. The country’s HDI value for 2014 was
0.514, which placed Nigeria in the low human development level and at 152 out of 188
countries. Between 2005 and 2014, Nigeria’s
HDI value increased from 0.467 to 0.514, an
increase of 10.1 percent or an average annual
increase of about 1.07 percent (UNDP, 2015).
Journal of Economics and Development
Most of the poverty figures are purely money-metric. The money-metric measure of poverty has achieved tremendous progress over
the decades, but the well-being of a population, and hence, its poverty, which is a manifestation of insufficient well-being, depends
on both monetary and non-monetary variables.
The Human Development Report published by
the UNDP (2006) stated that a lack of income
only provides part of the picture in terms of the
many factors that impact on an individuals’ level of welfare e.g. longevity, good health, good
nutrition, education, etc. Therefore, a more
comprehensive measurement is required. The
technical difficulties of income measurement,
50
Vol. 20, No.1, April 2018
ences of deprivation which may include poor
health, lack of education and inadequate living
standard. In the light of the foregoing, there
is an urgent need to evolve a study aimed at
assessing poverty in Nigeria using the multidimensional approach. This is expected to give a
full description of the state of being poor and
chart a policy direction towards poverty reduction. To this end, this study sought to describe
the nature of deprivation among the sampled
households, to compute the multidimensional
poverty index of the households with varied
cut-off, to decompose according to household
socioeconomic characteristics and other relevant criteria and to draw meaningful conclusion and make useful recommendations.
especially in developing countries, have been
an important initiative for looking at other poverty measures which will be more effective to
eradicate poverty in the country.
It is common knowledge that, in Nigeria,
different governments have embarked on various forms of poverty reduction strategies. For
example, at independence in 1960, poverty
eradication efforts in Nigeria centred on education, while Operation Feed the Nation (OFN)
was launched in 1978. Others are The Green
Revolution in 1980, People’s Bank and Community Banks (now Microfinance Bank) —
whose main targets were/are to mobilize idle
funds and to aid capital formation and investment especially in the informal sector and rural areas—the Family Economic Advancement
Programme (FEAP) in 1995, the National Economic Empowerment and Development Programme NEEDS in 2003, the National Poverty
Eradication Programme (NAPEP), the Seven
Point Agenda in 2007 and the Transformation
Agenda in 2011etc. There have been several
interventions by groups such as NGOs, Ministries, Departments and Agencies among others
which may not be formally documented.
2. The concept of poverty
The choice of a definition of poverty will determine to some extent the number of people
classified as poor and the rate at which poverty
is perceived as being eliminated or alleviated.
If the absolute standard is chosen, rising real
living standards will push more people or families above the poverty line. It is only equalizing
the distribution of income that can eradicate
poverty under the relative measure of poverty.
According to Agola and Awange (2014), the
diversity of meanings attached to poverty renders conceptualization of poverty and its operational meaning and measurement difficult and
intractable.
There is a dire need to assess and measure
poverty in a way that will be effective in eradicating it. There are permanent challenges of
measuring poverty due to the lack of general
consensus on the definition of poverty. An income approach and an assets index approach,
among others, have been used to assess poverty; yet, most of them give no true, consistent
and concise definition of poverty. A multidimensional poverty measure provides an answer
to frequently asked questions on poverty measures since it constitutes several poor experiJournal of Economics and Development
Absolute poverty
Absolute poverty, destitution or extreme
poverty according to the United Nations (1995)
is a condition where there is severe deprivation
of basic human needs such as food, sanitation
facilities, safe drinking water, health, shelter,
education and information. Furthermore, it de51
Vol. 20, No.1, April 2018
majority of the population, as poor. This level
of deprivation is considerably out of line with
the general living standards enjoyed by the
majority of the people in such a society. It is a
measurement of the resources and living conditions of parts of the population in relation to
the economic status of other members of the
society. Relative poverty considers an individual’s economic and social status relative to the
rest of society. If people’s income and resources they possess are so insufficient to the extent
that it prevents them from having a standard of
living considered acceptable within the society
they live, they are said to be living in relative
poverty. Smith (1776) made it clear that “necessities” were determined by “custom” and
hence that poverty was relative. De Montauge
(1997) asserted that “poverty is measured by
comparisons.
pends not only on income but also on access to
services. Extreme poverty commonly refers to
earnings that are below the international poverty line of $1.25/day per person (in 2005 prices).
Meanwhile, in October 2015, the new poverty
threshold was reset to $1.90 a day after an extensive review of costs of living in a number of
countries. Absolute poverty is one of the concepts of poverty used in different ways to represent a poverty level which does not change
over time, in terms of the living standard that
it refers to. It stays the same even if society is
becoming more prosperous. Thus, the concept
of absolute poverty is understood as the minimum set of resources a person needs to survive
or to maintain a minimum standard of living.
Absolute poverty relates to the inability of the
individual to provide for him/herself the basic
needs like food, shelter, clothing, potable water, education, health services, public transport
etc. This type of poverty leads to deprivation.
It is the line below which existence becomes a
matter of acute deprivation, hunger, suffering
and premature death. Absolute poverty needs
immediate corrective actions by the government or those who it may concern to make appropriate policies to curb its incidence. In the
view of Sen (1983), poverty must be seen to be
primarily an “absolute notion”. In his words,
for instance, “if an individual is starving, he is
considered to be poor even if everyone else is
also starving”. However, once one moves away
from extreme cases it becomes much more difficult to make assertions that are comprehensively convincing.
ty
Economic development has traditionally
focused on the gap between the rich and the
poor countries and on ways that the process of
growth, especially in poor countries, could be
accelerated, with little or no attention given to
the gap between the rich and the poor people
in both the developed and developing countries
until recently. This very belated concern about
absolute poverty, relative poverty and income
distribution has possibly been promoted by
the realization that, even though development
occurs and per capita incomes grow, the numbers of poor people also increases (Agola and
Awange, 2014).
Relative poverty
The neoclassical paradigm recognized that
income inequality is necessary for growth and
efficiency. The neoclassical belief is that if the
A relative concept of poverty considers
those who are excessively worse off than the
Journal of Economics and Development
3. Theoretical literature relating to pover-
52
Vol. 20, No.1, April 2018
rate of growth in GNP is taken care of, poverty would be taken care of. Contrastingly, economic development reality clearly defies this
theoretical framework. Keynesian economics
posited that the use of taxes and subsidies for
redistributing income would reduce or even
eliminate poverty. The neoclassical approach
neglected the fact that differences in personal incomes seem too large to be explained by
differences in factor endowments alone among
several other issues.
productivity. But the radical theory also postulates that the class division in society and the
relative distribution among classes will affect
the distribution of individual income as well.
An individual’s class will, ultimately, affect
both his productivity, through the allocation
of social resources to invest in the workers of
his class and through the differential access of
different classes to different kinds of complementary capital, and his relative share of final
product’ (Gordon, 1972).
Looking at poverty from the Dual Labour
Market theory perspective, which is a clear
departure from the neoclassical orthodox assumptions, there exists a ‘primary’ sector in
which employment was stable, where pay was
good and where there were strong trade unions.
There is also a ‘secondary’ sector where employment was unstable and pay was low while
at the same time the prospects of promotion
was poor and unions had very little stake or
influence. Under this theory much emphasis
was placed on the disadvantageous characteristics of the secondary labour market just as
it is being placed on the characteristics of the
individuals holding jobs. However, because
the explanations provided by the Dual Labour
Market theory were considered inadequate by
scholars, new theories have been formulated.
The Radical Economic theory of poverty draws
greatly from the Marxist tradition, but according to Bosanquet and Doeringer (1973), it has
re-modelled Classical Marxism in response
to recent social and historical developments’.
Here, the market price of a product affects the
value of an individual’s marginal product as
in traditional theory. Supply and demand, reinforced by competition, affect an individual’s
The Functional theory of poverty posited
that in all societies there are different social positions or statuses which vary in pleasantness,
difficulty and functions to the society. Specific returns have to be associated with them in
order to guarantee that all positions are filled.
Therefore, inequality is necessary so that the
positions are filled. According to Gans (1972)
who looked at poverty from a sociological and
partly economic point of view, society has obsessed itself with the costs of poverty to the extent that it fails to appreciate the benefits. The
crux of Gans’ argument is that poverty has roles
to play in the functioning of a society. These
roles include: poor people being readily available to do all sorts of dangerous, undignified,
dirty and menial jobs; engaging in unprofessional jobs like drug peddling and prostitution;
purchase of damaged, stale and sub-standard
goods thereby prolonging or creating economic
usefulness for those goods; upholding the legitimacy of dominant norms; guaranteeing or
securing of the status of the non-poor; ensuring viability of non-economic groups such as
fund-raising and philanthropy, among several
others. Gans concluded that poverty could only
be eliminated when it either becomes effective-
Journal of Economics and Development
53
Vol. 20, No.1, April 2018
cludes the FGT measure which was developed
by Foster et al. (1984). This measure decomposes a class of poor people. It takes into account the headcount ratio or the incidence of
poverty, which is labelled Pα = 0. The depth of
poverty is the poverty gap ratio denoted by Pα
= 1. This gives the proportion of the average
poor from the poverty line and it can be used
to obtain the amount of resources needed by an
average poor person to escape poverty, thereby
eliminating absolute poverty. It has been said
that the measure is insensitive to redistribution
among the poor. A third measure, given as Pα
= 2 gives the severity of poverty and produces
the coefficientof variation of expenditure distribution of the poor, which reflects the degree of
inequality among the poor. Meanwhile Agola
and Awange (2014) posited that its monetary
values were difficult to interpret.
ly dysfunctional for the rich or when the poor
can obtain enough power to change the system
of social stratification.
Sen (1992) contended that traditional welfare economics, which emphasised the revealed
preferences utilities of individuals in their acts
of choice, lack enough information about people’s preferences to assess the social good. As a
panacea, Sen’s welfare theory relies on individuals’ capability, not on individuals’ attainments
of basic needs. It was asserted that living consists of a vector of interrelated functioning (beings and doings), for instance, being well nourished, avoiding infant mortality, being happy,
appearing in public without shame etc. According to Agola and Awange (2014), it is unfortunate that Sen did not assign particular weights
to these functionalities, because, “well-being”
is not a clear concept. As far as Sen was concerned, poverty was not low well-being but the
inability to pursue well-being because of the
lack of economic means. This lack may not always result from a deficiency of capabilities.
Therefore, poverty is the failure of basic capabilities to reach minimally acceptable levels. In
conclusion, most economic theories have not
been able to comprehensively and effectively
explain the phenomenon of poverty.
Several poverty measures have been proposed in the literature, which are sensitive to
income inequality among the poor. The Sen’s
Measure of Poverty gives the severity of poverty and reduces the co-efficient of variation of
expenditure distribution of the poor, which reflects the degree of inequality among the poor.
The Sen (1976) measure incorporates the number of poor, the poverty-gap and the transfer of
income from the not so poor to a poorer person
into his measure. Fishlow’s Measure of Poverty
expresses the poverty gap as a function of the
income of the non-poor required to eliminate
poverty. A variant of the FGT measure (Pα) was
given by Ray (1989) and it combines additive
decomposability with poverty aversion. The
combination of FGT and Clark et al. (1981)
criteria is expressed as the Additive Decomposability and Aversion Monotonicity Axiom.
4. Measurements of poverty
The story of the development of poverty measures can be viewed as three historical
stages. First, from 1892 and lasting for more
than half a century was the headcount ratio of
poverty measurement spearheaded by Booth
(1892) and made popular by Rowntree (1901).
According to Agola and Awange (2014) the
head count ratio did not tell how far below the
poverty line the poor are. The second stage inJournal of Economics and Development
54
Vol. 20, No.1, April 2018
state consists of 33 Local Government Areas
(LGAs). The State covers a land area of 27,249
square kilometres which is about 42 percent
of the landmass of the south-western part of
the country and it is bordered in the north by
Kwara State, in the south by Ogun State, in the
west, by Ogun State and the Republic of Benin,
while it is bounded in the East by Osun State.
The state has a population of about 4 million
people (2006, Population Census)
It can be deduced that measurement of poverty is quite an important exercise as it provides
a metric to measure progress towards poverty
alleviation/eradication. However, the problem
of arriving at a good measurement methodology is very much linked to the problems of
definition of poverty. It is worthy of note that
poverty alleviation approaches tend to put
emphasis on different dimensions of poverty.
There is general agreement that money income
(or consumption) on its own is an imperfect
measure of welfare. There are different views
about the relative importance of non-monetary variables. While poverty can be broadly
defined as an absence of well-being or capacities, it is multidimensional and manifests itself
in various forms. This makes the definition of
poverty inadequate if only one criterion is used.
It should also be recognized that there is no single indicator that can adequately measure all
dimensions of poverty. This justifies the use of
a multidimensional approach for poverty measurement.
5.2. Sampling techniques and sample size
method of data collection
A multi-stage sampling technique was used
to select households for the study. The first
stage involved a random selection of five out
of the eleven Local Government Areas (LGAs)
in Ibadan metropolis. Therefore, Ido, Ibadan
North, Ibadan South-East, Lagelu and Akinyele LGAs were selected. The second stage involved the random selection of ten villages/
wards from each of the LGAs. In the third
stage, eight households were randomly selected from each ward/village/streets giving a total
of 400 households. The total number of questionnaires used for analysis (355) represented
about 89 percent of the total number of questionnaires administered as 45 (representing
about 11 percent) of the questionnaire were discarded due to incompleteness and dominance
of visible outliers in the information given. Personal interviews were used to collect data from
respondents using structured questionnaires
as an interview guide. Data were collected on
socio-economic characteristics such as the age
structure of the households, educational level,
assets holding, income, occupations, types of
house, sources of drinking water, health status,
access to healthcare, health seeking behaviour
5. Methodology
5.1. Study area
The study was carried out in Oyo state, located in the South-West geopolitical zone of Nigeria. The state was one of the three States carved
out of the former Western State of Nigeria in
1976 by the then Federal Military Government.
The choice of Oyo state stemmed from the fact
that it used to be the regional capital of Western Nigeria. By implication, the state consists
of people from all states in the region and Nigeria at large. The Western region itself drives
the Nigerian economy as over 60 percent of
the economic activities in Nigeria take place in
the South-Western region of the country. Oyo
Journal of Economics and Development
55
Vol. 20, No.1, April 2018
and general living conditions etc.
international comparable poverty metric designed to measure acute poverty. Acute poverty
refers to people living under conditions where
they do not reach the minimum internationally
agreed standards in indicators of basic functioning. It measures those experiencing multiple deprivations, people who for example,
are both undernourished and do not have clean
drinking water, adequate sanitation or clean
fuel etc. This study applied Alkire and Foster’s
5.3. Method of data analysis
5.3.1. Descriptive statistics
Frequency and percentage were used to describe the socio economic characteristics and
living conditions of households.
5.3.2. The Multidimensional Poverty Index
(MPI)
The Multidimensional Poverty Index is an
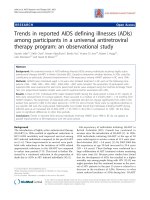
Table 1: The MPI-dimensions, indicators’ threshold and weights
Dimensions
Indicators
Deprivation cut-off marks
if there is no health centre around the
household (within 5 km distance)
ଵ
Health
1.Nearness to health centre ቀ ቁ
ଵ
ଽ
ଵ
2.Diet ቀ ቁ
ଷ
if household does not have food at
home for at least one week in the last
three months
ଽ
if household does self-medication and
patronise non-orthodox healing centres
ଵ
3.Health seeking behaviour ቀ ቁ
Education
ଵ
ଷ
ଵ
1.Years of Schooling ቀ ቁ
ଽ
if household head does not have at least
12 years of schooling
ଵ
2.Nearness to public primary school ቀ ቁ
ଵ
1.Access to electricity ቀ ቁ
ଵ
ଵ଼
2.Households floors ቀ ቁ
ଵ଼
Standards of
ଵ
Living
ଷ
ଵ
3.Access to safe drinking water ቀ ቁ
ଵ
4.Types of toilet ቀ ቁ
ଵ଼
ଵ଼
if public primary school is ≥5km away
if household is not connected to the
public power supply
if household uses cow dung or bare
mud/clay as floor or stays in a dirty
environment
if household uses well or surface water
as sources of drinking water
if household uses pit-latrine, bucket or
has no toilet facilities.
if household does not possess at least 5
of the total common assets listed
if
household
uses
unclean
ଵ
/environmentally unfriendly methods
6.Cooking fuel ቀ ቁ
ଵ଼
such as wood and charcoal as cooking
fuel
Source: Adapted from Alkire and Foster (2011) but modified to suit Nigerian situation.
ଵ
5.Assets holding ቀ ቁ
ଵ଼
Journal of Economics and Development
56
Vol. 20, No.1, April 2018
al deprivation P for each household is defined
as the weighted sum of deprivations such that
(2007, 2011) approach to determine the level
of deprivation among households surveyed.
Therefore, a dual-cut-off method of identification was employed. This involved two steps
which were the identification and aggregation
methods. The identification method was used
to identify various deprivations suffered among
households and it involves setting a cut off for
the various deprivations which was the first
cut-off and also setting a poverty cut-off, which
was the second cut-off and hence it is called the
dual cut-off. If deprivation exceeds the poverty
cut-off such household was considered as poor.
Pi =
i =1
The next step was to assign a deprivation
score for each household according to their
deprivations, which is the aggregated deprivation, and this was done by taking the weighted sum so that the deprivation score for each
household lies between 0 and 1. The score increases as the number of deprivations of the
household increases and reaches its maximum
of 1 when the household is deprived in all component indicators. A household that is not deprived in any indicator receives a score equal
to zero.
5.3.3. Multidimensional Poverty Measure
Table 1 was adapted from Alkire and Foster
(2011) and slightly modified as appropriate to
suit the socioeconomic setting being studied
(South-west Nigeria in this case). It shows the
dimensions and indicators that were used in
the study as well as their various deprivation
cut-off and weights assigned to each indicator.
Therefore, the study started with evaluation of
the achievement of the households in which
individuals live to determine if there exists a
deprivation in any of the above-mentioned
indicators. Assuming xi is the achievement of
each household i in each indicator andziisthe
deprivation cut off. A household is considered
deprived if its level of achievement is below the
deprivation cut-off i.e. xi < zi. Following Alkire
and Foster (2011) the study assumes positive or
negative externalities within the household in
such a way that if one of the household members is malnourished, all the household members are considered malnourished.
A second cut-off or threshold is used to
identify the multi-dimensionally poor, which
in the Alkire-Foster methodology is called the
poverty cut-off. For the analysis of this study
it is assumed that the poverty cut-off k = 1/3,
although, for the purpose of exposition and
comparison, the k value was varied and multidimensional poverty was reassessed in each
case.
In the light of the above, a household was
considered poor if its deprivation score was
equal or greater than the poverty cut-off. Formally, in the MPI, a household is identified as
poor if the deprivation score is higher than or
equal to 1/3. For those whose deprivation score
is below the poverty cut-off, even if it is non-zero, this is replaced by a “0”; and this is referred
to ascensoring in poverty measurement. To
differentiate between the original deprivation
score from the censored score, the censored
deprivation score with the notation Pi(k) was
used. Note that when Pi ≥ k , then Pi(k)=Pi, but
if Pi< k, then Pi( k)= 0. Pi(k) is the deprivation
Each dimension receives equal relative
weight wi and is evenly distributed among the
indicators of each dimension. MultidimensionJournal of Economics and Development
d
∑Wi = 1
57
Vol. 20, No.1, April 2018
had good toilet facilities. Similarly, the majority (56.1 percent) of the sampled households
got their drinking water from deep wells while
only 23 percent of the households had access to
water from boreholes. About 36 percent of the
households use kerosene as a source of cooking
fuel, though only a few households (11 percent)
were not connected to the public power supply
(Table 3).
score of the poor.
The computation of the multidimensional
headcount ratio (H) to show the proportion of
households who experience multiple deprivaq
tion is given by H= n . where q is the number of households that are multi-dimensionally poor and n represents the total population.
The intensity (or depth) of poverty within the
household, which is the average deprivation
scores (A) of households that are multi-dimensionally poor, was determined by:
Other welfare indices
The results in Table 4 showed that close to 30
percent of the households engaged in self-medication in treating their various illnesses. Only
14 percent attended government hospitals and
the major reason for this was the long distance
from their houses to government health facilities. A majority (63.1 percent) of the households did not have health centres around their
houses. A majority of the children attend public
schools, although most of the public schools
were built far away from their houses, while
39 percent of the households had access to
credit facilities which were acquired mostly
throughthe trading groups they belong to, such
as farmers’ and multi-purpose cooperative societies (Table 4).
∑ i=1Pi (k )
n
A=
q
Therefore, the multidimensional poverty index is given as:
MPI= H×A.
6. Results and discussion
6.1. Socio-economic characteristics of
households
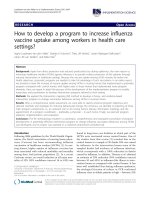
Table 2 presents the socioeconomic characteristics of the sampled households. It was revealed that 68.2 percent of the sampled households were headed by males. About 71 percent
of the household heads were within the ages
of 40 and 60 years while the majority (79.2
percent) were married. Over 40 percent of the
households had post-secondary school education and over 70 percent of the households had
more than four people in their household with a
mean value of five.
6.2. Incidence of deprivation
Table 5 shows the incidence of deprivation
among the households in the study area. Results indicated that the three (3) most occurring
deprivations households suffered were lack of
possession of at least five (5) out of the common assets listed (78 percent), lack of acceptable toilet (72.3 percent) and lack of nearness
to health care facilities (72 percent). The inability of households to accumulate assets may encourage poverty because assets can be used as
collateral to obtain a loan which may be invest-
Living conditions of households
A fair proportion (42 percent) of the sampled households live in multi-tenanted (faceto-face) houses and the most common flooring
materials used for these houses (48.2 percent)
was concrete while about 30 percent used tiles.
Only 25.9 percent of the sampled households
Journal of Economics and Development
58
Vol. 20, No.1, April 2018
Table 2: Socio economic characteristics of households
Variables
Gender
Male
Female
Marital status
Single
Married
Separated
Widow/Widower
Age
< or =30
31-40
41-50
51-60
61-70
Above 70 years
Mean=42
Occupation
Farming
Trading
Civil servant
Others
Educational level
No formal education
Primary education
Secondary education
NCE/OND
HND/BSc
MSc/PhD
Household sizes
>=2
3–4
5-6
7-8
Above 8
Mean=5
Source: Field survey, 2015.
Frequency
Percentage %
242
113
68.2
31.8
11
281
39
24
3.1
79.2
11.0
6.8
19
78
91
87
49
31
5.4
22.0
25.6
24.5
13.8
8.7
50
128
103
74
14.1
36.1
29.0
20.8
34
72
93
64
71
21
9.6
20.3
26.2
18.0
20.0
5.9
31
73
107
77
67
8.7
20.6
30.1
21.7
18.9
ed to generate income, improve livelihood and
reduce poverty aside from streams of income
some assets could generate directly. Carter and
Barret (2006) asserted that assets can give an
insight into the poverty structure of households.
over-filled and partially collapsing pit latrines
which are common in some households in the
study area portends danger to the health and
safety of the people. Various toilet diseases can
be contracted and spread under such conditions. The health risk therefore is serious con-
The use of unacceptable toilets such as dirty,
Journal of Economics and Development
59
Vol. 20, No.1, April 2018
Table 3: Distribution of households by living conditions
Variables
Types of house
Face-to-face
Boys quarter
Flat
Duplex
Mansion
Types of floors
Concrete
Tiles
Marble
Terrazzo
Clay/Sand
Wood
Source of drinking water
Borehole
Deep Well
Surface water
Types of toilet
Pit latrine
Water closet
No facilities
Others
Types of cooking fuel
Electricity
Gas
Kerosene
Charcoal/sawdust
Wood
Access to power supply
No
Yes
Source: Field survey, 2015.
Frequencies
Percentage
149
85
109
8
6
42.0
23.9
30.7
2.3
1.7
171
104
21
29
27
3
48.2
29.3
5.9
8.2
7.6
0.8
85
199
71
23.9
56.1
20.0
220
92
36
7
62.0
25.9
10.1
2.0
14
92
128
47
78
3.9
25.9
36.1
13.2
22.0
39
316
11.0
89.0
access to healthcare facilities in the study area.
sidering the discovery that healthcare facilities
were far away from most households, thereby
limiting access to good health care. Lack of access to health-care facilities was the third most
frequent deprivation. Amatyr Sen’s capability
theory of human welfare asserted that functioning (health) and capability were the two main
components of human welfare. Therefore, human welfare is made worse off due to lack of
Journal of Economics and Development
6.3. Deprivation count
Table 6 reveals that only 21 households representing 5.91 percent of the total number of
households were deprived in only one out of
the eleven (11) deprivations, while 7.9 percent
were deprived in all the eleven indicators considered for the study. The majority of the house60
Vol. 20, No.1, April 2018
Table 4: Other welfare indices of households
Variables
Frequencies
Percentage
135
51
71
98
38.0
14.4
20.0
27.6
243
112
68.5
31.5
139
216
39.2
60.8
224
131
63.1
36.9
Health seeking behaviour
Private hospitals
Public hospitals
Traditional/orthodox healing centre
Self medication
Schools attended by children
Public school
Private school
Access to credit facility
Yes
No
Nearness of household to health centres
Yes
No
Source: Field survey, 2015.
were deprived in a noticeable number of indicators.
holds were deprived in between three (3) and
nine (9) deprivations out of the eleven deprivations considered. For instance, 13.24 percent of
6.4. Identification of the poor under varied
cut-off
the households were deprived in three (3) indicators while 11 percent were deprived in eight
It would be recalled that the eleven indicators of deprivation were grouped into three (3)
(8) of the listed indicators. Hence, the majority
Table 5: Incidence of deprivation
Deprivation
Nearness to Health Centre
Diet sufficiency
Access to healthcare
Years of Schooling
Nearness to primary school
Access to electricity
Acceptable material for flooring
Access to safe drinking water
Use of acceptable toilet
Possession of at least five of the total assets listed
Cooking fuel (use of clean/ environmentally friendly method
Source: Computed from Field Survey Data, 2015.
Journal of Economics and Development
61
Number of households
Percent
257
227
170
128
185
50
121
227
258
277
122
72.0
64.0
47.9
36.1
52.1
14.1
34.1
64.0
72.3
78.0
34.4
Vol. 20, No.1, April 2018
Table 6: Distribution of deprivation count
Count
Number of households
1
21
2
43
3
47
4
31
5
27
6
25
7
31
8
39
9
37
10
26
11
28
Source: Computed from Field Survey Data, 2015.
Percent
5.91
12.11
13.24
8.73
7.61
7.04
8.73
11.00
10.42
7.32
7.90
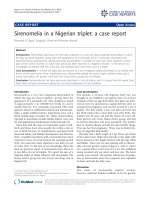
Multidimensional poverty estimation in this
study was based on three dimensions, which
were Health, Education and Standard of living
of the households. From the results, it was revealed that when k was set at 1/3, sixty-nine (69)
percent of the households were in acute poverty as revealed by the head count ratio (Table 8).
They were deprived in at least either all the indicators of a single dimension, or a combination
of indicators across dimensions, such as living
in a household with clay floor, no good toilet,
dirty floor and unclean sources of drinking water. The percentage of the poor reported in this
study was far higher than those reported by previous studies carried out in the same region us-
groups, namely health, education and standard
of living, with each group having a weight of
1
/3 out of a weighted score of one (1). When the
poverty cut-off was set at k = 1/3, 69 percent of
the households were identified as poor. Expectedly, when k was set at 2/3, the number of poor
households decreased to 157, representing 44.2
percent of the total households sampled. Furthermore, 7.9 percent of the households were
identified as poor when k was set at 3/3, i.e 1.
Under this last scenario, a household must be
deprived in all the listed indicators to be qualified as “poor”.
6.5. The MPI: Adjusting the headcount ratio by intensity
Table 7: Identification when cut-off is varied
Cut-off K
Number of households
1
3
2
3
3
3
Source: Computed from Field Survey Data, 2015.
Journal of Economics and Development
Percent
245
69.0
157
44.2
28
7.90
62
Vol. 20, No.1, April 2018
Table 8: Multidimensional Poverty at varied cut-off
Count
1
3
2
3
Head Count
(H) =
Poverty Intensity
�
�
(A) =
∑�
��� �����
�
MPI (Mo) = H*A
0.690
0.650
0.450
0.442
0.416
0.184
0.074
0.006
3
0.079
3
Source: Computed from Field Survey Data, 2015.
ing the money-metric method of Foster, Greer
and Thorbeck’s (FGT) index. For instance, Akerele and Adewuyi (2011) reported 38 percent
in Ekiti State; Olawuyi and Adetunji(2013)
reported 45 percent among rural households
in Ogbomoso agricultural Zone in Oyo State;
Adebayo (2013) reported 36 percent among
households in Irewole Local Government Area
of Osun State, while Akinbode (2013) reported
34 percent, all in south-west Nigeria. The relatively higher percentage reported in this study
may be due to the robustness and the perceived
superiority of the multidimensional approach.
65 percent of the weighted indicators. This
was revealed by the intensity of poverty (A),
which was 65 percent. The 69 percent figure
is “adjusted” by the intensity of poverty, and
that is why the MPI is what Alkire and Foster
(2007, 2011) called the Adjusted Headcount
Ratio. However, because they (69 percent of
the households) were on the average deprived
in 65 percent of the weighted indicators, the average household in the study area can be said
to be deprived in 45 percent (MPI) of the total
potential deprivations it could experience overall (Table 8).
Furthermore, Table 4 shows that the average
poor household in the study area was deprived
in 65 percent of the weighted indicators. The
MPI represents the share of the population that
is multi-dimensionally poor, adjusted by the
intensity of the deprivation suffered. This adjustment is necessary because if only the Head
Count Ratio (H) was considered, it merely
shows that 69 percent of the population were
poor. Meanwhile, they were not equally poor
and they were not deprived in 100 percent of
all the deprivations considered. The average
poor household in this study was deprived in
Furthermore, when k was set at 2/3, the head
count ratio (H) was 0.442 with a poverty intensity (A) value of 0.416 and MPI of 0.184.
Under this scenario, it can be summarized that
average household in the sample were deprived
in 18.4 percent (multidimensional poverty) of
the total potential deprivation it could suffer.
Furthermore, when k was set at 3/3, i.e 1, MPI
was 0.006, which implied that under such a
scenario the average household was deprived
in 0.6 percent of the total potential deprivations
it could suffer. The value of H=0.079 implied
that 7.9 percent of the sampled households
Journal of Economics and Development
63
Vol. 20, No.1, April 2018
were classified as poor (Table 8). The falling
indices and incidence of poverty with an increasing value of k as observed in this study is
in line with the findings of Adeoti and Popoola
(2012) in a study of multidimensional poverty
of rural children in Nigeria.
= 1/3. It was revealed that the poverty head count
was higher (81 percent) among female-headed
households compared with male-headed households’ head count of 62 percent. This finding
supports the concept of feminization of poverty
where it has been widely believed that females
and female-headed households are likely to be
poorer than their male counterpart, partly due
to limited access to productive resources such
as land and credit among other sociocultural
constraints limiting the potentials of the female
folks.
6.6. Poverty profile by households’ socioeconomic characteristics
Table 9 shows the breakdown of incidence
and depth of poverty by households’ socioeconomic characteristics. It is worthy of note that
the breakdown carried out here was based on k
Table 9: Poverty profile of households by socioeconomic characteristic at K=1/3
Head Count (H)
Gender of household head
Male
0.62
Female
0.81
Marital status of household head
Married
0.61
Single
0.76
Divorced/Separated
0.73
Age of household head
≤40
0.80
41 – 60
0.57
Above 60
0.45
Occupation of household head
Farming
0.83
Trading
0.62
Civil Service
0.51
Private Company workers
0.54
Artisans/Self Employed
0.56
Educational Level
No Formal Education
0.85
Primary School
0.74
Secondary School
0.68
Higher Institution
0.42
Household Size
≤4
0.58
5-8
0.77
Above 8
0.83
Source: Computed from Field Survey Data, 2015.
Journal of Economics and Development
64
Poverty Intensity (P)
MPI =H*A
0.58
0.76
0.36
0.61
0.57
0.71
0.68
0.35
0.54
0.48
0.75
0.53
0.42
0.60
0.30
0.19
0.77
0.58
0.48
0.51
0.53
0.64
0.36
0.24
0.27
0.30
0.80
0.70
0.64
0.40
0.68
0.52
0.44
0.17
0.55
0.73
0.78
0.32
0.56
0.65
Vol. 20, No.1, April 2018
In addition, poverty incidence reduced with
increased education (Table 9). This underscored
the importance of human capital development
through education as a means of reducing poverty. Educated individuals are better positioned
to get better paying jobs and are likely to live
within an acceptable lifestyle. Finally, poverty
increased with increased household size (Table
9). This confirms that a high dependency ratio
puts pressure on household resources, thereby increasing the incidence of poverty among
households.
In terms of the marital status of household
heads, households headed by married people
were less poor (61 percent) compared with
those headed by single (73 percent) and divorced/separated among whom 76 percent of
the households were classified as poor. It is a
common practice for married couples to pool
resources together to acquire assets and for investment which may take the household out of
poverty. The foregoing is almost not possible
for single and divorced individuals.
Furthermore, poverty indices (head count,
intensity and MPI) reduced with increased age
of the household head. This may be interpreted
that older household were less poor compared
with younger households. It is likely that older households have more income generating
investments, assets/properties and might be
enjoying remittances from their children living and working elsewhere. Younger households are likely to have a number of children
in primary and secondary schools for which
they carry some responsibility, including the
struggles to acquire property like houses, farmlands and vehicles among several others which
weigh heavily on their often limited resources.
Households headed by farmers had the highest
poverty incidence (83 percent) compared with
those headed by people engaged in other occupations. Poverty being endemic among farmers
was a mirror to the underdeveloped level of agriculture in Nigeria. The majority of Nigerian
farmers are poor due to lack of access to credit,
land tenure problems, lack of storage facilities
for agricultural output, which usually results in
high postharvest losses, lack of mechanization,
unstable prices and sometimes unfavourable
government policies.
Journal of Economics and Development
7. Conclusion and recommendation
Based on the findings of this study, it can be
concluded that the majority of the households
in the study area were multi-dimensionally
poor, even with varying cut-offs. They lived in
conditions that depicted poverty. Most of the
households lived in multi-tenanted (face-toface roomed) houses and used pit latrine toilet
facilities. The majority of the households had
access to electricity but lacked a good source of
drinking water and used unclean fuel sources
such as charcoal, firewood, sawdust and kerosene stoves and the environmental implication of these may be far reaching. The possible
negative effect may include deforestation, erosion, loss of the air purifying function of forest trees etc. Health-care centres and primary
schools were far from most households. Households patronize medicine shops and engaged in
self-medication for treatment of their various
illnesses. Most households use concrete floors,
although a noticeable number still use ordinary
clay/mud and sand as their flooring material
and live in a dirty environment.
A breakdown of poverty by households’
socioeconomic characteristics revealed that
65
Vol. 20, No.1, April 2018
towards: encouraging schooling (by building
schools in the neighbourhood of new settlements in major cities in the region), making
available free or highly subsidized family
planning (to avoid large household size), the
diversification of income sources (in order to
improve household incomes), ensuring that
existing environmental and sanitation laws are
enforced in order to promote good hygiene,
and adoption of improved toilet and waste disposal practices. Furthermore, government may
help in financing the construction and running
of community health centres in the area while
appropriate health enlightenment is embarked
upon in order to improve the health-seeking behaviour of the people.
female-headed households were poorer than
male-headed households. Married households
were less poor compared with single and divorced household heads. The older the household heads the lower the incidence of poverty among the households. It is worthy of note
that poverty was higher and more pronounced
among households headed by farmers compared with those headed by individuals engaged
in other occupations. Poverty reduced with an
increased educational level of household heads
while the poverty incidence increased with increased household size.
Based on the findings of this study, it is recommended that government policies be geared
References
Adebayo, O.O. (2013), ‘Analysis of poverty level among urban households in Irewole local Government
area of OsunState’, Global Journal of Arts Humanities and Social Sciences, 1(1), 13-19.
Adeoti A and Popoola O (2012), ‘Determinants of Child Poverty in Rural Nigeria: A Multidimensional
Approach’, Global Journal of Human Social Science, Arts and Humanities, 12(12), 38-54.
Agola, N.O and Awange, J.L. (2014), Globalized Poverty and Environment – 21st Century Challenged and
Innovative Solution, Springer, New York.
Alkire, S. and Foster, J. (2007), ‘Counting and Multidimensional Poverty Measurement’, Oxford Poverty
and Human Development Initiative, Working Paper No. 7, Oxford Department of International
Development, University of Oxford.
Alkire, S. and Foster, J. (2011), ‘Counting and Multidimensional Poverty Measurement’ Journal of Public
Economics, 95(7-8), 476-487.
Akerele, D and Adewuyi S.A. (2011), ‘Analysis of Poverty Profiles and Socioeconomic Determinants
of Welfare among Urban Households of Ekiti State, Nigeria’, Current Research Journal of Social
Sciences, 3(1), 1-7.
Akinbode, S.O. (2013), ‘Profile and Determinant of Poverty among Urban Household in South-West
Nigeria’, American Journals of Economics, 3(6), 322-329.
Booth, C. (1892), Life and labour of the people of London, Macmillan, London
Bosanquet, N. and Doeringer, P. (1973), ‘Is there a dual labour market in Britain?’, Economics Journal, 83,
421–435.
Carter, M.R. and Barrett, C.B. (2006), ‘The Economics of Poverty Traps and Persistent Poverty: An Asset‐
Based Approach’, Journal of Development Studies, 42(2), 178‐199.
Clark, S., Hemming, R. and Ulph, D. (1981), ‘On indices for the measurement of poverty’, Economics
Journal, 91, 515–526.
Journal of Economics and Development
66
Vol. 20, No.1, April 2018
De Montauge, T. (1997), Peasants into Frenchmen: the modernization of rural France, 1870 – 1914, Chatto
and Windus, London.
Foster, J., Greer, J. andThorbecke, E. (1984),‘A class of decomposable poverty measures’, Econometrica,
52, 761–766.
Gans, H. (1972), ‘The positive functions of poverty in society’, American Journal of Sociology, 78(2),
192–197.
Global Policy (2003), ‘Economic costs of AIDS’, Globalpolicy.org, Retrieved 24 October 2015.
Gordon, D.M. (1972), Theories of poverty and underemployment, Lexington Books, Lexington
National Bureau of Statistics NBS (2004), Socio-economic survey on Nigeria, Abuja.
National Bureau of Statistics NBS (1996), Social Statistics in Nigeria, Federal Republic of Nigeria.
Ogwumike, F. O. (2002), ‘Concept, Measurement and Nature of Poverty in Nigeria’, Paper Presented at
National PRSP Empowerment Workshop, Kaduna (July) 2002.
Olawuyi,S. O. and Adetunji, M. O. (2013), ‘Assessment of Rural Households Poverty in Nigeria: Evidence
from Ogbomoso Agricultural Zone of Oyo State, Nigeria’, Journal of Scientific Research and Reports,
2(1), 35-45.
Oyebola, E.O. (2003), ‘An Assessment of Poverty Reduction in Nigeria: Dissertation for the award’, Doctor
of Philosophy (Management), St.Clement University.
Ray, R. (1989), ‘A new class of decomposable poverty measures’, Indian Economic Journal, 36(4), 30–38.
Rowntree B.S (1901), Poverty: A study of town life, Macmillan, London.
Sen, A.K. (1976), ‘Poverty: An ordinal approach to measurement’, Econometrica, 44, 219–231.
Sen, A.K. (1992), Inequality re-examined, Harvard University Press, Cambridge.
Sen, A.K (1983), ‘Poor, relatively speaking’, Oxford Economics Paper, 35,153–169.
Smith, A. (1776), The Wealth of Nations, Book 5, Chapter 2 Part II, Methuen&Co., Ltd. London.
United Nations (1995), Report of the World Summit for Social Development, March 6–12, 1995.
UNDP (2015), Human Development Report 2015, Retrieved from www.hdr.undp.org.
UNDP (2006), Human Development Report 2006, Retrieved from www.hdr.undp.org.
USAID (2013), Getting to Zero: USAID Discussion Paper, November 21st, 2013.
World Bank (2015), Global Monitoring Report: Development Goals in an Era ofDemographic Change,
www.worldbank.org/gmr, Retrieved 4 Nov 2015.
World Bank (2013), ‘Disability - Disability: Overview’, worldbank.org, Retrieved 28 February 2016.
Journal of Economics and Development
67
Vol. 20, No.1, April 2018