Vocation education quality from demand side’s perspective, the case of transport technology universities in the north of Vietnam
Bạn đang xem bản rút gọn của tài liệu. Xem và tải ngay bản đầy đủ của tài liệu tại đây (655.41 KB, 10 trang )
VOCATION EDUCATION QUALITY FROM DEMAND SIDE’S
PERSPECTIVE, THE CASE OF TRANSPORT TECHNOLOGY
UNIVERSITIES IN THE NORTH OF VIETNAM
Nguyen Quynh Hoa
Email:
National Economics University
Phung Chu Hoang
Email:
University of Transport Technology
Abstract
Quality outcomes from vocational education and training (VET) are fundamental to
ensuring a skilled workforce and supporting a productive economy. The quality of
vocational training from the demand‟s perspective is defined as as meeting the customer
specification, needs or requirements. Using the method of Exploratory Factor Analysis –
EFA and Multiple Regression Analysis to get the analytical results of 275 respondents as
graduates of University of Transport and Communication, University of Transport
Technology (the two universities training on transportation in the North of Vietnam). The
results show that factors are measured by the observed variables in the study that ensure
reliability and relevance. The descriptive statistics result of vocational training quality is
3.28, at a quite low level, while all independent variables are at average level (between 3.1
to 3.48) with the highest value related to the quality of the teacher and the lowest are
facilities and training programs and management capacity of university. However, the
regression results show that the qualification of the teacher, material facilities and
training program, management capacity and job opportunities at the training school do
not affect the quality of the training while "Learners - NH" have a great positive effect and
the labor market information has a negative effect on the training quality of the school
significantly. Base on those data, some policy recommendations have been given out in
order to improve the training quality of transport technology universities in the north of
Vietnam in particular and the vocational training quality of Vietnam in general.
1. Introduction
Assuring the quality and relevance of vocational education and training (VET) has
become a more important and challenging task as today's labor markets change faster than
ever. If learning doesn‘t lead to satisfactory outcomes, everyone loses: learners, employers
and society at large. This is what stirs up the field of quality assurance in VET. Harvey and
Green (1993) explore the nature and usage of quality in relation to higher education and
point out that quality is a relative concept. Harvey (2006) provides some definitions of
quality such as: quality as perfection sees quality as a consistent or flawless outcome;
Quality as fitness for purpose sees quality in terms of fulfilling a customer‘s requirements,
needs or desires; Quality as value for money sees quality in terms of return on investment.
532
Another perspective on the concept is offered by Cheng (2001), in which he proceeds to
identify three paradigm shifts in quality improvement in education: (i) internal quality
assurance, which ‗makes an effort to improve internal school performance, particularly the
methods and processes of teaching and learning‘; (ii) interface quality assurance, which
emphasizes ‗organizational effectiveness, stakeholders‘ satisfaction and market competitiveness
and makes an effort to ensure satisfaction and accountability to the internal and external
stakeholder; (iii) future quality assurance, which is defined ‗in terms of relevance to the new
school functions in the new century as well as relevance to the new paradigm of education
concerning contextualized multiple intelligences, globalization, localization and individualization.
Although quality assurance (QA) processes in VET and Higher Education are based on similar
principles that can be seen from the supply side‘s perspective (internal quality insurance or
quality as value for money) or demand side‘s perspective (quality as fitness for purpose,
interface quality assurance). However, there are some differences to be noted. QA in VET is
required to provide stronger evidence that product (competent graduate) fits for purpose (needs
of the industry) (Marko Savic, 2016). Therefore, training providers are expected to ensure high
level of readiness of their graduates for the employment.
Ministry of Education in Vietnam states the importance of quality human capital as
the major pre-requisite for the sustainable development of the country. Thus, improving the
quality of training is the first priority of universities in Vietnam. There are many researches
on this field in the recent years such as Pham Vu Phi Ho and Nim Ngoc Yen (2017); Son
Trinh Van, et.al. (2016), Nguyen Hoang Lan. et.al. (2015), however, most of them focus
on the quality of university‘s training from the perspective of employers and the case
studies were not vocational training. In addition, in 2013, Government has approved the
strategy for development of vocational training stage 2011 - 2020, in which nominated
Ministry of Labor - Invalid and Social Affairs to submit for government approval of the
project ―Basically and comprehensive innovation of vocational training‖ towards 2020 in
order to upgrade a skilled workforce to meet the demands for development of industries
and contribute to the improvement of nation‘s productivity and competitiveness, however,
the recent Labor survey results show that when Transport graduates enter the job market,
most of them are unaware of the employment reality. They are either shocked or
unprepared to adapt to the working environment or find it difficult to cope with their job
responsibilities. Thus, improving the quality of vocational training in transport sector is
necessary. To date, there are 10 public universities or Public Institutions of Higher
Education (PIHE) related to transportation belong to ministry of transport of Vietnam
(MOE, 2014a & 2014b), nevertheless, there are no research on quality of vocational
training in this field especially research on external assessment of training quality. This
paper will conduct the evaluation of quality training in transport sector base on the
assessment of graduated students of the two university of transportation in the North of
Vietnam as University of Transport and Communication, University of Transport and
Technology. The paper is structured into four sections. After this introduction, Section 2
describes the research methodology and data. Section 3 present the results of research.
Finally, the Section 4 will be some discussion and conclusions.
533
2. Research Methodology and Data
2.1. Research Methodology
In this study, the quality of vocational training is based on definition in Harvey
(2006) and Marko Savic (2016) whereas quality is defined as fitness for purpose of a
product or service. From the demand‘s perspective, fitness for purpose defines quality as
meeting the customer specification, needs or requirements. Thus, quality of vocational
training can be measured as the satisfaction of the learner between the learning outcomes
achieved against the original goal; Learning contents are appropriate to the reality; Ability
to apply for a job.
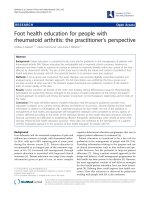
After studying the models and overview of factors affecting to quality of vocational
education training, the research uses 6 factors such as the learners (characteristics and
attitudes); teacher qualification (Knowledge, experience, sympathy with the students of the
lecturer); Facilities and training programs; Management capacity of university; Job
opportunities at the university; and labor market information quality of service.
Learners
A1
Qualifications of teachers
in the Institute
Facilities and training
programs
A2
A3
Quality of
VET
Management capacity of
the Institute
A4
Employment opportunities
at the Institute
A5
Labor market information
A6
Figure 1. Relationship between the research variables
Base on the list of factors affecting to quality of vocational training, the survey was
designed to collect student assessments of the quality and influencing factors. The main
part of the questionnaire consisted of 33 observed variables, of which 30 observed
variables were used to measure students' perceptions about the six influencing factors of
training quality, the other three measure training quality. Specifically, table 1 presents the
list of observed variables which are Likert scale survey questions (1. Do not like; 2.
Dislike; 3. Normal; 4. Like; 5. Like so much)
534
Table 1: List of observed variables
Code
Observed variables
Learner
NH1
Your apply based on your ability and family conditions.
NH2
You always get support from your family.
NH3
You are trying to learn a career to find a job
NH4
Before the course, how much knowledge do you have?
NH5
You are always optimistic about your job opportunities.
Teacher Qualification
GV1
Do teachers have a good knowledge of the relevant fields?
GV2
Are teachers experienced in practical matters?
GV3
GV4
GV5
GV6
Is the practical skill of the teacher well-versed?
Is the teacher's communicative ability easy to understand?
Is the classroom management skill of the teacher good?
How well is the coordination ability of teachers in management of
class activities?
Facilities and training programs
VC1
Are the presentation facilities (tables, microphones, projectors,
equipment) meeting the requirements of the lecture?
VC2
Does the quality of modeling, simulation, and practical equipment
meet the requirements of the lecture?
VC3
The quality of the materials (syllabus, lectures, reference materials)
prepared for the course is sufficient?
VC4
Are there many situations, such as related facts, that are included in
the lecture?
VC5
Is the training mix between theory and practice appropriate?
VC6
Do learning conditions (furniture, lighting etc.) meet the
requirements of the learner
Management capacity of the Institute
QL1
School-based policies that match learners
QL2
Management competence in all aspects of the field is good.
QL3
The School‘s culture (timetable, uniforms ...) are friendly, positive?
QL4
QL5
School security is always good.
The school has a policy of exempting tuition fees for outstanding
students or special circumstances
Job opportunities at the Institute
VL1
The Institute provides supportive policies for graduates.
VL2
Students who have achieved excellent academic results are kept in
a school setting.
VL3
100% of students after graduation get jobs
535
VL4
The Institute has a close relationship with the business of students
after graduation.
Labor‟s market information
TT1
The Institute provides timely labor market information.
TT2
School trains depend on market needs
TT3
Learners can easily grasp the recruitment information.
TT4
Students feel satisfactory with information supported by school.
Quality of VET
CL1
The satisfaction of the learner between the learning outcomes
achieved against the original goal.
CL2
Learning contents are appropriate to the reality.
CL3
Ability to apply for a job.
The study uses the method of Exploratory Factor Analysis – EFA and Multiple
Regression Analysis, using SPSS 21 to get the analytical results.
2.2. Data
By using the EFA method, the sample of the study requires a minimum of 5
observations per variable (Hair.et.al, 1998), thus with the 33 observed variables, the survey
needs to collect data of at least 165 respondents. The study has sent randomly 350 questioners
to graduates of University of Transport and Communication, University of Transport
Technology (the two universities training on transportation in the North of Vietnam) and
finally the number of respondents were 275 (satisfies the sample‘s requirement).
Table 2. The characteristic of respondents
Evaluation Criteria
Frequency
Percent, %
Sex
Male
202
73.5
73
26.5
From 18 to 25
256
93.1
From 26 to 35
10
3.6
From 36 to 45
6
2.2
Over 45
3
1.1
Road and Bridge Construction
93
33.8
Automotive Technology
91
33.1
Finance - Banking
57
20.7
Information Technology
34
12.4
Female
Age
Study
Source: Base of data collection
536
The data analysis process included: Descriptive statistics, Evaluate the reliability of the
scale over Cronbach's Alpha; Exploratory factor analysis (EFA); Multiple regression analysis
Overall regression function:
= 𝛽1 + 𝛽2 𝐻 + 𝛽3
+ 𝛽4
+ 𝛽5𝑄 + 𝛽6
+ 𝛽6
(1)
3. Results of research
The descriptive analysis results of training quality show that the average grade point
above average level is 3.28 still low, the standard deviation is relatively small 0.8 show
that the level of training quality of the learners is quite similar. In the measured aspects, the
learner rated the ―Ability to apply for a job‖ (CL3) as highest aspect with average level
3.39 and the lowest in the ―The satisfaction of the learner between the learning outcomes
achieved against the original goal‖ (CL1) of 3.12. There are, however, no significant
differences in the assessment scores from learners as seen in Table 3 below.
Table 3. Evaluation results of VET quality at present
N
Range
Minimum Maximum
Mean
Std.
Deviation
CL1
275
4
1
5
3.12
.688
CL2
275
4
1
5
3.31
.808
CL3
275
4
1
5
3.39
.915
General assessment
275
4
1
5
3.28
0.80
Source: Analysis results by SPSS software
To the learner factor (removes NH5 due to lack of credibility needed through EFA
analysis), the analysis showed that the average score was above the average of 3.45, the
standard deviation was relatively small at 0.92. In aspects of the learner-factor survey, the
highest rating was "3.93" aspects "You are trying to learn a career to find a job" (NH3),
and lowest rating was "Before the course, how much knowledge do you have?" (NH4) with
2.98. This demonstrates the need for a career and understanding of the career still have a
gap in the learner's perceptions.
For the teacher qualification, the results of the analysis showed that the average
grade point of the 5-points Likert scale is 3.48, the standard deviation is quite small 0.89.
This shows that the level of the learner's perception of the teacher's level is quite
satisfactory. In terms of teacher evaluations, the highest rating "Are teachers experienced
in practical matters" that was rated (GV2) at an average of 3.64 and lowest at "How well is
the coordination ability of teachers in management of class activities" (GV6), 3.31.
For the factor of facilities and training programs, the analysis results show that the
average rating score perceived is 3.10, the standard deviation is quite small 0.98. This
indicates that the level of perceptions of the learners in terms of facilities and training
programs is quite good. In aspects of facilities and training programs assessment, the
highest rating is "The quality of the materials (syllabus, lectures, reference materials)
537
prepared for the course is sufficient" (VC3) with average of 3.32 and the lowest in terms of
―Do learning conditions (furniture, lighting etc.) meet the requirements of the learner
"(VC6), 2.87.
For the factor of management capacity of university, the average rating score
perceived on average in the 5-points Likert scale is 3.33, the standard deviation is quite
small 0.95. This shows that the level of the learner's perception of the management
competence of the school is quite good. In terms of the assessed aspect, the highest is in
the aspect of "The school has a policy of exempting tuition fees for outstanding students or
special circumstances" (QL5) average of 3.77 and the lowest is "University-based policies
that match learners" (QL1) with 3.08.
The average rating score perceived on job opportunities factor is 3.29, the standard
deviation is quite small 1.07. This indicates that the level of the learner's perception of the
job opportunities at the training school is relatively good. In terms of the assessed aspect,
the highest was ―Students who have achieved excellent academic results are kept in a
university setting" (VL2) with 3.56 and the lowest for "100% of students after graduation
get a job "(VL3), 2.92.
The analysis results of labor market information show that the average rating score
perceived is 3.18, standard deviation 1.02. This shows that the level of perceptions of learners
in the labor market information is quite good. In terms of the assessed aspect, the highest was
the "School trains depend on market need" (TT2) with average of 3.26 and the lowest for the
"Students feel satisfactory with information supported by university" (TT4) is 3.09.
The analytical results show that the Cronbach Alpha coefficients of both 6 quality
influencing factors and training quality are greater than 0.6. Thus, factors are measured by
the observed variables in the study that ensure reliability and relevance. Specifically, (i) the
Cronbach Alpha coefficient of learner factor is 0.638; (ii) the "teacher qualification" factor‘s
Cronbach Alpha coefficient is 0.897; (iii) the Cronbach Alpha coefficient of ―Facility and
training programs‖ factor is 0.837; (iv) The ―management capacity of the Institute‖ test result
in Cronbach Alpha is 0.806; (v) the employment opportunities‘ Cronbach Alpha coefficient is
0.797 (vi) the Cronbach Alpha coefficient of ―labor market information‖ factor is 0.872; and
the ―quality of the training‘s Cronbach Alpha coefficient is 0.612.
The results of the exploratory analysis for the variables of affecting factors
(independent variables) after the removal of the variable s with a small factor loading
factor of 0.5 (NH5) by orthogonal rotation showed that the KMO coefficient was greater
than 0.5 (0.895), Bartlett's test with a p -value of 0.000 is less than 0.05, the explanatory
variance is greater than 50% (66.551%), the factor loading factor of observation variables
is greater than 0.5, the observed variables converge to six factors such as theoretical model.
This suggests that research data using factor analysis is appropriate. We use the same
method for dependent variable (quality of vocational training) so the KMO coefficient is
greater than 0.5 (0.638), Bartlett's test has p- value less than 0.05 (0.000), the factor
loading factor is greater than 0.5, the observed variables converge on a single factor. This
538
shows that using factor analysis is appropriate, the dependent variable "Quality of VET" is
a one-way scale.
Use the least squares (OLS) to determine the regression coefficient βi
equation 1. The result is presented in table 4.
of the
Table 4. Results of multivariate regression analysis
Model
Unstandardized
Standardized
Coefficients
Coefficients
B
1
(Constant)
Std. Error
.048
.135
NH
1.086
.038
GV
.010
VC
t
Sig.
Beta
.354
.723
.908
28.479
.000
.034
.010
.296
.767
-.033
.036
-.034
-.913
.362
QL
.060
.037
.060
1.633
.104
VL
.017
.031
.021
.551
.582
TT
-.101
.034
-.124
-2.987
.003
Source: Authors‟ calculation
According to Table 4, Sig. The coefficients β2, β3, β4 are higher than the 5%
significance level; so they are not statistically significant, meaning that the qualification of
the teacher, material facilities and training program, management capacity and job
opportunities at the training school do not affect the quality of the training. It is not that
these factors are not influenced by this, but the learner's assessment of these conditions is
to ensure that they have a good learning outcome. This can be explained by the support
policy of the Ministry of Transport to improve the output quality in some universities, so
the training universities in the transport sector today are quite equal in quality and quantity
from training programs to facilities
4. Discussion and conclusions.
The regression results show that "Learners - NH" have a great positive effect on the
training quality of the school. Learners are the key factor determining the quality of
training. This is also very accurate, because human beings are always the core of all
change. Beside that, the results also show that one of most disadvantage of current
vocation training in general and in transportation training in particular in Vietnam is that
training in schools is not close to the actual labor market demands, there is no link between
training schools and businesses. These facts have been resulted from the vocational
training curriculum, program have many contents that are formalistic, not updated,
supplemented regularly to be appropriate with the requirements of the labor market. The
quality and effectiveness of training of many vocational training institutes are still low and
539
not in line with the human resources demands of each sector and each locality. The
relationship between VET institutes and businesses is loose.
To improve the quality of transportation training, there are some policy
recommendations have been suggested.
Firstly, is improvement of awareness of learner‘s role. Students need to negotiate
with themselves in the learning process to achieve the set forth target. Many studies of
universities transport technology show that students have different needs, motivations, and
expectations of a major, a subject, and in the course of learning they frequently adjust their
study plan to be appropriate with the objectives of the course. Knowledge is always
redefined when students discover more about it, and may be replaced by more appropriate
new learning strategies in the future.
Second, developing the forecast of human resource and training demands following
the sector structure, profession and qualification to be suitable to the requirements of socioeconomic development in each period. To renovate the mechanism of receiving and
processing information, building database in the field of vocational training. Strengthening
the link between training and businesses, to improve regulations so that businesses are
subject of vocational training, participating in all stages of training process. Apply
technology to build a system linking supply and demand of training in the whole system.
Thirdly, enhance awareness of the role and morality of the teacher, so that the teachers
need to know their qualification, capacity and then make efforts to improve their knowledge,
update new knowledge, take the international standard training program as a measure to learn,
develop and improve the quality of the lecture. Encouraging enterprises, productions, business
and service establishments to participate in training and fostering of vocational skills for
teachers in the form of receiving them to practice at enterprises for updating and improving
practical skills, accessing to new technology, etc. Training, fostering and standardizing for
formation of a team of managers who have professional working manner.
Finally, continue to innovate teaching and learning methods, taking students as the
centre of the training process. Basically, renovate forms and methods of examination and
test in universities education. To attach the role and responsibility of the businesses, from
the determination of the requirements on exam questions related to jobs, self- control and
self-responsibility to the knowledge and skills to be included in the examination and test.
References
1. Australia Government (Department of Education and Training), 2016, Quality
assessment in vocational education and training, Discussion Paper, January 2016.
2. Cheng, Y.C., ‗Paradigm shifts in quality improvement in education: Three waves
for the future‘, Speech presented at the International Forum on Quality Education for the
Twenty-first Century (coorganised by UNESCO-PROAP, National Commission for UNESCO
of Ministry of Education, and National Institute of Educational Research, China), Beijing, 12–
15 June 2001. />3. Hair Jr., J. F. et al.,1998, Multivariate Data Analysis with Readings,
Englewood Cliffs, NJ Prentice-Hall.
540
4. Harvey, L., 2006, 'Understanding quality', Section B 4.1-1 of ' Introducing
Bologna objectives and tools' in Purser, L. (Ed.) EUA Bologna Handbook: Making
Bologna work, Brussels European University Association and Berlin, Raabe.
5. Harvey, L and Green, D.,1993, ―Defining quality‖, Assessment and Evaluation
in Higher Education, Vol. 18 No.1, pp. 9-34. doi10.1080/0260293930180102.
6. Liesbeth Baartman, Judith Gulikers & Asha Dijkstra, 2013, Factors influencing
assessment quality in higher vocational education, Assessment & Evaluation in Higher
Education,
DOI:10.1080/02602938.2013.77113
( />ality_in_higher_vocational_education [accessed Apr 23 2018].
7. Marko Savic, 2016, Quality in Technical and Vocational Education and
Training (TVET), Published on August 7, 2016. />8. Maria Emília Galvão, 2014, ―Making the case for vocational education and
training improvement: issues and challenges‖, Quality Assurance in Vocational Education
and Training: A collection of articles, European Training Foundation, Turin, 2014.
9. Nguyen Chi Truong, 2013, ―Analysis of factors influencing to vocational
education training in Vietnam: implication for improving its quality period 2013 – 2020‖,
Dissertation
10. Nguyen Hoang Lan, Nguyen Minh Hien, 2015, Employers' Assessment on
Quality of Higher Education: A Study of Graduates in Engineering and Technology,
Educational Research Journal, Volume 31, Number 2 (2015) 1-14
11. Pham Vu Phi Ho and Nim Ngoc Yen, 2017, Student evaluates the training
quality of the Faculty of Foreign Languages and Culture, Van Hien University, Journal of
Science, Van Hien University, 5 (3), pp. 74-89
12. Son Trinh Van, et.al. 2016, Assessing the quality of training university from
human use labor - university of economic - university of Hue, Projects: Higher Education
Quality Management - The case of Hue University of Economics.
DOI10.26459/jed.v118i4.3735
13. Stephen Billett, 2000, Defining the demand side of vocational education and
training: industry, enterprises, individuals and regions, Journal of Vocational Education
and Training, 52:1, 5-31, DOI: 10.1080/13636820000200104
541